America’s New Map of Power 2026: Data Centers, Grid Triage, and the Backlash That Will Not Stop the AI Buildout
The AI data center boom has moved from abstract tech hype into physical infrastructure conflict. The map now runs through substations, water tables, transmission corridors, tax incentives, state permits, private power campuses, local lawsuits, and public backlash. By May 2026, Americans are angry, communities are fighting back, projects are being blocked or downsized, and regulators are openly trying to separate real load from speculative grid requests. But the deeper Pattern Nexus read is that backlash does not stop the buildout. It filters it, reroutes it, and forces the system to move toward places with power, land, political permission, and private energy control.
Deep macro plumbing, liquidity mechanics, and system analysis. No sponsors. No paywalls.
Support Pattern Nexus
Independent macro research and system-level analysis. No sponsors. No paywalls.
Pattern Nexus Premium Research
America’s New Map of Power 2026
Data centers, AI compute, substations, transmission corridors, gas turbines, nuclear-adjacent campuses, water fights, county boards, tax incentives, lawsuits, moratoriums, and public anger are usually treated as separate stories. Pattern Nexus reads them as one connected layer: the new physical operating system of AI.
Published: May 30, 2026 • By Christopher Grenke • Premium Systems Research
Premium Quick Read
The first version of this thesis was simple: AI was going to reorganize the American power map. That was true, but it was incomplete. The 2026 update is sharper: AI is forcing a national grid-triage process. The question is no longer only where data centers want to go. The question is where electricity can actually be delivered, where water and cooling can be permitted, where transmission can be expanded, where local opposition can be managed, and which projects are real enough to deserve grid planning.
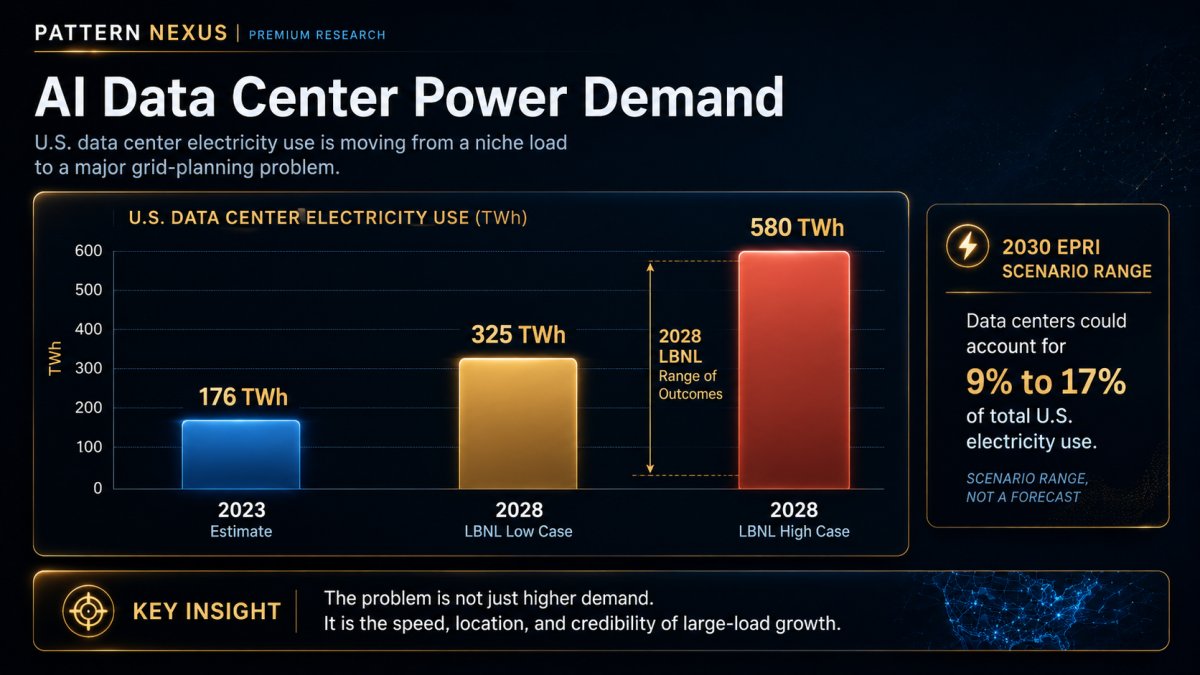
The numbers are now large enough to move from tech story into infrastructure story. LBNL estimated U.S. data center electricity use at 176 TWh in 2023, roughly 4.4 percent of U.S. electricity consumption, and projected a 2028 range of 325 to 580 TWh [1]. Reuters summarized the same DOE-backed report as a potential near-tripling by 2028 [2]. EPRI’s updated scenario work pushes the planning frame further by putting data centers at 9 to 17 percent of U.S. electricity use by 2030 [3].
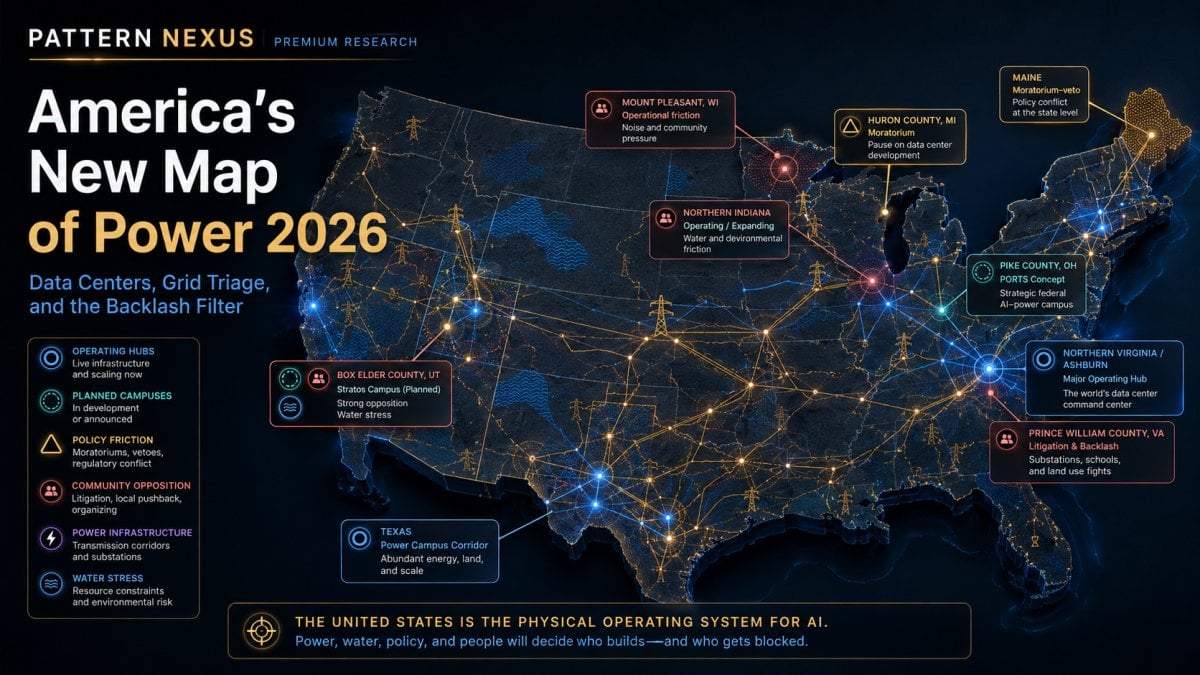
The public backlash is now part of the map. Gallup found that 71 percent of Americans oppose AI data centers being built in their local area [10]. Ohio paused its data center tax break after projected exemption costs jumped from $136 million to nearly $1.6 billion [12]. Maine’s legislature passed a large-data-center moratorium before Governor Janet Mills vetoed it [13]. Huron County, Michigan approved a three-year moratorium [30]. Utah’s Stratos project became a national symbol of the AI-era collision between land, water, gas, state power, and public resistance [16][17][18][19].
But this does not mean the AI buildout stops. It means the buildout gets filtered. Weak projects die. Overstated projects get exposed. Politically exposed projects get delayed. Strong projects move toward power, land, private generation, retired industrial sites, federal land, state backing, and better-controlled permission environments. The system response is not retreat. It is routing.
Why This Is Premium
The normal way to cover this story is to split it into disconnected boxes. One article covers utility load growth. Another covers a county board fight. Another covers a new hyperscale campus. Another covers tax incentives. Another covers AI chips. Another covers electricity prices. Another covers water use. Each box gets explained separately, and the pattern disappears.
That is not how the system works. AI compute does not exist as a floating software product. Compute needs chips. Chips need buildings. Buildings need land. Land needs zoning. Data centers need power. Power needs generation, substations, transmission, interconnection, and ratepayer approval. Cooling needs water, air, or thermal engineering. Public legitimacy needs a benefit story. Every layer becomes a permission gate.
This is why the article has to be written through the Pattern Nexus lens. The world is not divided into topics. It is divided into layers. AI data centers are the perfect example because they force the digital world back into the physical world. They expose the hidden stack: capital, land, grid, water, cooling, policy, public approval, legal exposure, and strategic framing.
This article keeps the evidence layer separate from the interpretation layer. The evidence comes from LBNL, EPRI, NERC, FERC, PJM, Gallup, AP, Reuters, DOE, local reporting, project materials, and project trackers. The Pattern Nexus layer then asks what the structure means when all those pieces are placed back together: AI is not just scaling through models. It is scaling through the physical permission stack of the country.
Executive Thesis
The United States is not building AI data centers as isolated real estate projects. It is building a new industrial layer on top of the electric grid. That industrial layer is colliding with planning systems that were never designed for hundreds of gigawatts of speculative, phased, AI-driven large-load requests.
The public backlash matters. It can block projects. It can void rezonings. It can create moratoriums. It can make tax incentives politically toxic. It can force utilities and state regulators to ask who pays. But it will not structurally stop the buildout because AI compute has already moved into the strategic-infrastructure category. FERC and PJM are already working through large-load forecasting, co-location, curtailment, and credibility questions because the grid has to decide which requests are real enough to plan around [7][8][9].
That means the next phase is not “AI wins” or “communities win.” The next phase is sorting. Projects with power, land, credible financing, interconnection, public benefits, and strategic framing will survive. Projects that depend on vague capacity claims, opaque subsidies, weak water logic, and local political passivity will get cut down, delayed, or rerouted.
Pattern Nexus read: the backlash is not the end of the AI buildout. It is the filter that determines where the AI buildout is allowed to survive.
System Map
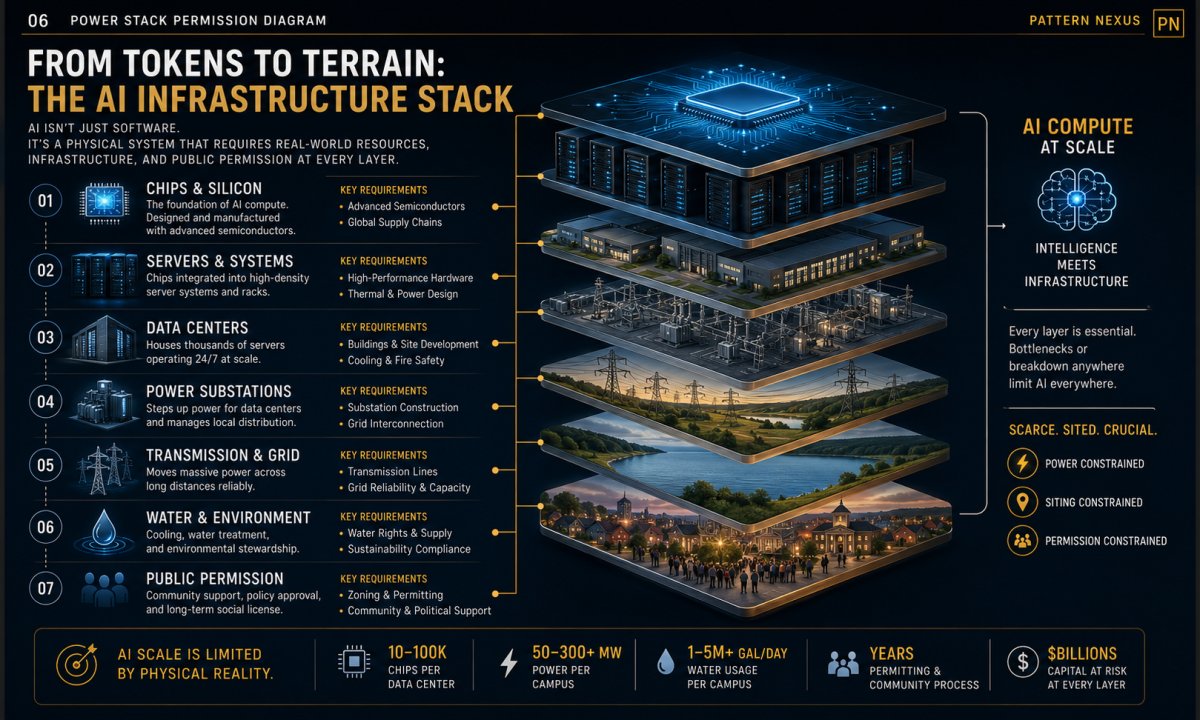
The New AI Infrastructure Stack
The AI stack is usually described as chips, models, data, software, and users. That is incomplete. The full stack now runs through power contracts, substations, transmission access, water permissions, zoning, tax incentives, public legitimacy, state industrial policy, and national-security framing.
Layer
What It Means
Control Gate
PN Pattern
Compute Demand
AI models, inference, training, cloud services, robotics, finance, defense, and automation need more compute.
GPU supply, capital, cloud customers
The upstream pressure source
Data Center Shell
Physical buildings that hold servers, cooling systems, backup power, fiber, and security.
Land, zoning, permits, construction
The cloud becomes real estate
Power Contract
The facility needs deliverable electricity, not just a public announcement.
Substations, transmission, load forecasting, and reliability planning decide if the project is real.
FERC, PJM, ERCOT, utilities, state regulators
Speculation gets filtered
Cooling / Water
Thermal management turns AI into a local water, air, noise, and environmental issue.
Water rights, dewatering permits, aquifer risk, cooling design
Digital heat becomes local politics
Public Legitimacy
Residents ask why they should absorb noise, bills, water stress, traffic, tax breaks, and landscape change.
County boards, courts, referenda, moratoriums, public comments
The backlash becomes a routing force
Strategic Framing
AI is framed as national security, economic competitiveness, industrial policy, and future infrastructure.
DOE, state agencies, federal land, public-private deals
Strategic status outranks ordinary project politics
The key is that every layer has a gate. The buildout does not move because someone announces a campus. It moves when enough gates open at the same time.
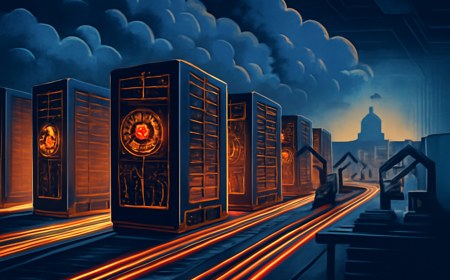
The cloud becomes physical. AI demand moves through chips, servers, buildings, substations, transmission corridors, water/cooling systems, county boards, tax deals, and public legitimacy. The bottleneck is not one thing. It is the stack.
Choose Your Reading Level
This article is built in three versions. Start with the version that fits how deep you want to go, then move down if you want the full system-level breakdown.
Version 1
Reader-Friendly Version
The simple version is this: AI is not living in the cloud anymore. It is landing in counties, on farmland, near substations, next to power plants, inside old industrial corridors, and beside communities that are only now realizing the scale of what is being built around them.
The public was told AI was software. But AI at scale is not only software. It is buildings, power lines, cooling systems, gas turbines, water use, tax deals, backup generators, utility upgrades, noise, traffic, and sometimes billions of dollars in infrastructure that someone has to pay for.
That is why the backlash is growing. People are not just mad because they dislike technology. They are mad because they are starting to see the physical cost of a digital economy that was sold as invisible.
The Simple Pattern
The simple pattern is this: AI data centers are not just technology projects. They are physical infrastructure projects. Once you understand that, the whole story changes.
A normal person hears “AI” and thinks of ChatGPT, image generators, robots, automation, search, coding tools, or maybe job replacement. That is the visible layer. But under that layer is compute. Under compute are data centers. Under data centers is power. Under power is land, transmission, generation, water, zoning, permits, taxes, and public approval.
That is why the public backlash matters. People are not fighting an app. They are fighting the industrial footprint behind the app. This is what Pattern Nexus has been tracking from the beginning: the moment abstract systems hit physical constraints, the hidden control layer becomes visible.
The mainstream sees data centers as digital infrastructure. Pattern Nexus sees them as the new physical permission stack of the AI economy.
The Cloud Became Physical
The word “cloud” was always misleading. It made the internet feel weightless. You uploaded a file, streamed a video, opened an app, searched something, or asked an AI model a question, and the answer just appeared. It felt like the internet floated above the ground.
AI breaks that illusion. AI needs power density. It needs racks of GPUs. It needs cooling. It needs substations. It needs transmission upgrades. It needs backup generation. It needs land. And because it needs all of that, it becomes visible to the public in a way earlier digital infrastructure often did not.
People are starting to realize that “the cloud” is not above them. It is beside them. It is being built down the road. It is asking for a tax break. It is pulling from the grid. It is creating noise. It is using water or energy for cooling. It is asking the county board for approval. It is showing up in utility forecasts.
LBNL’s numbers make that reality hard to ignore. U.S. data centers were already estimated at 176 TWh in 2023, with a 2028 range of 325 to 580 TWh [1]. That means the question is no longer whether data centers matter to the power system. They already do. The question is how fast the demand expands and who absorbs the cost of that expansion.
The cloud becomes physical. AI compute only works after chips, servers, buildings, substations, transmission, cooling, water access, zoning, and public permission are all in place.
Why People Are Angry Now
The anger is not random. People are asking normal questions that should have been asked before these projects were framed as automatic progress.
How much power will this use? Will my utility bill go up? How much water is needed? Will backup generators run near homes? Will there be constant fan noise? How many permanent jobs are actually created after construction? Why are giant companies getting tax breaks? Who pays for the substation? Who pays for the transmission line? Why does this feel decided before residents even understand the deal?
That is why Gallup’s number matters. When 71 percent of Americans say they oppose AI data centers being built in their local area, that means this is no longer a niche issue [10]. It means the data center industry crossed into public awareness before building a durable legitimacy story.
The Verge’s reporting on the Gallup and Pew findings also shows what the public is actually worried about: water, electricity, quality of life, living costs, pollution, and utility bills [11]. That matters because this backlash is not only anti-technology emotion. It is household-level economic and environmental pressure becoming political.
Erin Brockovich entering the issue matters too because it turns scattered local complaints into a national pattern. One county’s water fight becomes another county’s playbook. One noise complaint becomes another zoning hearing’s evidence. One tax break fight becomes another state’s budget warning [31].
This is how backlash becomes a system. It starts local, then it learns.
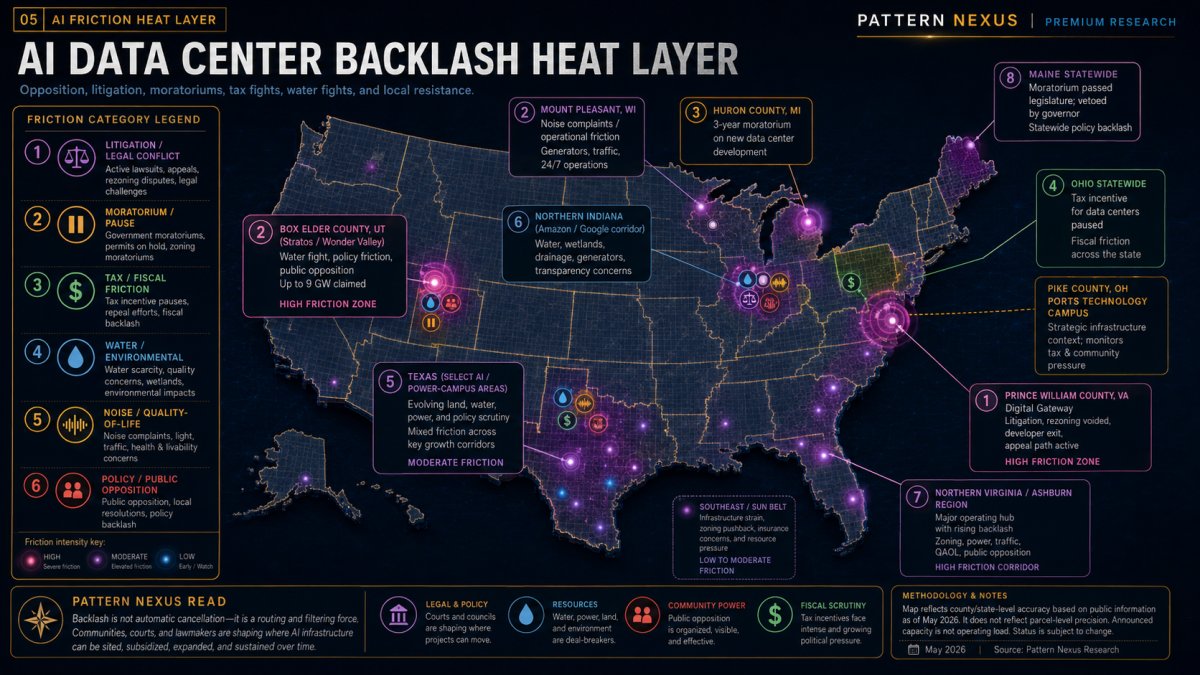
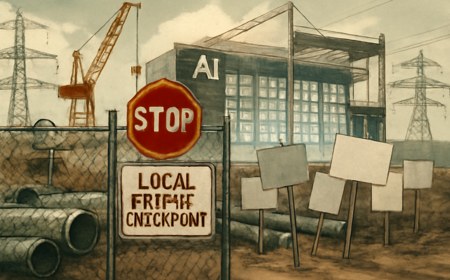
Backlash heat layer. Opposition is not automatic cancellation. It is a routing force: litigation, moratoriums, tax fights, water disputes, noise complaints, and local organizing pressure.
The Projects That Changed the Map
The map changed because specific places became proof points. This is not just a broad story about “some people are upset.” There are real projects, real moratoriums, real court fights, real tax pauses, and real public pressure points.
Prince William, Virginia
The Digital Gateway fight became the clearest example of legal and community backlash changing the project path. The project was approved, challenged, voided over notice issues, upheld by the Court of Appeals, and then Compass exited while QTS continued toward the Virginia Supreme Court [20][21].
Box Elder County, Utah
Stratos became a national symbol of the new AI infrastructure fight: giant land footprint, gas-backed power plan, water objections, public comments, referendum pressure, and state-level rule changes [16][17][18].
Pike County, Ohio
The DOE/SoftBank/AEP PORTS campus shows the strategic-industrial version of the buildout: federal land, foreign capital, a huge gas-power plan, transmission upgrades, and AI framed as national economic strategy [14][15].
Ohio Tax Break Pause
Ohio pausing its data center tax break shows the fiscal backlash. The issue is not only power and water. It is whether the public should subsidize massive facilities that may create limited permanent jobs [12].
Maine
Maine’s statewide moratorium passed the legislature and was then vetoed by Governor Janet Mills. That matters because it shows the split between grid-risk caution and rural redevelopment opportunity [13].
Huron County, Michigan
Huron County’s three-year moratorium shows local governments buying time. They are realizing their zoning language, water rules, noise policy, and grid-cost frameworks were not built for AI-scale projects [30].
Wisconsin
Microsoft’s Fairwater project in Mount Pleasant shows operational friction. Even after a project is approved and built, fan noise, cooling systems, and nearby resident complaints can become part of the AI infrastructure cost [22][23].
Indiana
Amazon and Google’s Indiana buildouts show the “still moving, still contested” version of the story. Projects continue, but the fight shifts into water, wetlands, drainage, dewatering, generators, and transparency [24].
That is the updated pattern. The public is not only reacting to AI in theory. The public is reacting to the physical footprint of AI.
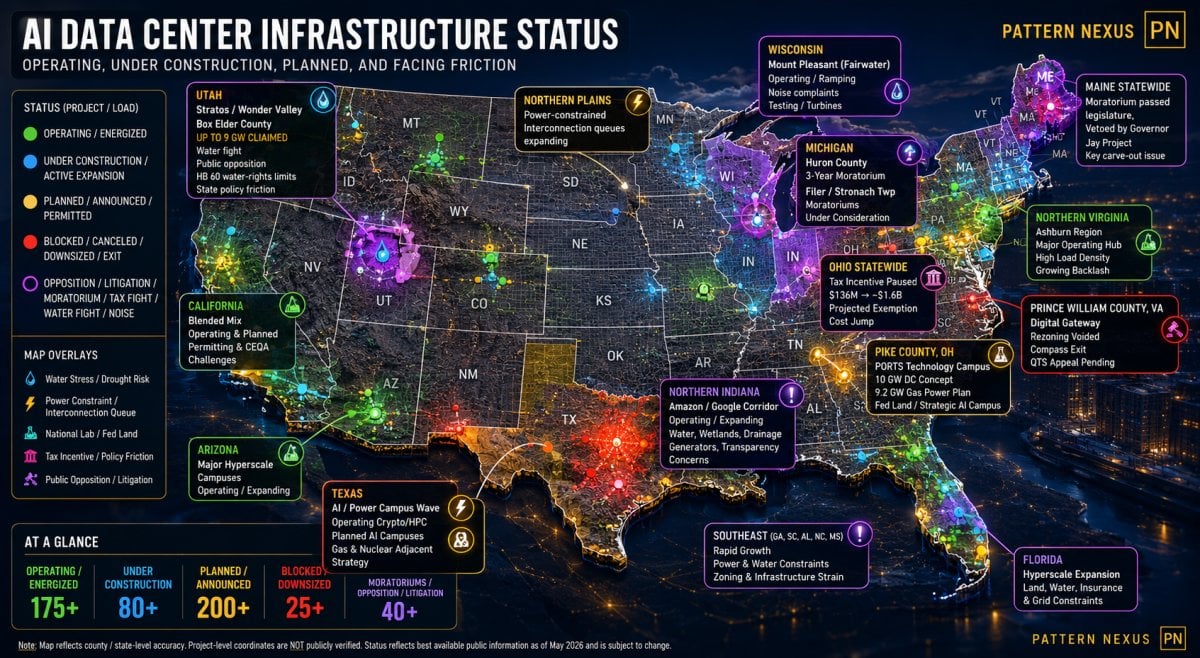
National status map. Operating projects, announced projects, blocked or voided projects, and opposition layers must not be collapsed into the same marker. This is a county/state-level map, not fake parcel precision.
The Backlash Is Real, But It Does Not Stop the Buildout
This is where people get the wrong read. They see backlash and assume the buildout stops. That is not how systems behave.
Backlash can stop a project. It can stop a zoning change. It can push a developer out. It can make a county nervous. It can make a governor veto or pause something. It can make investors price in more political risk. All of that matters.
But it does not erase the upstream demand. AI companies still need compute. Compute still needs data centers. Data centers still need power. The power requirement does not vanish because one county says no.
What happens instead is sorting. Projects move toward places with fewer blockers. Retired industrial sites become more valuable. Federal land becomes more useful. Gas-backed campuses become more attractive. Nuclear-adjacent sites get attention. Former coal, uranium, steel, paper, and industrial sites become strategic again. Counties desperate for tax revenue become targets. Utilities that can create large-load structures become power brokers.
The backlash matters, but mostly by changing the map. It creates a filter between fantasy projects and executable projects.
PN read: backlash does not end the AI buildout. It changes where the AI buildout is allowed to survive.
Who Is Actually Building This New Map?
One reason the public is behind the curve is that the actor list changed. People still think this is just Amazon, Microsoft, Google, Meta, and maybe a few building owners. That is no longer enough.
The new map includes hyperscalers, colocation firms, AI companies, utilities, private equity, infrastructure funds, energy developers, gas suppliers, nuclear developers, state development agencies, federal land managers, and local governments. The data center is only the visible building. Behind it is a capital and power stack.
SoftBank and AEP Ohio at the PORTS site show this clearly. That project is not just “a data center.” It is a power-and-compute campus tied to federal land and a massive generation plan [14][15]. Stratos in Utah shows the same thing from another angle: the project is framed around off-grid or self-powered AI capacity, land control, state development structure, and natural gas infrastructure [16][19]. Fermi’s Project Matador shows the nuclear-adjacent version [28][29]. Texas projects show the gas, land, and ERCOT optionality version [27].
The next winners are not just the companies with the best model. The winners are the ones that can secure a full stack: power, land, cooling, grid rights, political cover, tax treatment, capital, and a public-benefit story that survives contact with residents.
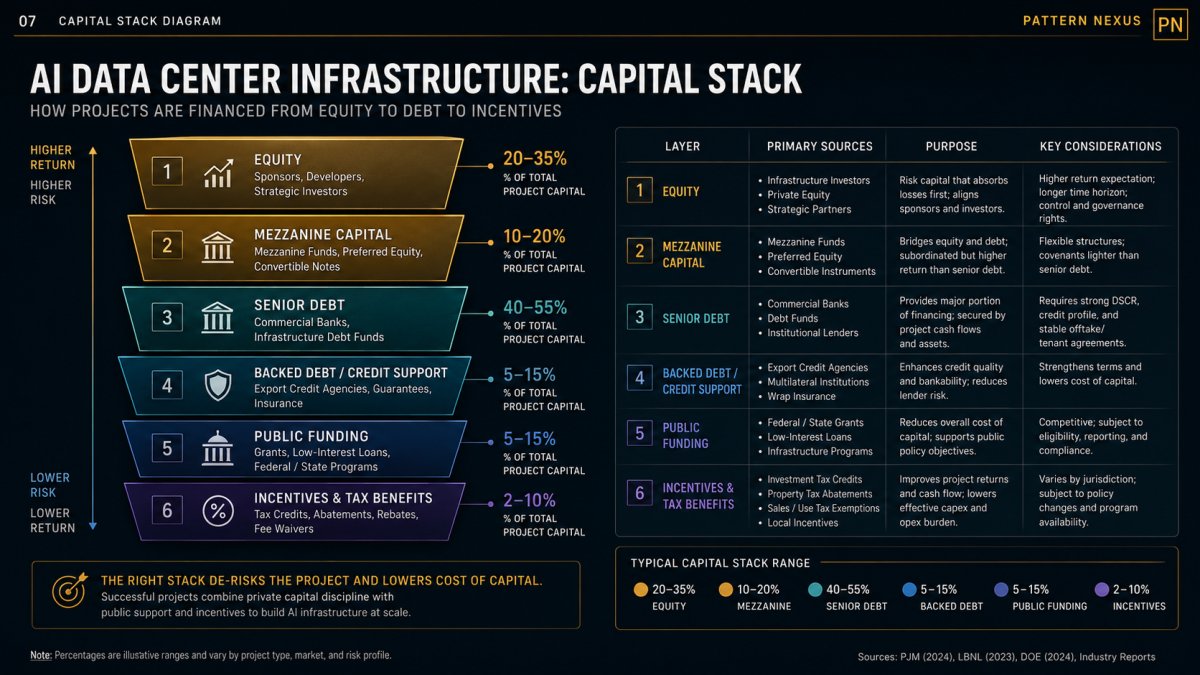
Capital stack. The investable object is not just a building. It is a stack of hyperscaler demand, land, grid access, generation, capital, tax treatment, and public permission.
The Human Layer
The human layer is where the article has to slow down, because this is the part that gets stripped out of most infrastructure analysis. Ordinary people are not experiencing AI as a strategic national abstraction. They are experiencing it as a local disruption.
They see a project announcement that sounds already decided. They see tax incentives going to giant companies while their own bills keep rising. They hear promises about jobs, but many data center jobs are front-loaded into construction, while the long-term operating headcount can be much smaller than the land and power footprint makes people expect. They worry about water. They worry about generators. They worry about noise. They worry about whether their town is becoming a machine room for an economy that will not include them.
This is why the backlash will not stay only environmental. It will become a cost-of-living issue, a local-control issue, a trust issue, and a class issue. It will be framed as “who gets the upside and who absorbs the downside?” That framing is powerful because people can feel it directly.
Pattern Nexus read: once AI infrastructure becomes visible, the public starts asking the same question across every layer of the system: why does the cost land here while the benefit goes somewhere else?
Why the Map Has to Show Status
The graphics cannot be a generic glowing U.S. map with random dots. That would miss the entire point.
The map needs to show status and friction. Operating projects are not the same as announced projects. Planned megawatts are not the same as energized load. Community opposition is not the same as cancellation. And a county-level location is not the same as an exact parcel.
Green: operating or energized campuses
Blue: under construction or active expansion
Gold: planned, permitted, or announced projects
Red: blocked, canceled, or materially downsized projects
Purple ring: community opposition, litigation, moratorium, tax fight, water fight, or noise complaint
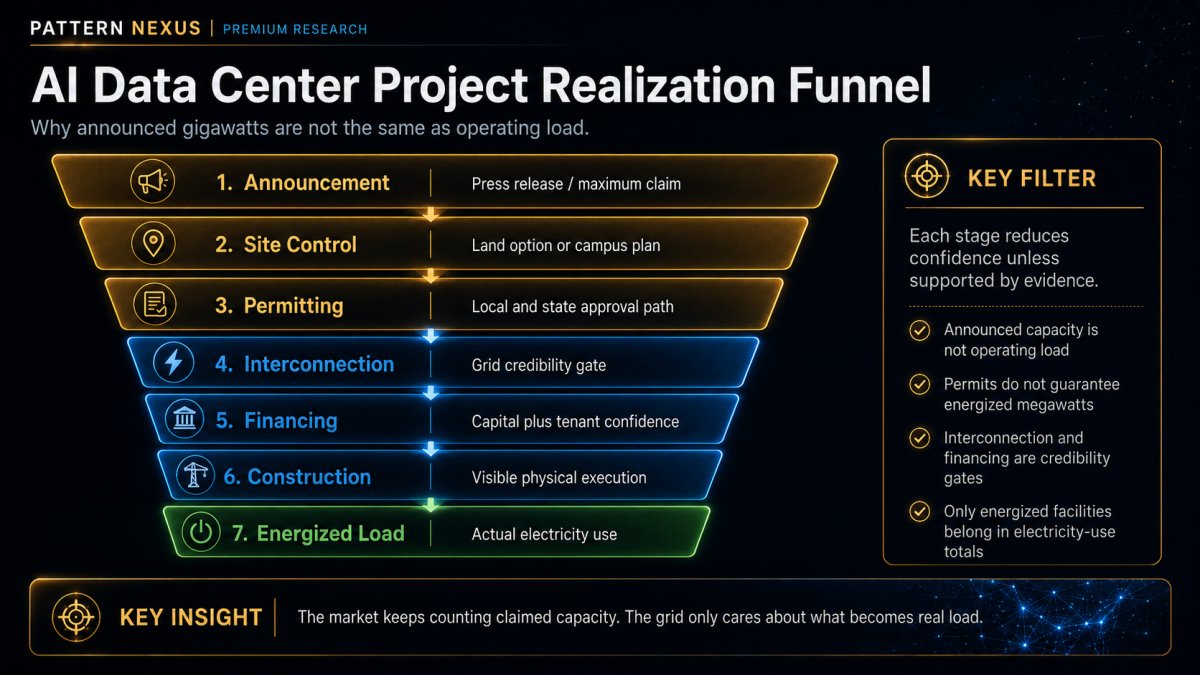
Project realization funnel. The market keeps counting announced capacity. The grid only cares about what becomes real load.
The Final PN Read
The AI buildout is not just a technology trend. It is a permission-stack event.
The winners are not simply the companies with the best model. The winners are the companies and capital stacks that can secure energy, land, cooling, interconnection, political cover, and public legitimacy faster than everyone else.
That is why this story connects to everything Pattern Nexus tracks. The modern economy is not controlled only by who has the best idea. It is controlled by who can move through the gates. AI is now hitting the gates: power gates, permitting gates, water gates, tax gates, local legitimacy gates, and national-security gates.
The public is not wrong to be angry. They are seeing the real costs of a digital system that was sold as invisible. But anger alone does not stop a strategic infrastructure buildout. It changes the route.
That is America’s new map of power in 2026.
Version 2
Non-Technical Advanced Version
The original Pattern Nexus thesis was that AI data centers would expose America’s real power map. That still holds. In fact, the thesis has gotten stronger. What changed is that the map is no longer just about where data centers are being built. It is now about which projects can survive the full permission stack.
A data center announcement is easy. Energized megawatts are hard. A press release can claim five, seven, or ten gigawatts of future campus capacity. But that does not mean the load exists. It does not mean the power is deliverable. It does not mean the grid can absorb it. It does not mean the water fight is solved. It does not mean the local politics will hold.
The updated frame is more precise: AI is forcing the country to triage large-load demand across a grid, permitting, water, tax, capital, and public legitimacy system that was not designed for this speed or scale.
The Original Thesis Was Right, But Too Clean
The original article framed America’s AI buildout around a new power geography. That was the correct direction. AI was never going to scale as pure software. At a certain point, the story had to become physical: land, electricity, transmission, cooling, substations, generation, and political permission.
The problem is that the first version of the story was still too clean. It treated the shortage like one big national power gap. The 2026 update shows something messier: the system is not just short power. It is short verified power, deliverable power, permitted power, politically acceptable power, and forecastable power.
That last word matters: forecastable. The grid is planned through forecasts. If speculative data center requests flood utilities and grid operators, the system has to decide which requests are real enough to plan around. If it underbuilds, strategic AI capacity gets constrained. If it overbuilds, ordinary ratepayers may get stuck with infrastructure built for projects that never materialize.
That is why this article is not only about “more data centers.” It is about credibility filtering. Who is real? Who has the land? Who has the contract? Who has the power path? Who has financing? Who can curtail? Who has water? Who can survive county politics? Who gets built?
The clean version was “AI needs power.” The accurate version is “AI needs a complete physical permission stack.”
The Demand Numbers Are Now Too Large to Ignore
The demand side is no longer fringe. LBNL’s updated data center energy report estimated U.S. data center electricity use at 176 TWh in 2023, about 4.4 percent of U.S. electricity consumption, with a projected 2028 range of 325 to 580 TWh [1]. That is not a marginal change. That is a new industrial electricity class.
Reuters summarized that finding as a potential near-tripling of U.S. data center power use by 2028 [2]. EPRI’s scenario work pushed the story further by projecting that data centers could consume 9 to 17 percent of U.S. electricity by 2030 [3]. That is a huge range because the actual outcome depends on project execution, AI hardware shipments, load factors, cooling, utilization, on-site power, and whether the announced project pipeline survives.
The number itself is not the only problem. The speed is the problem. Power systems do not scale at software speed. Transmission does not appear because a hyperscaler wants it. Turbines, substations, interconnections, rights-of-way, environmental reviews, and rate cases all have timelines.
Metric
Value / Range
Data Analysis Read
PN Read
2023 U.S. data center electricity use
176 TWh
Baseline industrial load already equal to roughly 4.4% of U.S. electricity use.
The cloud was already physical before most people noticed.
2028 LBNL low case
325 TWh
About a 13.1% compound annual increase from 2023 if the low case is reached.
Even the low case forces serious grid planning.
2028 LBNL high case
580 TWh
About a 26.9% compound annual increase from 2023 if the high case is reached.
The high case starts to behave like a new national industrial sector.
2030 EPRI scenario share
9–17% of U.S. electricity
Large enough to affect generation, capacity markets, rates, transmission, and public politics.
AI compute becomes central to power-market structure.
Gallup local opposition
71% oppose local AI data centers
Legitimacy risk is now quantifiable at the public-opinion layer.
Infrastructure expansion now faces a human approval gate.
That timing mismatch is the structural tension. AI capital wants to move at compute speed. The grid moves at infrastructure speed. Communities move at political speed. Courts move at legal speed. The friction comes from trying to force those different clocks into one project timeline.
Demand range chart. The point is not one exact forecast. The point is the envelope. Even the low case is enough to change grid planning. The high case creates full infrastructure stress.
The Speculative Pipeline Problem
The research also shows why gross pipeline numbers have to be treated carefully. A table showing hundreds of planned projects and hundreds of gigawatts of planned capacity does not mean those gigawatts will become actual load.
Some projects are real. Some are early-stage. Some are land plays. Some are power-option plays. Some are fundraising narratives. Some are phased campuses where the maximum capacity could take a decade or more to arrive. Some are politically impossible in their original form.
This is the difference between announced capacity and realized capacity. Announced capacity is a claim. Realized capacity is an energized facility drawing power.
Stage
What It Means
Why It Matters
Map Treatment
Promotional capacity
Maximum number used in press releases, investor decks, or campus descriptions.
Useful for ambition, weak as a grid forecast.
Gold outline only; label as claimed maximum.
Site-controlled capacity
Land is controlled, but power, water, permits, and financing may still be incomplete.
More credible than a press release, still not load.
Gold marker with site-control note.
Permitted capacity
Local or state approvals exist, usually in phases.
Political risk is lower, but grid and financing risk may remain.
Gold marker with permit layer.
Interconnection-backed capacity
Grid process has reached a more credible planning or agreement stage.
This is where utilities and regulators start taking the load seriously.
Gold/blue marker with substation icon.
Financed construction
Capital, customers, equipment, and construction timeline are visible.
Closer to real capacity, but still not full load.
Blue construction marker.
Energized load
The facility is operating and drawing power.
The only category that belongs in actual electricity consumption.
Green operating marker.
This is why the Nexus Hubbard example matters. A giant multi-gigawatt number can appear in a tracker, but stronger local evidence may support a much smaller credible campus. A 600 MW campus is still enormous. But it is not the same as a 7 GW operating project.
Project funnel. Every stage reduces confidence unless supported by evidence. A project becomes real only as it clears site control, permits, interconnection, financing, construction, and energized load.
Map discipline rule: do not let maximum campus ambition become fake operating capacity. That is how a research map turns into visual misinformation.
Backlash Became a First-Order Variable
The backlash is no longer random. It has become a national signal with local nodes.
Gallup’s 71 percent opposition number matters because it shows that data centers are becoming less popular than the industry expected [10]. People do not see them as clean digital infrastructure. They see them as huge facilities that use electricity, consume or stress water systems, produce noise, change local landscapes, and receive tax treatment that ordinary residents do not get.
Public sentiment is not an aesthetic issue. It is a project-conversion variable. A project can have land and capital and still slow down if a local legitimacy problem turns into litigation, referendum pressure, county resistance, state tax scrutiny, or environmental challenge.
Erin Brockovich’s tracker matters because it takes scattered frustration and turns it into an organizing database [31]. That changes the political math. A local complaint becomes part of a national pattern. A noise complaint in one place becomes evidence for a zoning hearing somewhere else. A water-rights fight in Utah becomes a reference point for a county board in Michigan or Ohio.
Prince William matters because it shows that litigation can actually change the path of a project. Stratos matters because it shows that even state-backed and nationally framed AI projects can trigger immediate public anger. Maine matters because the moratorium passed before being vetoed. Ohio matters because tax incentives became politically exposed. Huron County matters because local officials are now choosing pauses so they can write rules before the projects arrive.
Water
Utah, Indiana, and other water-sensitive areas show how water rights, cooling, dewatering, and drainage become infrastructure politics.
Noise
Wisconsin’s Fairwater complaints show that even after a project is built, operational noise can create local resistance.
Tax Incentives
Ohio’s tax-break pause shows that the fiscal bargain is now being questioned, especially when exemption costs explode.
Local Control
Maine, Michigan, Virginia, and Utah show different versions of the same fight: who gets to decide when AI infrastructure lands?
Trust
Once residents feel the deal was already made before they got to speak, the technical facts stop being enough.
Utility Bills
If people believe the project’s grid upgrades will show up in their bills, the fight moves from abstract environment into household economics.
This is the shift: data centers are no longer politically invisible.
Backlash heat layer. The purple ring is the public legitimacy layer. It does not always cancel a project, but it changes cost, timing, routing, scale, and investor confidence.
The Policy Fight: Moratoriums, Taxes, and Who Pays
The policy fight is not just environmental. It is also fiscal.
The public is asking a basic question: if a data center requires large utility upgrades, who pays? If the facility receives tax exemptions, who loses revenue? If the project creates mostly construction jobs and relatively few permanent jobs, is the incentive package justified? If electricity prices rise, are residents subsidizing AI compute?
Ohio’s pause on data center tax breaks is one of the clearest examples. The projected cost of the tax exemption program reportedly jumped from $136 million to nearly $1.6 billion [12]. That turns a development-incentive debate into a budget-pressure debate.
Maine’s moratorium fight is different but related. The legislature tried to pause large projects while the state studied grid and environmental impacts. The governor vetoed it partly because of a specific redevelopment opportunity at a former mill site [13]. That is exactly the conflict: one side sees infrastructure risk, the other sees rural economic reuse.
Utah’s HB 60 shows another layer. The state narrowed what can be considered in water-rights objections, which could help a project like Stratos move through the process [18]. That is a permission-stack adjustment. When public-welfare objections become too powerful, the system can narrow the channel through which objections are heard.
Michigan’s county and township moratoriums show the defensive version. Local officials are not always saying no forever. Often they are saying: slow down, we do not have the rules yet. That is a rational response when a project class appears faster than local code was built to handle [30].
Pattern Nexus point: the backlash is not only against data centers. It is against cost shifting, weak transparency, and the feeling that the public is being asked to absorb the physical burden of private AI infrastructure.
The New Developer and Capital Stack
The updated map also needs to show that the actors are changing. This is no longer just Amazon, Microsoft, Google, Meta, and a few colocation firms.
Hyperscalers still matter because they are the demand base. But the new frontier includes energy developers, private equity, sovereign-linked capital, utilities, retired industrial site owners, nuclear developers, gas infrastructure players, and data center firms that look increasingly like power-campus developers.
SoftBank and AEP at the PORTS campus are a perfect example. This is not simply a data center. It is federal land, Japanese capital, a large gas-power plan, transmission upgrades, and AI framed as national industrial strategy [14][15].
Stratos is another example. It is not selling itself as a normal grid-connected campus. It is selling an off-grid or self-powered AI campus tied to natural gas infrastructure and national AI competition [16][19].
Fermi America’s Project Matador points to the nuclear-adjacent version of the same trend: data centers paired with energy campuses, advanced nuclear review, and the idea that compute demand can justify new generation [28][29].
This is why “data center developer” is no longer the right category by itself. The correct category is infrastructure stack operator. Whoever can combine land, power, capital, customers, and political cover wins the next phase.
Actor Class
Old Role
New AI-Era Role
Hyperscalers
Cloud operators buying or leasing data center capacity.
Strategic load drivers shaping utility planning, generation, and industrial policy.
Utilities
Power providers serving load growth.
Gatekeepers deciding which large loads are credible and who pays for infrastructure.
Energy Developers
Generation and project developers.
Data center enablers because compute demand now requires power strategy.
Infrastructure Funds / PE
Capital providers for real assets.
Power-campus financiers and owners of the AI real asset layer.
Counties and States
Permitting and incentive authorities.
Permission-stack nodes deciding where AI infrastructure can land.
Federal Land / DOE
Background public infrastructure layer.
Strategic siting and national-industrial framing layer.
Capital stack. The AI data center is no longer a simple real estate deal. It is a capital stack, utility stack, energy stack, state-incentive stack, and public-legitimacy stack.
Project Status Map
The map should not treat all projects as one thing. This is the corrected status logic.
Project / Region
Status Layer
What Changed
Why It Matters
Prince William Digital Gateway, Virginia
Blocked / litigation / developer exit
Rezoning was voided over notice issues; Court of Appeals upheld the block; Compass exited while QTS continued appeal path.
Shows that even the strongest data center market can hit a legal and legitimacy wall.
Stratos / Wonder Valley, Utah
Planned / advancing / heavily opposed
Massive AI campus drew water-rights objections, referendum efforts, and public backlash; Utah law narrowed public-welfare objection channels.
Shows how the state can adjust the permission stack when opposition becomes a bottleneck.
PORTS Technology Campus, Ohio
Federal land / strategic AI power campus
DOE, SoftBank/SB Energy, and AEP Ohio moved around a large gas-power and AI data center concept.
Shows the strategic-industrial version of the buildout with federal land and direct power planning.
Ohio statewide data center tax break
Policy pause / fiscal backlash
Governor paused tax break after projected exemption costs jumped sharply.
Shows that the fight is not only local NIMBY politics; it is state budget politics.
Maine statewide moratorium
Passed / vetoed / study path
Legislature passed a moratorium; governor vetoed due to lack of exemption for Jay redevelopment project.
Shows the jobs-versus-grid-risk conflict in rural industrial reuse sites.
Huron County, Michigan
Three-year moratorium
County commissioners approved a three-year pause on data centers and similar projects.
Shows local governments buying time to write rules before the project wave arrives.
Mount Pleasant / Fairwater, Wisconsin
Operating/ramping with noise friction
Microsoft’s data center ramp created community noise complaints and testing.
Shows that operational impacts continue after approval and construction.
Indiana Amazon / Google corridor
Operating/expanding with water and environmental scrutiny
Projects continue but face dewatering, drainage, wetlands, generator, and transparency concerns.
Shows that opposition does not always block a project, but it becomes a cost and legitimacy layer.
National status map. This image should be read as county/state-level project-status logic, not exact parcel data. The important distinction is status: operating, expanding, planned, blocked, or facing friction.
The Human Layer and the Legitimacy Crisis
The human layer is where the AI buildout becomes politically dangerous. The industry can talk about model performance, inference cost, chip supply, and national competitiveness. Residents are talking about bills, water, noise, land, trust, and whether they had any meaningful say.
This creates a legitimacy gap. The benefit story is national or corporate. The burden story is local. The upside is framed as innovation, AI leadership, productivity, and future economic growth. The downside lands as a substation next to a neighborhood, a water-rights application in a dry region, a generator bank near homes, a tax exemption in a state budget, or a zoning fight in a rural county.
That gap is what turns a technical infrastructure project into a political movement. People do not need to understand every detail of load forecasting to understand that something feels off when giant companies receive public incentives while ordinary residents are warned about rising bills and strained resources.
This is the same Pattern Nexus structure that appears across housing, liquidity, energy, and geopolitics. The public is told the system is abstract and inevitable. Then the bill shows up locally. Once that happens, the emotional layer becomes a control variable.
The human layer is not noise in the model. It is now one of the model’s inputs. Public anger changes timelines, litigation risk, cost of capital, project design, and site selection.
How This Plays Out
The next phase will not look like one national stop sign. It will look like uneven sorting.
Some states will speed up. Some counties will slow down. Some projects will move behind federal land, old industrial sites, private power, and state-backed development authorities. Some will get hit by lawsuits, moratoriums, tax scrutiny, or water fights. Some will be redesigned to use less water, add local benefit agreements, or bring their own power. Others will simply disappear once the capital stack realizes the project cannot survive the permission stack.
The most likely path is a bifurcation: strategic campuses survive, weak speculative campuses die, and local communities force the industry to price in legitimacy as a real cost.
Phase
Likely Development
Human / Political Layer
PN Read
2026–2027
Backlash becomes organized and reusable across counties.
More moratoriums, hearings, legal challenges, tax scrutiny, and water objections.
The public learns the playbook.
2027–2028
Utilities and regulators harden large-load credibility rules.
Developers must show site control, deposits, contracts, and power paths earlier.
Speculative pipeline gets cleaned up.
2028–2030
Power-integrated campuses gain advantage over grid-dependent projects.
Private generation, federal land, retired industrial sites, and strategic campuses become more valuable.
The buildout reroutes toward controlled permission environments.
2030+
AI infrastructure becomes normal industrial policy, but with a permanent opposition layer.
The debate shifts from whether data centers should exist to who pays and who gets protected.
The cloud becomes a regulated physical geography.
This is not a simple bullish or bearish story. It is a systems story. AI infrastructure will keep expanding because the upstream demand is enormous. But the expansion will not be smooth. The next map will be drawn by whoever can clear the permission gates.
Updated Graphic Package
This article should not depend on one title image. It needs a visual board inside the body because the thesis is spatial, financial, and systemic.
Graphic A: Status Map — county-level U.S. map showing operating, construction, planned, blocked, downsized, and opposition overlays.Graphic B: Demand Range — 2023 actual estimate, 2028 low/high range, and 2030 scenario share.Graphic C: Project Funnel — announcement to energized load. Each stage filters claimed capacity.Graphic D: Opposition Heat Layer — litigation, moratoriums, tax fights, water fights, noise complaints, and referendum efforts.Graphic E: Power Stack — compute demand to power contract to generation to transmission to public legitimacy.Graphic F: Capital Stack — hyperscaler demand, utility planning, infrastructure funds, energy developers, state incentives, and federal-land strategy.
The Pattern Nexus Synthesis
The deeper story is not that data centers use a lot of electricity. That is just the surface layer.
The deeper story is that AI infrastructure is forcing the physical world to reveal the control stack underneath the digital economy. The industry talks about models, chips, scaling laws, and inference cost. Those are real, but they are not the whole system.
The full AI stack now includes power contracts, substations, transmission, water rights, cooling design, tax policy, zoning, public legitimacy, federal land, national-security framing, and capital-market tolerance.
This is why the backlash will not stop the buildout. The system does not need every project. It needs enough projects in the right locations with the right power stack and the right political cover.
That means the AI map becomes a sorting machine. It sorts states by power abundance. It sorts counties by political tolerance. It sorts developers by execution credibility. It sorts utilities by planning capacity. It sorts investors by patience. It sorts communities by leverage.
The cloud is no longer above the map. The cloud is becoming the map.
Version 3
Technical Advanced Version
The technical update is that AI data centers have moved from a simple demand-growth story into a large-load credibility, power-market design, cost-allocation, and project-realization problem. The issue is not just how many megawatts are announced. The issue is how much claimed capacity survives the filter between press release and energized load.
This matters because the grid has to plan before the load is real. If planners treat speculative requests as real, they can overbuild or shift costs onto ratepayers. If they discount too aggressively, strategic AI capacity bottlenecks. That is why FERC, PJM, utilities, states, and counties are all moving toward some version of the same question: who is real?
Pattern Nexus reads this as a new infrastructure filter: AI compute demand is the upstream pressure, but the downstream permission stack determines where that pressure becomes physical.
The Load-Growth Shock
The technical update begins with the size and timing of the load shock. LBNL estimated U.S. data center electricity use at 176 TWh in 2023, equal to roughly 4.4 percent of total U.S. electricity consumption. Its projected 2028 range of 325–580 TWh puts data centers into a genuinely industrial electricity-demand category [1].
Reuters summarized the same DOE-backed report as showing that U.S. data center power use could nearly triple by 2028, potentially reaching 6.7 percent to 12 percent of U.S. electricity consumption [2]. That is the demand-side shock the original article was pointing at, but the 2026 update needs to stress uncertainty and project-realization risk.
EPRI’s 2026 scenario work adds a wider 2030 envelope, with data centers potentially consuming 9 to 17 percent of U.S. electricity [3]. That does not mean the upper case is guaranteed. It means the planning system now has to handle a range wide enough to change transmission, generation, capacity markets, and retail-rate politics.
The grid problem is not only “more electricity.” It is the combination of size, location, simultaneity, and speed. A single gigawatt-scale campus has the load profile of a major industrial asset. A cluster of them can change regional planning.
Metric
Reported / Scenario Value
Technical Meaning
2023 U.S. data center electricity use
176 TWh
Already a major industrial electricity category, not a marginal load.
2028 LBNL/DOE-backed scenario range
325–580 TWh
Wide enough to alter grid planning even if the high case is not reached.
Implied low-case CAGR, 2023–2028
~13.1% annually
Even the low case compounds faster than normal infrastructure planning cycles.
Implied high-case CAGR, 2023–2028
~26.9% annually
The high case behaves less like normal load growth and more like a new industrial shock.
2030 EPRI scenario share
9–17% of U.S. electricity use
Signals that data centers could become a central driver of power-market structure.
Public opposition
71% oppose local AI data centers in Gallup polling
The physical buildout now faces a legitimacy bottleneck.
Demand range chart. LBNL gives the 2023 baseline and 2028 range. EPRI gives the broader 2030 electricity-share scenario. The right read is not one number. It is the range and the speed.
Forecast Uncertainty and Queue Pollution
The next layer is forecast reliability. Utilities and grid operators need to plan ahead, but they are receiving a wave of large-load requests where some projects are real, some are optional, and some are inflated.
That creates queue pollution. If every announced data center is treated as real, the grid may overbuild or misallocate infrastructure costs. If utilities discount too aggressively, real projects may face shortages, and strategic compute capacity may bottleneck.
The correct technical distinction is:
Nominal IT capacity: what the data center could support on paper.
Contracted load: what a customer has actually committed to purchase or reserve.
Interconnection-backed load: what has reached credible grid-process milestones.
Peak operating load: what the facility can draw at maximum operation.
Average annual energy use: what actually appears in consumption data over time.
Collapsing those into one number creates bad maps and bad policy. The article has to be explicit that announced megawatts are not the same as delivered load.
Project realization funnel. This is the technical heart of the article: claimed gigawatts must pass through evidence gates before becoming real load.
Regression-Style Model: What Converts Announced Capacity Into Real Load?
A clean way to model the next phase is not to treat announced gigawatts as load. Treat them as raw pipeline subject to conversion factors.
The Pattern Nexus conversion model looks like this:
This is not pretending to be a finished econometric model with perfect coefficients. It is a regression-style framework for explaining what the market and grid planners are already being forced to do. Every variable cuts a different way.
Variable
Positive Signal
Negative Signal
What It Predicts
Site-Control Weight
Land purchased or controlled; local development agreement exists.
That is why some communities explode while others absorb projects. A rural industrial reuse site with strong local job pressure and a clear utility plan is not the same as a giant new campus that appears next to residents with unclear water impacts, limited permanent jobs, and a tax exemption. The model does not need people to be irrational. It assumes people react to visible cost, unclear benefit, and weak trust.
FERC/PJM: Large-Load Filtering Becomes Policy
FERC and PJM are now moving toward the institutional version of the Pattern Nexus filter.
FERC Chair David Rosner’s large-load forecasting letter points directly at objective milestones: contracts, financial security deposits, site control, and other evidence that a load request is real [7]. This is the regulatory system trying to separate executable demand from speculative demand.
PJM’s large-load work points in the same direction. The market needs mechanisms for large loads that bring their own generation, accept curtailment, use limited transmission service, or co-locate with generation [8][9]. This is not a minor tariff adjustment. It is the beginning of a new market architecture for AI-era industrial demand.
The technical conflict is reliability versus acceleration. AI developers want speed. Grid operators need reliability. Regulators need cost allocation. Existing customers need protection from cross-subsidies. The system is therefore building a gatekeeping layer around large loads.
Technical thesis: the AI data center boom is forcing large-load credibility tests into power-market design.
Project Inventory and Status Logic
The updated project table should be used as a map-control layer, not just as article decoration. Each entry should carry a status, capacity type, and location-precision label.
Project / Area
Developer / Capital Stack
Location Precision
Capacity / Claim
Status as of May 30, 2026
Map Treatment
IREN Childress
IREN
Childress, Texas
Large operating/expanding power-backed campus
Operating anchor with expansion activity
Green marker plus blue expansion halo
Riot Rockdale
Riot Platforms
Milam County, Texas
Large operating power campus
Operating; conversion/tenant strategy relevant to AI/HPC transition
Green marker
AWS New Carlisle
Amazon
St. Joseph County, Indiana
Major phased data center campus
Operating/expanding; dewatering and drainage controversy
Green/blue marker with opposition ring
Microsoft Fairwater
Microsoft
Mount Pleasant / Racine County, Wisconsin
Large AI data center campus
Startup/ramp; noise complaints became community issue
Blue/green marker with noise-friction icon
Project Zodiac
Google
Allen County / Fort Wayne, Indiana
Major phased project
Operating or ramping in phase; later phases draw environmental scrutiny
Green/blue marker with permitting note
Prince William Digital Gateway
QTS / Compass originally
Prince William County, Virginia
Up to 37 data centers in disputed corridor
Rezoning voided; Court of Appeals upheld; Compass exited; QTS continued appeal path
Red marker with litigation/opposition overlay
Stratos / Wonder Valley
O’Leary Digital / WestGen / MIDA structure
Box Elder County, Utah
Up to 9 GW claimed full buildout
Approved/advancing; water-rights fight, referendum attempt, major public backlash
Gold marker with purple opposition ring and water icon
PORTS Technology Campus
DOE / SoftBank SB Energy / AEP Ohio
Pike County, Ohio
10 GW data center concept with 9.2 GW gas-power plan
Federal-land strategic AI campus model; transmission upgrade package
Gold marker with federal/energy-campus icon
Fermi Project Matador
Fermi America
Carson County, Texas
Multi-GW energy/AI campus claims
Advancing as power-compute campus; nuclear review pathway relevant
Gold/blue with nuclear/power icon
Nexus Hubbard
Nexus Data Centers
Hill County, Texas
Large claims need scale verification
Use caution: stronger evidence supports a much smaller credible campus than some tracker-scale claims
Yellow/red caution marker, not full claimed GW marker
Status map. County/state-level accuracy is the correct standard where parcel-level data is not verified. The visual logic should separate operating, expanding, announced, blocked, and opposed projects.
Opposition as a Realization-Rate Haircut
In technical terms, public opposition should be modeled as a realization-rate haircut on the planned project pipeline.
It does not reduce demand one-for-one. It reduces the probability that certain announced projects convert into operating load at the claimed capacity, in the claimed location, on the claimed timeline.
Cost risk: mitigation, legal work, community benefits, power redesign, and tax changes raise project costs.
Scale risk: full-buildout claims may be reduced, phased, or made contingent on further approval.
Location risk: developers move from politically hostile zones to more favorable industrial corridors.
This is why the article should not say backlash is irrelevant. It is relevant to project conversion. It is just not strong enough to erase the upstream compute demand.
Backlash overlay. Opposition is a risk layer, not a binary. It changes conversion rate, timeline, financing, scale, and route.
Energy Mix: Gas, Nuclear, Renewables, Storage, and Private Power
The energy strategy is also changing. Hyperscalers still sign renewable PPAs, but the speed and scale of AI load is pushing the market toward a broader stack: gas turbines, co-located power, nuclear deals, geothermal, solar-plus-storage, batteries, demand response, and private-wire models.
The DOE/SoftBank/AEP Ohio project is important because it uses federal land and a huge gas-power package to solve the power bottleneck directly [14][15]. Stratos is important because it leans into on-site gas-backed generation and off-grid framing [16][19]. Fermi is important because it shows how AI demand is being used to justify nuclear-adjacent campus planning [28][29].
This does not mean all these models are equally clean, cheap, or politically stable. It means the power strategy is becoming part of the data center product. A developer that cannot explain its power path is now weaker than a developer that can.
The next market distinction will be between grid-dependent data centers and power-integrated data centers. Grid-dependent projects wait for utility capacity. Power-integrated projects try to bring generation, storage, or curtailment structures with them.
Gas-backed campuses
Fastest dispatchable path in many places, but politically exposed on emissions and fuel-price risk.
Nuclear-adjacent campuses
Strategically attractive, slower, regulatory-heavy, but powerful as a long-duration compute narrative.
Renewables + storage
Useful for procurement and emissions targets, but not always enough for firm 24/7 AI load without backup.
Curtailable load
Turns data centers into grid participants, but raises questions about uptime, contracts, and who gets interrupted first.
Industrial reuse
Former mill, coal, uranium, or manufacturing sites may become more valuable because the permission stack is partly pre-built.
Private-wire / behind-the-meter
Developers will keep looking for ways around grid queues, but regulators will still ask reliability and cost-allocation questions.
Ratepayer Politics and Cost Allocation
Cost allocation is where this becomes politically explosive.
If new transmission, substations, capacity-market costs, and reliability upgrades are socialized across ordinary customers, then the public is effectively underwriting AI infrastructure. That becomes a political problem as soon as bills rise.
This is why FERC/PJM’s credibility filtering matters. It is also why the Ohio tax-incentive pause matters. Public officials are starting to ask whether the data center bargain is still balanced when power costs, tax exemptions, and infrastructure upgrades are included [7][12].
The industry’s answer is usually jobs, tax base, and strategic competitiveness. The public’s answer is increasingly bills, water, noise, land use, and local control.
The project survives where those two stories can be reconciled. It fails where the gap becomes too obvious.
Ratepayer lens: the public does not only care whether AI is useful. It cares whether the physical cost of AI is being pushed into ordinary bills while the upside is captured privately.
Map Overlay Standards
The updated graphics must be source-disciplined. The article should not use fake precision.
Overlay
What It Should Show
Accuracy Rule
Capacity status
Operating, under construction, planned, blocked, downsized.
Use different symbols; never mix operating MW with claimed future GW.
Policy friction
Moratoriums, vetoes, tax pauses, state incentive fights.
Show at state/county level unless tied to a specific site.
Community opposition
Lawsuits, referenda, public comment surges, protests, noise complaints.
Show as opposition ring, not cancellation unless project is actually blocked/canceled.
Label claimed strategy separately from built infrastructure.
Power stack. This image belongs in the technical version because it shows the real sequential dependencies: compute does not become usable until the physical layers clear.
The 2026–2030 Projection
The projected path is not a straight line. It is a branching system.
By 2028, the low-end LBNL case already implies major additional demand. The high-end case implies an aggressive industrial load shock. By 2030, EPRI’s 9 to 17 percent scenario range forces the power sector to treat data centers as a structural planning variable, not a niche customer class [1][3].
The most likely outcome is not that every announced campus gets built. The most likely outcome is a pipeline haircut. The national compute demand remains strong, but the project list gets sorted by site control, power path, water/cooling, financing, utility credibility, and political survival.
Scenario
What Happens
Winners
Losers
Clean execution scenario
Utilities, regulators, and developers build credibility filters fast enough to separate real load from speculative load.
Local opposition spreads faster than the industry can build trust.
Projects with strong public-benefit agreements and clear cost protection.
Opaque projects with weak community legitimacy.
Grid bottleneck scenario
Interconnection and transmission constraints become the dominant filter.
Sites with on-site generation, curtailment options, or existing power infrastructure.
Grid-dependent projects in constrained regions.
Ratepayer revolt scenario
Bill impacts and tax breaks become the political center of the fight.
Projects that isolate costs or bring credible revenue.
Projects perceived as privatizing upside and socializing cost.
Strategic acceleration scenario
Federal/state governments elevate AI infrastructure as national-security industrial policy.
Federal land, power campuses, nuclear/gas-backed projects.
Local veto power where state/federal override increases.
The PN projection is that all five scenarios happen at once in different places. That is why the map matters. This is not one national story. It is a distributed systems story.
The Technical PN Model
The deeper model is that AI data centers are revealing the hidden control stack beneath the modern digital economy.
The industry talks about models, chips, scaling laws, and inference cost. Those are real, but they are not the whole system. The full AI stack now includes power contracts, substations, transmission, water rights, cooling design, tax policy, zoning, public legitimacy, federal land, national-security framing, and capital-market tolerance.
This is why the backlash will not stop the buildout. The system does not need every project. It needs enough projects in the right locations with the right power stack and the right political cover.
That means the AI map becomes a sorting machine. It sorts states by power abundance. It sorts counties by political tolerance. It sorts developers by execution credibility. It sorts utilities by planning capacity. It sorts investors by patience. It sorts communities by leverage.
The cloud is no longer above the map. The cloud is becoming the map.
This article uses the original Pattern Nexus data center thesis as the source spine, then updates it through May 30, 2026 using federal reports, power-sector research, utility and regulatory materials, public-opinion data, project-specific documentation, local opposition examples, and recent reporting. Claims are separated into three layers: documented evidence, project-status uncertainty, and Pattern Nexus synthesis. Documented evidence includes electricity demand reports, regulatory materials, project websites, public documents, local reporting, and national news coverage. Project-status uncertainty is kept visible where capacity claims are promotional, phased, county-level, or not yet supported by energized load. Pattern Nexus synthesis then maps the relationship between these categories without pretending every announced gigawatt is real or every local objection stops the national buildout.
Pattern Nexus Note: The world is not divided into topics. It is divided into layers. AI data centers are not just tech, real estate, energy, water, law, finance, or local politics. They are all of those at once. The public is not wrong to be angry. They are seeing the physical costs of a digital system that was sold as invisible. But anger alone does not reverse a strategic infrastructure buildout. It changes the route. It changes the winners. It changes the cost stack. The AI economy is now searching for the counties, utilities, power assets, and political permission structures that can absorb it. That is the map.
Frequently Asked Questions
The original thesis was that AI data centers were reorganizing America’s power map. The May 2026 update is that the buildout has now entered the permission layer. Data centers are running into public opposition, grid constraints, water concerns, court challenges, tax incentive backlash, and large-load forecasting problems. The story is no longer just “AI needs electricity.” It is now about which projects can actually secure power, permits, land, water, and political legitimacy.
Public backlash matters because data centers are physical infrastructure. They need local approvals, zoning, drainage permissions, utility upgrades, construction permits, air permits, and political acceptance. Communities can delay or stop individual projects, especially projects that are speculative, poorly explained, environmentally exposed, or politically vulnerable.
Backlash will stop some projects, but it will not erase national compute demand. AI companies still need massive amounts of compute, and compute needs power. The likely outcome is rerouting. Projects will move toward counties, states, retired industrial sites, power plant corridors, private generation models, and utility territories that can absorb the buildout with less political friction.
The biggest mistake is treating every announced project as if it is already real operating capacity. A planned gigawatt campus is not the same thing as an energized data center. The updated map needs to separate operating, under construction, planned, permitted, blocked, downsized, and opposition-affected projects.
Many project sources only verify city, county, or state-level location, not exact parcel coordinates. Dropping an exact-looking map pin on a city center or approximate site creates false precision. If the exact site is not verified, the map should use a county-level marker or clearly labeled approximate geography.
The permission stack is the chain of requirements that allows AI infrastructure to exist physically. Compute needs data centers. Data centers need power. Power needs generation, transmission, and interconnection. Projects also need land, water, permits, tax agreements, zoning, political cover, and public legitimacy. The bottleneck is no longer just chips or models. It is the full physical and political stack underneath AI.
Northern Virginia still matters, but it is now politically constrained. Texas is becoming central because of power-market structure, land, gas, and large-load growth. Indiana, Ohio, Wisconsin, Utah, New Mexico, West Virginia, Arizona, and other interior states matter because developers are searching for power access, industrial land, lower friction, and state-level support.
AI infrastructure is becoming a new industrial control layer. The public backlash is real, but it functions more like a filter than a wall. It kills weak projects, delays exposed projects, raises costs, and reroutes development toward stronger power and permission nodes. The buildout continues because the upstream incentive is stronger than the downstream resistance.
Founder of Pattern Nexus. I research markets, macro, geopolitics, AI, history, ancient systems, and the patterns most people overlook. I’m also building Market Radar, a trading scanner designed to read pressure, risk, confirmation, and setup quality before chasing a move.
Pattern Nexus is where I connect the dots between data, history, technology, and the bigger system playing out around us.
If Pattern Nexus has been useful to you, help keep it growing.
Pattern Nexus is independently built and operated.
Most of the research remains publicly available,
but the data, servers, tools, research and time behind it all
have real costs.
Books, memberships and direct support help fund the next stage
without putting everything behind a paywall.

 Mi piace
0
Mi piace
0
 Non mi piace
0
Non mi piace
0
 Amore
0
Amore
0
 Divertente
0
Divertente
0
 Wow
0
Wow
0
 Triste
0
Triste
0
 Arrabbiato
0
Arrabbiato
0



Commenti (0)