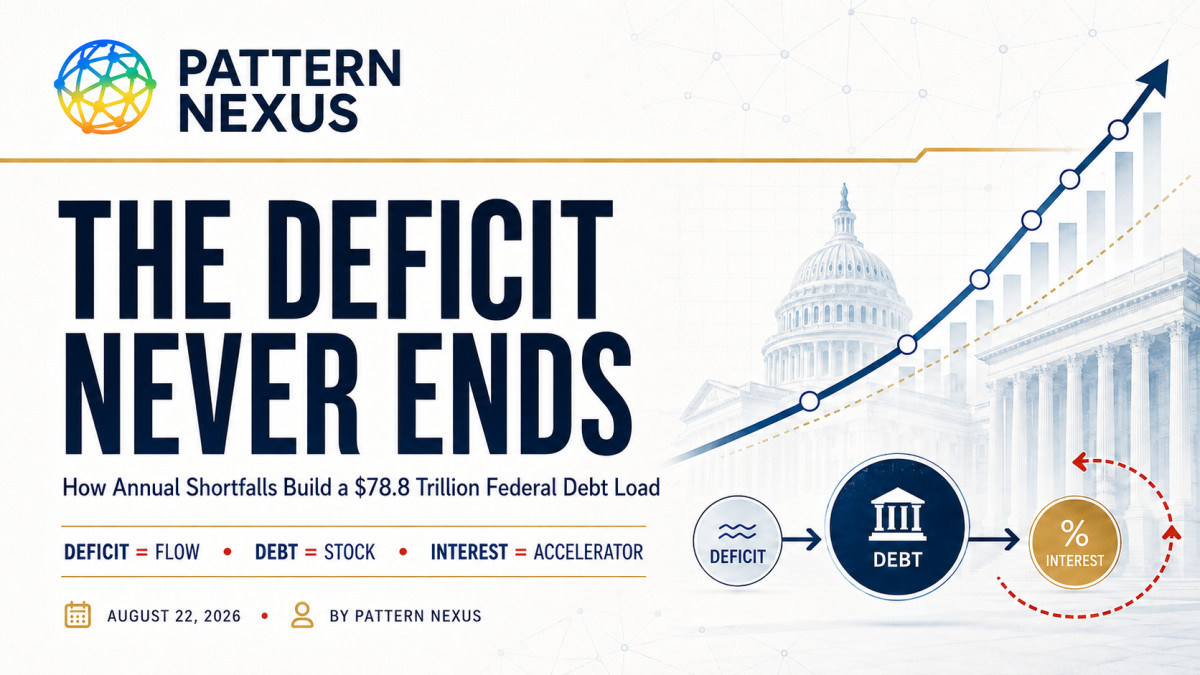
The Deficit Never Ends: How Annual Shortfalls Build a $78.8 Trillion Federal Debt Load
Most people use “deficit” and “debt” as if they mean the same thing. They do not. This report uses two Pattern Nexus infographics and official CBO and Treasury data to map the annual federal deficit and total federal debt from 2020 through 2040, explain why interest creates a self-reinforcing feedback loop, and show why the 10-year and 30-year Treasury yields—not a political debt-clock slogan—are the market constraint that matters.
 Pattern Nexus Premium Research
The Deficit Never Ends: How Annual Shortfalls Build a $78.8 Trillion Federal Debt Load
Most people argue about the national debt without understanding the accounting. The deficit is the hole created this year. The debt is the accumulated stock of financed holes still outstanding. Under the current-law baseline, trillion-dollar shortfalls persist through 2040, gross federal debt nearly triples from its 2020 level, and interest becomes the accelerator.
The deficit is the flow. The debt is the stock. Interest connects them.
- Use the right words. This is the federal budget deficit, not a “Fed deficit.” The Federal Reserve does not write the federal budget; Congress and the executive branch determine taxes and spending.
- The annual deficit never disappears in the baseline. It falls from the pandemic peak of $3.13 trillion in 2020 to $1.38 trillion in 2022, then rises again. CBO’s updated estimate is about $2.1 trillion for fiscal 2026, and the long-term path implies roughly $3.76 trillion in 2040.[4][5][7]
- Total federal debt compounds. Treasury’s fiscal-year-end total debt rose from $26.95 trillion in 2020 to $37.64 trillion in 2025 and crossed $40 trillion in August 2026. The CBO-based gross-debt path reaches approximately $78.8 trillion in 2040.[9][10]
- The 2040 figure is not just a bigger nominal number. It equals about 145.5% of projected GDP on the gross-debt measure, so the denominator does not grow fast enough to stabilize the ratio under current law.[5][6]
- Interest is the structural accelerator. CBO’s February baseline put net federal interest outlays at $1.039 trillion in 2026 and $2.144 trillion in 2036, rising from 3.3% to 4.6% of GDP. Through the first ten months of fiscal 2026, net interest was already up $117 billion, or 14%, from the comparable prior-year period.[4][7]
- The baseline is already moving. CBO’s full-year 2026 deficit estimate increased by roughly $200 billion between February and July, from a rounded $1.9 trillion to $2.1 trillion. A baseline is a current-law benchmark, not a promise.[7]
- There is no magic bankruptcy date in these charts. The United States issues debt in a currency it creates. The practical constraint appears through interest cost, inflation expectations, auction demand, term premium, currency confidence, crowding out and the political pressure to force yields lower.
- The long end is the referee. The Fed controls the overnight policy rate. It does not automatically control the 10-year or 30-year Treasury yield. Persistent issuance can keep long rates high even during an easing cycle.[1][2][3]
Do not call this a “Fed deficit.” The Federal Reserve is the central bank. The federal deficit is the annual gap between federal outlays and revenues. Treasury finances that gap by issuing debt. Those are connected institutions, but they are not the same balance sheet and not the same decision process.
The pandemic spike is not the main story. The failure to return to balance is.
People keep using deficit and debt as if they are two names for the same number. They are not. That confusion hides the mechanism.
The deficit is an annual flow. If the government collects $5 trillion and spends $7 trillion, that year produces a $2 trillion deficit. Treasury finances the gap. The debt is the accumulated stock of obligations left after years of financing those gaps, plus other financing adjustments. A $2 trillion deficit does not mean the debt is $2 trillion. It means an already enormous debt stock generally has to absorb roughly another $2 trillion of net borrowing pressure.
Then the second-order effect begins. Every new Treasury security carries an interest cost. As older low-coupon debt matures and is refinanced, the average rate paid on the whole stock can rise. Interest outlays widen the next deficit. That larger deficit requires more debt. The debt creates more interest. The loop is not mysterious; it is arithmetic.
The fiscal ratchet: primary deficit + net interest = total deficit; total deficit + financing adjustments = additional debt; additional debt × the future effective interest rate = more future interest.
The 2020 deficit was an emergency number. The important fact is what happened after the emergency spending faded: the deficit fell, but it did not approach zero. It settled back into a structural range measured in trillions. Under CBO’s current-law path, it then starts climbing again through the 2030s.
That is why the 2040 debt figure matters. Gross federal debt rises from $26.95 trillion in 2020 to approximately $78.8 trillion in the combined Treasury/CBO path—an increase of roughly $51.9 trillion, or 192%. The stock nearly triples in two decades even though the economy keeps growing.
This does not tell us the exact date of a crisis. It tells us where the pressure must show up: taxes, spending, inflation, long-term yields, financial repression, central-bank support, reduced fiscal flexibility, or some combination of all six.
Four numbers people keep mixing together
You cannot understand the fiscal path until the vocabulary is clean. The public debate routinely jumps between annual deficits, debt held by the public, gross debt and the Federal Reserve’s balance sheet. Those measures answer different questions.
| Measure | Flow or stock? | What it means | Why it matters |
|---|---|---|---|
| Federal budget deficit | Annual flow | Outlays minus revenues during one fiscal year. | Approximates the new financing gap created that year. |
| Debt held by the public | Accumulated stock | Treasury debt held outside federal government accounts, including investors, banks, funds, the Federal Reserve and foreign holders. | Best measure of the market-facing federal claim on private and foreign balance sheets. |
| Gross federal debt / total public debt outstanding | Accumulated stock | Debt held by the public plus intragovernmental holdings such as federal trust-fund accounts. | This is the broad total-debt concept used in the second infographic. |
| Federal Reserve balance sheet | Central-bank stock | Assets and liabilities of the central bank, including Treasury securities, reserves and currency. | It can change the holder and duration structure of federal debt; it does not erase Treasury’s obligation. |
CBO usually emphasizes debt held by the public because it is the cleaner measure of federal borrowing that must be absorbed outside intragovernmental accounts. This report uses gross or total debt because that is the question the chart is answering. For context, CBO’s February baseline projected debt held by the public at $56.15 trillion, or 120.2% of GDP, in 2036, while gross debt was $63.69 trillion.[4]
The federal deficit path, 2020–2040
The first chart shows the annual flow. The 2020 and 2021 deficits were dominated by pandemic-era emergency policy. The deficit then dropped sharply in 2022 as temporary programs expired and revenues rebounded. If the fiscal problem were merely the pandemic, the line would have continued moving toward balance.
It did not.
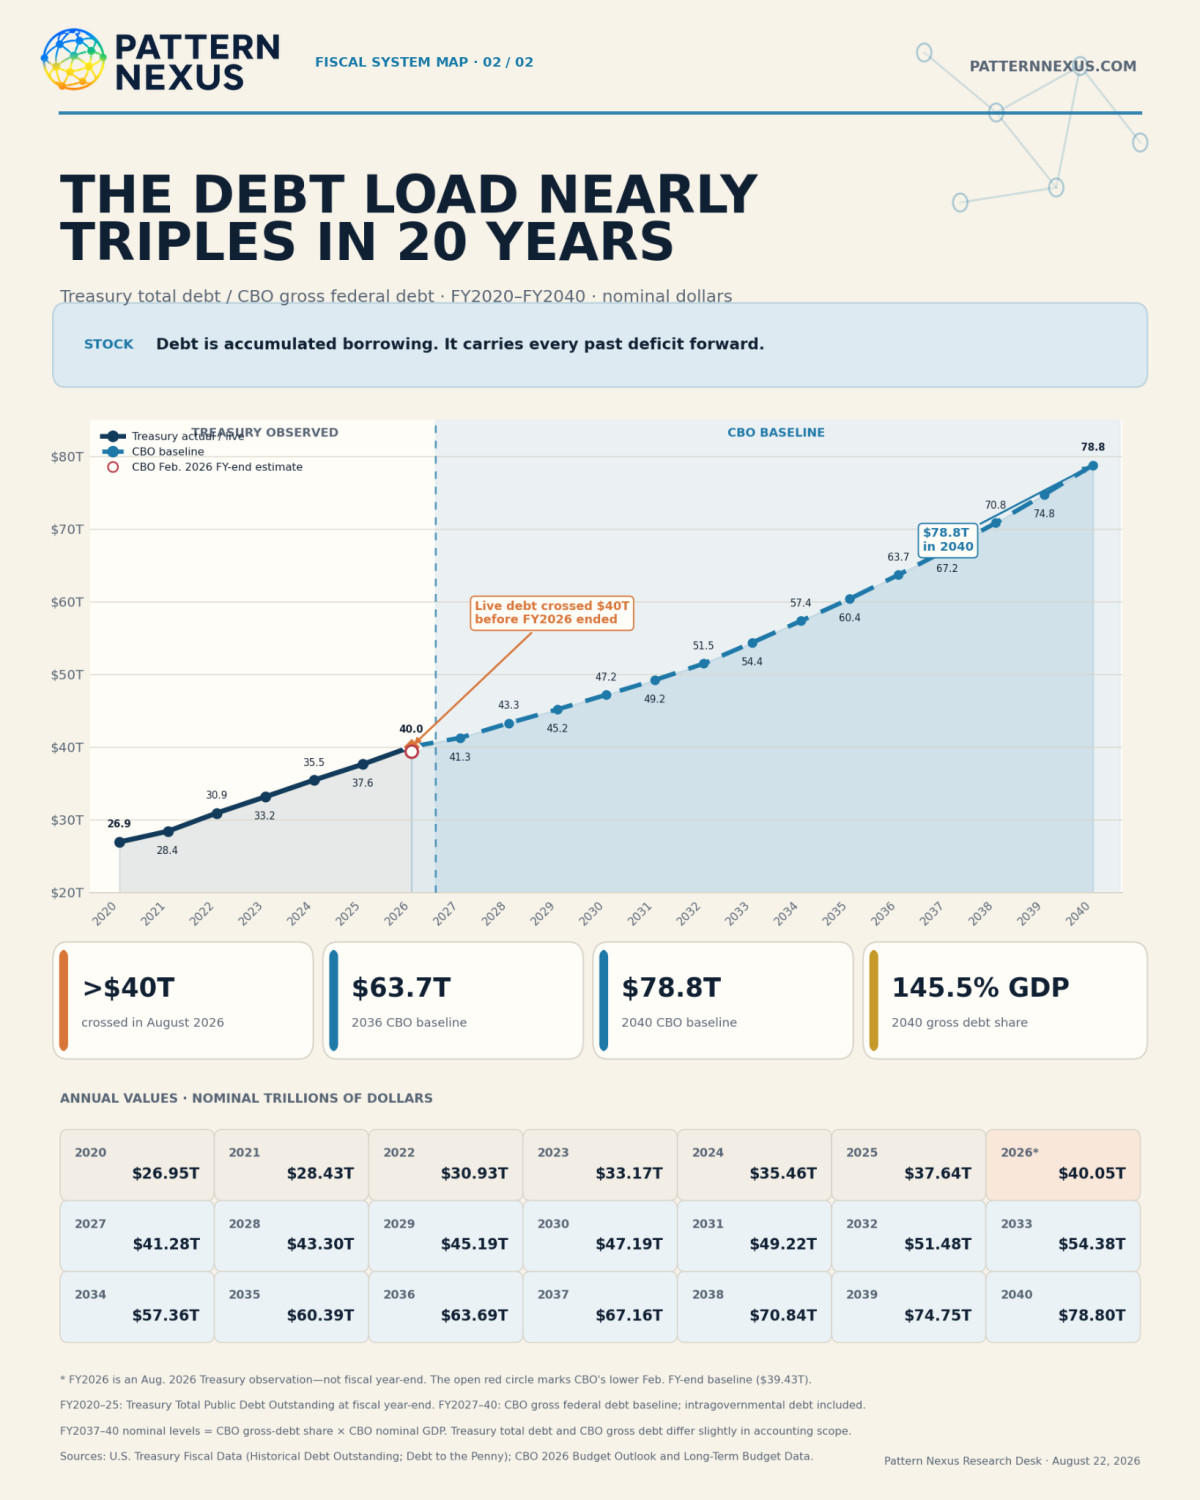
The annual shortfall rises from $1.38 trillion in 2022 to $1.69 trillion in 2023, $1.83 trillion in 2024 and $1.78 trillion in 2025. CBO’s February 2026 baseline expected another deficit near $1.9 trillion in 2026. By July, CBO had lifted the full-year estimate to $2.1 trillion.[4][7]
From there, the baseline does not show a return to balance. It shows a persistent structural deficit that climbs from roughly $1.89 trillion in 2027 to $2.20 trillion in 2030, $2.96 trillion in 2035 and an implied $3.76 trillion in 2040.
| Fiscal year | Annual deficit | Status | What it shows |
|---|---|---|---|
| 2020 | $3.132T | Actual | Pandemic emergency peak. |
| 2022 | $1.376T | Actual | Temporary relief as emergency programs faded. |
| 2025 | $1.775T | Actual | The deficit remained enormous outside an acute recession. |
| 2026 | About $2.1T | Updated CBO estimate | Already roughly $200B above the rounded February estimate. |
| 2030 | $2.201T | CBO baseline | Two-trillion-dollar deficits become routine, not emergency policy. |
| 2035 | $2.957T | CBO baseline | The deficit approaches the old pandemic peak without a pandemic. |
| 2040 | About $3.760T | PN calculation from CBO series | A 6.941%-of-GDP deficit under the long-term current-law path. |
The percentage of GDP matters. CBO’s long-term series puts the 2040 deficit at 6.941% of GDP. The 50-year historical average is approximately 3.8%. In other words, the projected deficit share in 2040 is about 83% larger than the long-run average even after accounting for a much larger economy.[5][6]
The line therefore describes a regime change: trillion-dollar deficits are no longer reserved for wars, recessions or once-in-a-century emergencies. They are embedded in the ordinary path of current law.
The total federal debt path, 2020–2040
The second chart shows the stock created by repeated deficits and other financing adjustments. Treasury’s fiscal-year-end total public debt outstanding increased every year from $26.95 trillion in 2020 to $37.64 trillion in 2025. The daily Treasury series crossed $40 trillion in August 2026.[9][10]
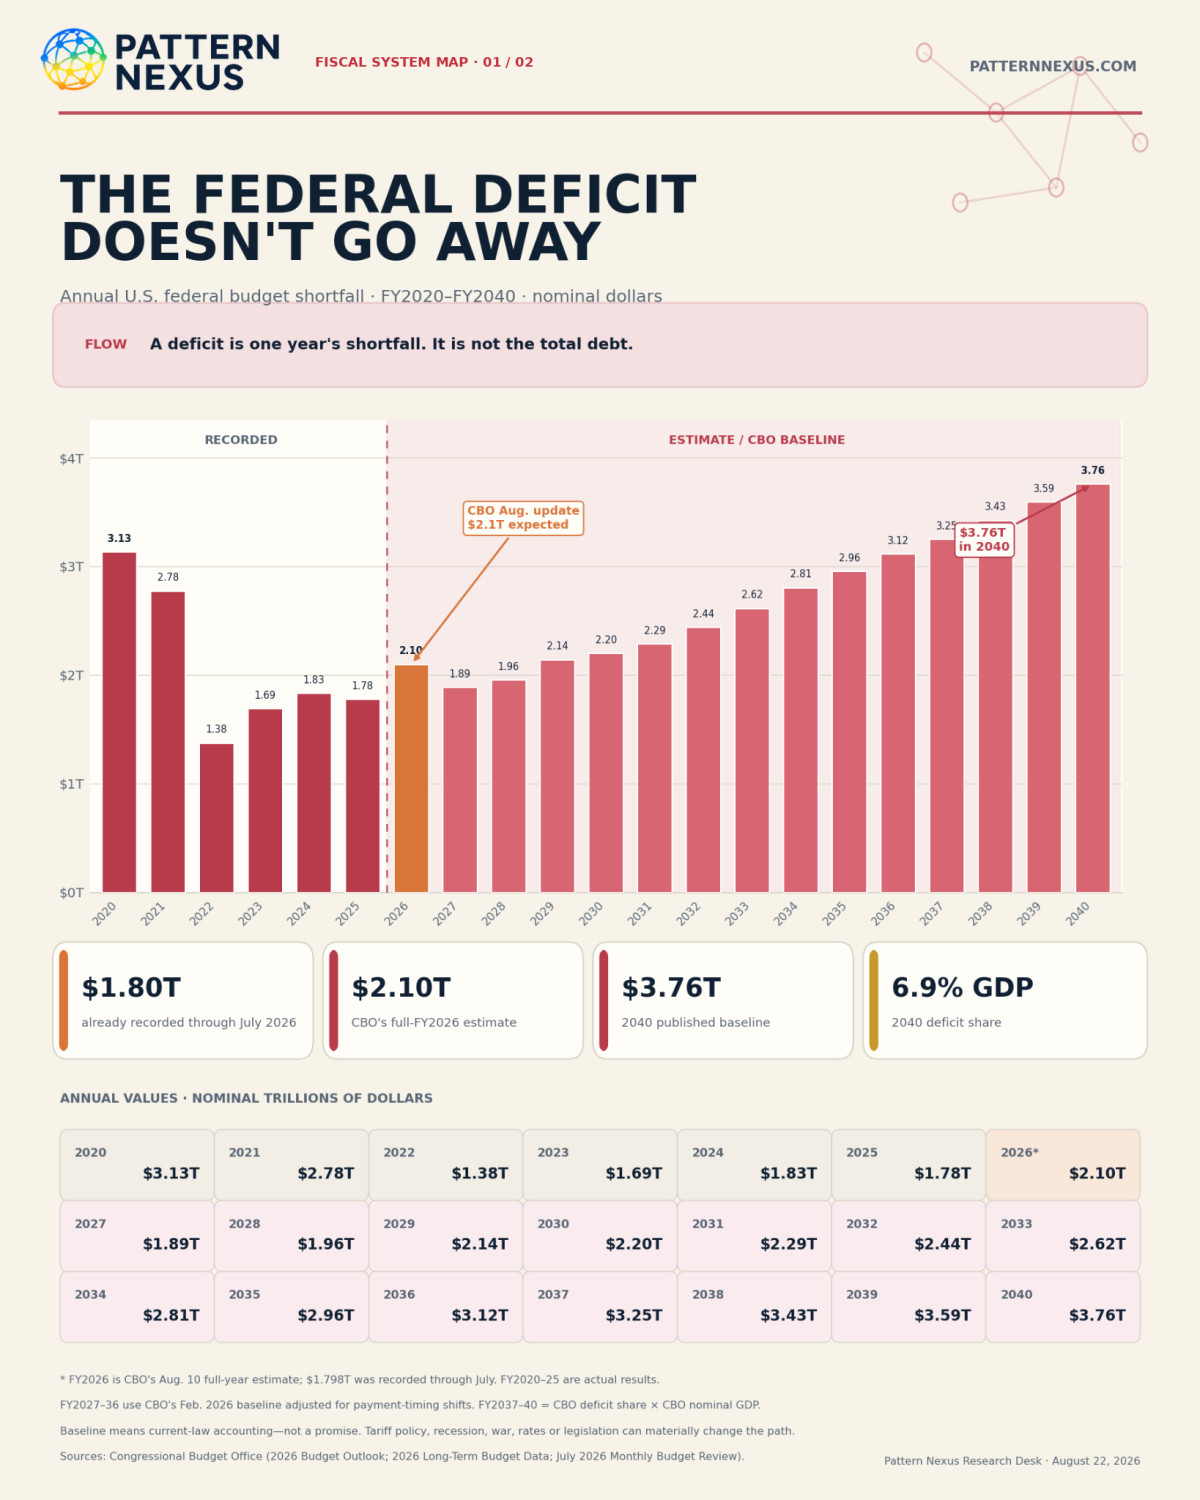
The source handoff matters. Treasury publishes the historical and daily debt totals. CBO publishes the forward gross-debt baseline. The two concepts are close, but not perfectly identical in timing and accounting treatment. That is why the chart labels the actual, observed and projected segments rather than pretending the entire line came from one table.
| Date / fiscal year | Total / gross federal debt | Status | Source / method |
|---|---|---|---|
| FY2020 | $26.945T | Actual | Treasury Historical Debt Outstanding. |
| FY2025 | $37.638T | Actual | Treasury Historical Debt Outstanding. |
| August 2026 | About $40.05T | Daily observation | Treasury Debt to the Penny; not a fiscal-year-end value. |
| FY2027 | $41.279T | CBO baseline | Gross federal debt. |
| FY2030 | $47.192T | CBO baseline | Gross federal debt. |
| FY2035 | $60.386T | CBO baseline | Gross federal debt. |
| FY2040 | About $78.801T | PN calculation from CBO series | 145.477% of projected nominal GDP. |
From the 2020 fiscal-year-end level to the 2040 long-term baseline, gross debt rises by approximately $51.86 trillion. That is a 192.4% increase, taking the stock to about 2.92 times its 2020 size.
The daily 2026 observation also offers a warning about false precision. CBO’s February baseline showed $39.43 trillion of gross debt for fiscal 2026, while Treasury’s daily total-debt measure had already crossed $40 trillion before fiscal year-end. Because the measures and dates are not identical, this is not a clean one-for-one forecast-error calculation. It is evidence that the path can move faster than a published baseline.
Why debt growth does not equal the charted deficits exactly
If every deficit is financed, why does the debt line not equal the starting debt plus the exact sum of the annual deficit bars?
Because the unified federal deficit and the change in gross debt are related, but they are not identical accounting series. Across the displayed 2020–2040 path, the annual deficits sum to roughly $53.1 trillion, while gross debt rises by about $51.9 trillion. The difference is not evidence that money vanished. It reflects the way the two charts were constructed and the fact that federal financing contains more than one moving piece.
- Timing: the deficit is measured over a fiscal year, while the debt is measured at particular dates. The August 2026 point is explicitly not a fiscal-year-end observation.
- Source handoff: historical debt comes from Treasury; projected gross debt comes from CBO; 2037–2040 nominal values are calculated from CBO shares and GDP.
- Intragovernmental accounts: gross debt includes federal trust-fund holdings, whose changes do not map one-for-one to the unified deficit.
- Other means of financing: changes in Treasury’s cash balance, federal credit activity and other financing transactions can make borrowing needs differ from the reported deficit in a given period.
- Rounding and forecast revisions: the infographic mixes exact historical values, a current 2026 estimate and a baseline that was published earlier in the year.
The right mental model: deficits are the dominant recurring flow feeding the debt stock. Do not demand that two hybrid public datasets reconcile to the dollar before recognizing the mechanism.
Interest turns a large debt stock into a self-reinforcing deficit problem
The first-order debate is about taxes and program spending. The second-order problem is the carrying cost of everything already borrowed.
CBO’s February baseline projected net interest outlays of $1.039 trillion in 2026 and $2.144 trillion in 2036. As a share of the economy, net interest rises from 3.3% to 4.6% of GDP over that decade.[4]
The current-year data are already moving in that direction. During the first ten months of fiscal 2026, net interest outlays were $117 billion higher than in the comparable period of 2025—a 14% increase. Medicare rose 8%, Social Security 5%, Medicaid 8% and military spending 5% over the same comparison, but interest was the fastest-growing large line among those categories.[7]
The mechanism has a lag. Treasury does not refinance the entire debt stock every morning. Bills reset quickly. Notes and bonds roll over over years. That means the effective interest rate paid by the government changes more slowly than the Fed’s overnight target. It also means several years of high long-term rates can keep pushing average financing costs upward even after the Fed begins cutting short rates.
Debt-service loop: a larger stock increases interest sensitivity; refinancing at higher yields raises interest outlays; higher interest widens the deficit; the wider deficit requires more issuance; more issuance adds to the stock.
This is the part of the fiscal story that changes the politics. Once interest consumes a larger share of revenue, every budget choice becomes more adversarial. Lawmakers are no longer deciding only how to divide current tax receipts. They are also paying for yesterday’s decisions at today’s rates.
Why the 10-year and 30-year matter more than the political talking point
The United States does not need to find a finite pile of dollars before it can spend. It issues liabilities in its own currency and operates through the deepest sovereign debt market in the world. That monetary flexibility is real. So is the constraint.
The constraint is the price at which the rest of the system will hold duration.
The Federal Reserve can set the overnight policy rate. The 10-year and 30-year Treasury yields are shaped by expected short rates, inflation, real growth, supply, global demand, risk appetite and term premium. When the government runs large structural deficits, Treasury must keep placing securities into the market. If buyers demand more compensation for inflation risk, duration risk or fiscal uncertainty, long yields can remain high even while the Fed cuts.[1][2]
That is the long-end trap Pattern Nexus has been tracking. A lower federal-funds rate does not guarantee cheaper mortgages, corporate financing or long-term government borrowing. If the 10-year and 30-year stay elevated, the long end continues tightening the economy while the fiscal system continues issuing into it.
The 30-year adds another layer. It is where fiscal supply meets the willingness of investors to lock up capital through inflation cycles, wars, political transitions and changes in the global dollar system. It is not a perfect referendum on U.S. solvency. It is a live price for long-duration confidence.[3]
If private demand is insufficient at the desired yield, only a few things can happen:
- yields rise until buyers appear;
- Treasury changes the maturity mix or uses debt-management tools;
- regulated balance sheets absorb more sovereign collateral;
- new dollar rails, including stablecoins and money funds, create incremental demand for short Treasury assets;
- or the central bank eventually absorbs duration through balance-sheet expansion or an explicit yield-control regime.
None of those outcomes makes the debt disappear. They determine who holds it, at what maturity, at what yield, and with what inflation or financial-stability consequences.
Why the baseline will move—and why that does not make it useless
A CBO baseline is not a prediction that Congress will behave exactly as modeled. It is a current-law benchmark built from stated assumptions. Its value is not that it tells us the precise debt on a day in 2040. Its value is that it shows the direction and scale of the fiscal path before future legislation, recessions, wars, rate shocks or policy interventions change it.
Fiscal 2026 already demonstrates how quickly the numbers can move. CBO’s February outlook put the deficit near a rounded $1.9 trillion. By the July Monthly Budget Review, the full-year estimate was $2.1 trillion—about $200 billion higher. CBO attributed much of the revenue miss to lower customs duties after the Supreme Court’s tariff ruling, while total outlays were close to the earlier projection.[7]
In March, CBO initially estimated that terminating the IEEPA tariffs would increase cumulative deficits by $2.0 trillion over 2026–2036, including $1.6 trillion of lower primary surpluses or higher primary deficits and about $0.4 trillion of added interest.[8] By July, CBO noted that later tariffs could replace a substantial share of the lost revenue. That is exactly why the $2.0 trillion should not be mechanically spread across individual years.[7]
The baseline can worsen through weaker growth, higher interest rates, lower revenues, new spending, war or recession. It can improve through higher revenues, slower benefit growth, spending restraint, lower interest costs or stronger real productivity. But “the number can change” is not a rebuttal to the chart. The starting point is already a structural deficit large enough to push gross debt toward 145.5% of GDP by 2040.
Correct reading: $78.8 trillion is not destiny. It is the current-law centerline. Future policy will move the line, but it must actually change the arithmetic to change the direction.
The responsible conclusion is serious enough without inventing a doomsday date
The charts do prove that the fiscal gap is structural. After the pandemic distortion falls away, annual deficits remain extremely large and begin climbing again.
They do prove that the stock compounds. Gross debt approaches three times its 2020 level by 2040 in nominal terms and rises faster than the projected economy.
They do prove that interest is becoming a larger budget constraint. The outstanding stock is now large enough that rate levels and refinancing dynamics materially alter the deficit path.
They do prove that the Treasury market is part of fiscal policy. Who absorbs the issuance, at what maturity and at what yield becomes a central macroeconomic question.
But the charts do not prove that the United States becomes mechanically insolvent on a specific date. They do not prove an automatic dollar collapse. They do not prove that one party or one president created a two-decade, cross-administration path. They do not prove that every borrowed dollar is waste. They do not prove that the exact 2040 number will occur.
Debt sustainability depends on the relationship among the primary balance, the effective interest rate, nominal growth, currency credibility, maturity structure, investor demand and political capacity. A reserve-currency issuer has more room than a household or an emerging-market borrower in foreign currency. More room is not the same as no constraint.
The strongest claim the data support: under current law, the United States is not borrowing temporarily to bridge an emergency. It is operating a compounding fiscal system that requires permanently expanding demand for Treasury collateral.
The fiscal watchlist is more useful than staring at the debt clock
The debt clock is emotionally effective and analytically incomplete. The following measures reveal how the system is transmitting the debt load into markets and policy.
| Indicator | What it tells you | Stress signal |
|---|---|---|
| Primary deficit | The budget gap before net interest. | It remains large even before financing costs. |
| Net interest / revenue | How much fiscal capacity is pre-committed to carrying the debt. | Interest grows faster than revenues for a sustained period. |
| Average interest rate and rollover mix | How quickly market yields migrate into federal outlays. | Large refinancing needs collide with elevated coupons. |
| 10-year and 30-year yields | The market price of duration, inflation risk and term premium. | Long yields rise or refuse to fall while the Fed eases. |
| Treasury auction demand | How easily new supply clears across dealer, domestic and foreign buyers. | Repeated weak demand, larger concessions or rising dealer absorption. |
| Debt-to-GDP path | Whether the economy is growing faster than the obligation stock. | The ratio rises persistently outside recession. |
| Fed balance-sheet and liquidity tools | Whether monetary plumbing is being used to support market absorption. | Emergency support, renewed duration purchases or explicit yield targeting. |
The debt total tells you the scale. The watchlist tells you whether the scale is becoming a market event.
The debt story eventually becomes a liquidity story
The standard fiscal argument stops at the budget. The Pattern Nexus framework follows the obligation into the plumbing.
A Treasury deficit becomes issuance. Issuance becomes collateral. Collateral must be financed, margined, warehoused and distributed through dealers, banks, funds, foreign reserve managers, households, money-market vehicles and increasingly tokenized dollar rails. The debt is therefore both a public liability and a private-sector asset.
That dual role is why the endgame is not as simple as “the debt is bad” or “Treasuries are safe.” The system needs Treasury collateral. It can still be overwhelmed by the quantity, duration or yield at which that collateral must clear.
If the private sector can absorb the supply at stable real yields, the process can continue for a long time. If it cannot, the price adjusts. Yields rise. Balance sheets strain. The long end tightens housing, business investment and government financing. Political pressure then builds for debt-management changes, regulated demand, central-bank support or higher nominal growth.
That is fiscal dominance in practical terms. It does not require the Federal Reserve to announce that it has surrendered. It appears when the size and cost of the Treasury market begin narrowing the range of monetary choices.
The core conclusion: The United States can create the dollars needed to settle its nominal obligations. It cannot create unlimited real demand for long-duration claims at a politically preferred yield without changing inflation, regulation, market structure or the central-bank balance sheet.
That is the real message of the two infographics. The annual flow does not end. The accumulated stock accelerates. Interest feeds the flow back into the stock. The long end decides when that arithmetic becomes a market constraint.
FAQ
What is the simplest difference between the federal deficit and the federal debt?
The deficit is the annual gap between spending and revenue. The debt is the accumulated stock of outstanding federal obligations. The deficit is a flow measured over time; debt is a stock measured on a date.
Why is “Fed deficit” the wrong phrase?
“The Fed” usually means the Federal Reserve. The Federal Reserve conducts monetary policy and manages its own balance sheet. The federal budget deficit results from federal taxing and spending decisions and is financed by Treasury. The central bank can affect financing conditions, but it does not create the congressional budget deficit.
Why does CBO often quote debt held by the public instead of total debt?
Debt held by the public measures federal obligations held outside intragovernmental accounts and is therefore more directly tied to market absorption, interest costs and crowding out. Gross or total debt adds intragovernmental holdings. Both are valid; they answer different questions.
Is the $78.8 trillion 2040 debt figure an official number printed directly in one CBO table?
No. CBO prints nominal gross-debt totals through 2036 in its February budget outlook. For 2037–2040, Pattern Nexus multiplied CBO’s published gross-debt share of GDP by CBO’s published nominal GDP series. The resulting 2040 estimate is approximately $78.801 trillion.
Will federal debt be exactly $78.8 trillion in 2040?
Almost certainly not to the dollar, and possibly not close if major laws, wars, recessions, inflation or interest rates change. It is a current-law baseline, useful for scale and direction. It is not a guarantee.
Why does debt growth not exactly equal the sum of annual deficits?
The measures have different timing and accounting conventions. Gross debt also includes intragovernmental holdings, and Treasury borrowing can differ from the unified deficit because of cash-balance changes, federal credit and other financing transactions. This article also splices historical, current-estimate and projected datasets.
Can the Federal Reserve simply buy the debt?
The Fed can buy Treasury securities in the secondary market and replace duration held by the public with reserve balances. That can support liquidity and lower term premium. It does not cancel Treasury’s liability, and it can create inflation, currency or credibility costs if used to subordinate monetary policy to fiscal financing.
Can the United States default if it issues its own currency?
A currency issuer has far more nominal payment capacity than a household or a borrower in foreign currency. A technical or political default is still possible, and inflation can impose a real loss even when every nominal dollar is paid. The more likely constraint is not running out of dollars; it is losing price stability or market confidence while keeping financing costs politically tolerable.
What would stabilize the debt-to-GDP ratio?
The combination of the primary budget balance, the effective interest rate and nominal economic growth must improve enough that debt no longer grows faster than GDP. That can come from revenue, spending restraint, stronger real growth, lower interest costs, higher inflation, or a combination. Each path distributes costs differently.
Pattern Nexus framework first; official fiscal data second
The first three links are prior Pattern Nexus work on fiscal dominance and the long end. Sources [4]–[10] are primary CBO and Treasury data used for the two infographics and this article. Values are rounded in prose; the infographic working data retain additional precision.
- [1] Pattern Nexus, Fiscal Dominance and the Sticky Term Premium: Why Long Rates Won’t Obey the Fed.
- [2] Pattern Nexus, The Fed’s Long-End Trap: Why a 4.65% 10-Year Is Already Doing the Tightening.
- [3] Pattern Nexus, The Price of a Fractured World: The 30-Year Treasury as a Geopolitical Signal.
- [4] Congressional Budget Office, The Budget and Economic Outlook: 2026 to 2036, February 11, 2026.
- [5] Congressional Budget Office, The Long-Term Budget Outlook: 2026 to 2056, February 25, 2026.
- [6] U.S. Congressional Budget Office data repository, Annual long-term budget data, fiscal 2026 release.
- [7] Congressional Budget Office, Monthly Budget Review: July 2026, August 10, 2026.
- [8] Congressional Budget Office, Budgetary Effects of Terminating Tariffs Imposed Under the International Emergency Economic Powers Act, March 5, 2026.
- [9] U.S. Department of the Treasury, Fiscal Data, Historical Debt Outstanding.
- [10] U.S. Department of the Treasury, Fiscal Data, Debt to the Penny, accessed August 22, 2026.
This is an educational macroeconomic systems analysis, not investment, tax or legal advice. The 2020–2025 values are historical. The 2026 deficit is CBO’s updated estimate; the 2026 debt point is an August observation. Later values are current-law projections or Pattern Nexus calculations from CBO’s published GDP-share and nominal-GDP series. Forecasts are not guarantees.
Qual è la tua reazione?
 Mi piace
0
Mi piace
0
 Non mi piace
0
Non mi piace
0
 Amore
0
Amore
0
 Divertente
0
Divertente
0
 Wow
0
Wow
0
 Triste
0
Triste
0
 Arrabbiato
0
Arrabbiato
0

Founder of Pattern Nexus. I research markets, macro, geopolitics, AI, history, ancient systems, and the patterns most people overlook. I’m also building Market Radar, a trading scanner designed to read pressure, risk, confirmation, and setup quality before chasing a move. Pattern Nexus is where I connect the dots between data, history, technology, and the bigger system playing out around us.






Commenti (0)