
$223T Derivatives System: The Hidden Liquidity Fragility Beneath U.S. Banking
The U.S. banking system sits on top of $223 trillion in derivatives — but the real risk isn’t the notional value. It’s liquidity. This deep-dive breaks down how margin calls, collateral chains, FDIC limits, repo plumbing, and Federal Reserve backstops tie together — and why liquidity shocks, not headlines, trigger systemic stress. Includes beginner-friendly breakdowns, research links, historical case studies, and charts.
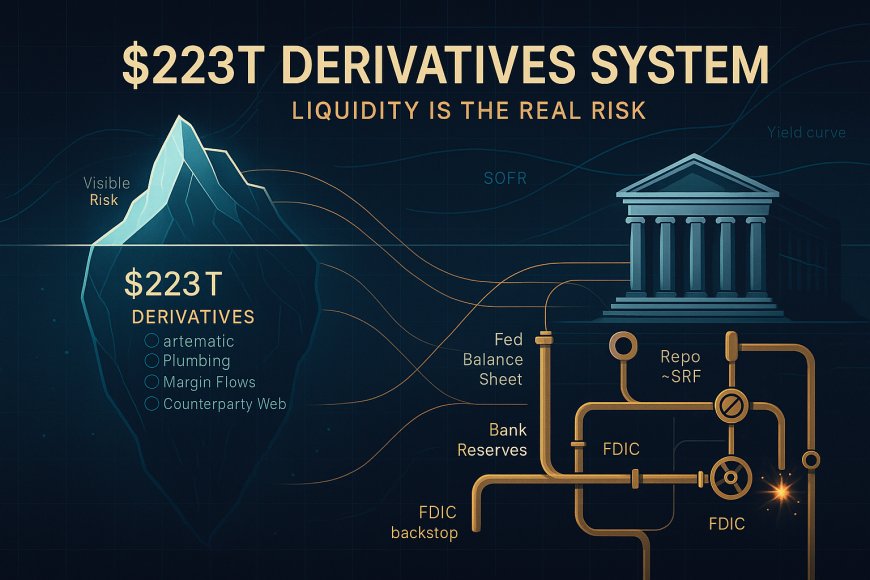
$223 Trillion+ in U.S. Bank Derivatives: Why Liquidity, Not Notional, Determines Systemic Risk
A gargantuan number by any measure, the notional value of U.S. bank derivatives frequently makes headlines. But headlines mislead. This piece explores how gross notional amounts relate to net exposure, why liquidity matters more than sensational figures, and what history teaches about contagion risks when margins and collateral requirements collide with tight funding conditions.
Related reading on Pattern Nexus: The Reverse Repo Trap • QT vs QE Explained • Gold, Real Rates & Liquidity
Overview
As of mid-2025, insured U.S. commercial banks and savings associations held more than $223 trillion in derivative notional amounts. Four megabanks accounted for roughly 87 percent of that total and about 72 percent of net current credit exposure (NCCE) per the OCC Quarterly Derivatives Report (Q2 2025) . While these numbers are eye-watering, they are not a one-to-one measure of the risk of loss. A derivative’s notional is the face amount on which payments are calculated; it is not the amount at stake. Real risk depends on netting agreements, collateral, and counterparty solvency.
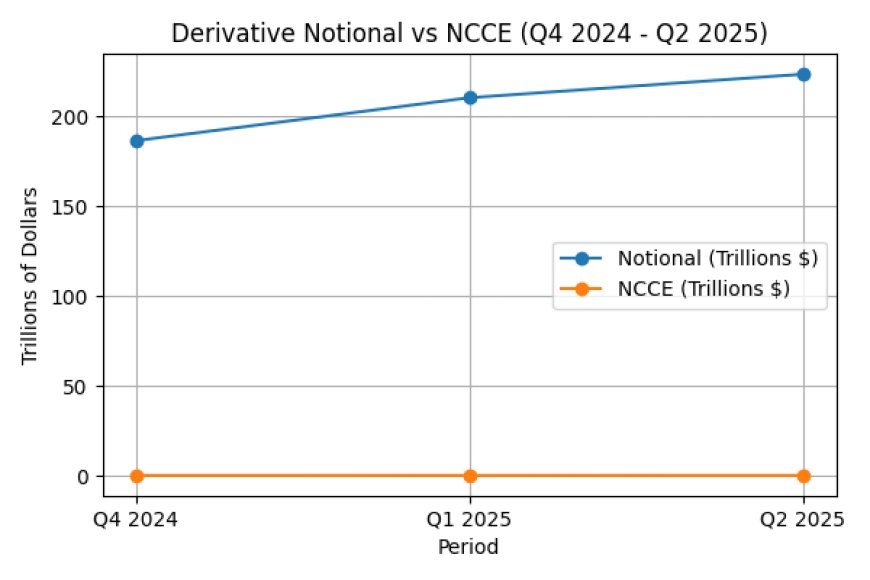
From late 2024 through 2025 the notional amount of bank derivatives fluctuated significantly. After dropping to $186.5 trillion in the fourth quarter of 2024, the notional surged to $210.4 trillion in the first quarter of 2025 and climbed again to $223.5 trillion in the second quarter. Net current credit exposure followed a different path, rising to $270 billion in Q4 2024, dropping to $249 billion in Q1 2025 and then increasing to $267 billion . These shifts underscore that risk depends on market conditions and netting, not just gross exposures.
One theme emerges throughout this article: liquidity. Derivatives are collateralised instruments. When markets move, losing positions owe variation margin in cash or high-quality collateral. In benign times, this plumbing runs smoothly. In stress, rising margin calls collide with scarce reserves. That’s when a seemingly safe hedge can morph into a forced sale, and when central banks pivot from quantitative tightening (QT) to stabilising funding markets. To understand the real risks, we need to unpack how derivatives work and why liquidity matters.
Numbers & Trends (Q4 2024–Q2 2025)
Here are the key figures from recent OCC reports. Each statistic is accompanied by a clickable description and source link :
- Notional shrinks then expands: After contracting to $186.5 trillion in Q4 2024, notional amounts rose to $210.4 trillion in Q1 2025 and to $223.5 trillion in Q2 2025.
- Net current credit exposure (NCCE): NCCE jumped to $270 billion in Q4 2024, fell to $249 billion () in Q1 2025 and climbed to $267 billion in Q2 2025.
- Concentration: In Q4 2024 four banks held 86.5% of notional and 71.1% of NCCE (source: OCC Q4 2024; =). By Q2 2025 those four banks held 87.3% of notional and 72.2% of NCCE (source: OCC Q2 2025).
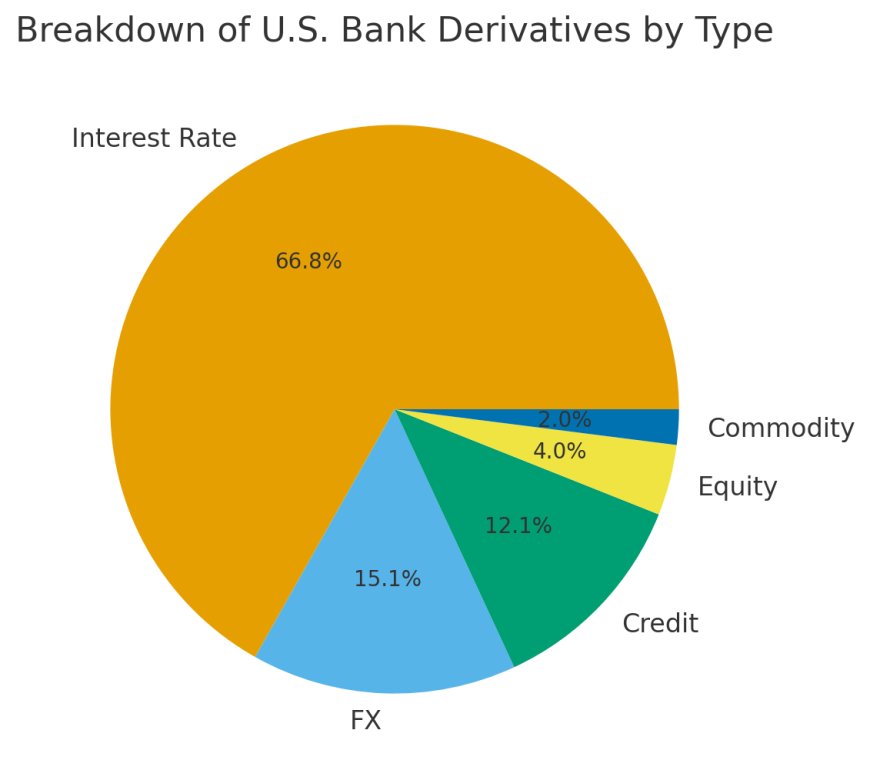
- Interest-rate dominance: Interest-rate derivatives represented 67.5% of notional ($125.9 trillion) in Q4 2024 (OCC Q4 2024, 67.0% ($141.0 trillion) in Q1 2025 (OCC Q1 2025; ) and 66.5% ($148.7 trillion) in Q2 2025 (OCC Q2 2025; ).
- Trading revenue volatility: Bank trading revenue was $14.8 billion in Q4 2024 (OCC Q4 2024, $15.0 billion in Q1 2025 (OCC Q1 2025 and $16.6 billion in Q2 2025 (OCC Q2 2025;
For a visual comparison of the notional and net exposure trends, see the chart above. It plots the total notional amount (in trillions) alongside NCCE (converted to trillions for scale) across recent quarters. The gap highlights how small net exposure is relative to gross notional but also how quickly both metrics can move.
Derivatives 101: A Plain-Language Guide
At their core, derivatives are contracts whose value “derives” from the price or level of something else—such as interest rates, currencies, commodities, stocks, or credit spreads. They can be used to hedge risk, to speculate, or to provide exposure to markets without owning the underlying asset. Here are the main categories:
- Interest-rate swaps (IRS): Two parties exchange streams of interest payments—typically a fixed rate for a floating rate—to manage interest-rate exposure on loans or securities.
- Futures and forwards: Agreements to buy or sell an asset at a specified price on a future date. Futures are standardised and exchange-traded; forwards are bespoke and over-the-counter (OTC).
- Options: Contracts that give the holder the right, but not the obligation, to buy or sell an asset at a predetermined price before or at expiration. They require a premium.
- Credit default swaps (CDS): Insurance-like contracts where a protection buyer pays a fee to a protection seller in exchange for compensation if a borrower defaults.
- Foreign exchange (FX) derivatives: Instruments used to hedge or speculate on currency movements, including FX swaps, forwards, and options.
Why do banks hold so many derivatives? Primarily to hedge. Commercial banks originate loans (exposure to fixed or floating rates), invest in securities, and support client trading. Swaps help them manage mismatches between assets and liabilities. Futures and options support customer activity and trading desks. Only a subset of derivatives is speculative; many are risk-mitigating.
Deep Dive: Types of Derivatives & Embedded Risks
While the basics summarise broad categories, deeper insight requires understanding how risk profiles differ by product and counterparty. Below we highlight common derivative types and the specific risk channels they introduce:
Interest-Rate Derivatives
Interest-rate swaps (IRS) are by far the largest category of bank derivatives. Banks use IRS to hedge the difference between fixed-rate loans (like mortgages) and variable-rate funding (like deposits). When interest rates fluctuate rapidly—as they did in 2023 and 2024—the value of these swaps can move sharply. A key risk is basis risk: the floating leg often references an index like SOFR or LIBOR, which may not perfectly offset a bank’s funding costs. If the hedged asset or liability behaves differently from the swap, residual risk remains.
Forward rate agreements (FRAs) allow banks to lock in a future interest rate for a notional principal. They are widely used for short-term hedging of expected funding costs. Because FRAs are settled in cash at the start of the contract, they require less ongoing margin but still create counterparty exposure.
Overnight index swaps (OIS) reference a daily overnight rate (e.g., SOFR). They dominated trading in April 2025, accounting for more than $5 trillion in daily turnover globally per the BIS Triennial Survey: OTC interest rate derivatives turnover (Apr 2025) . OIS contracts are shorter in duration but react quickly to central-bank policy changes, making them sensitive to liquidity conditions.
Credit Derivatives
Credit default swaps (CDS) exploded in notoriety during 2008. Banks and insurers sold protection on mortgage-backed securities and corporate debt. When downgrades came, the sellers owed huge sums. In modern bank portfolios, CDS volumes are lower than interest-rate swaps, but they concentrate risk because default events produce large discrete payouts. AIG’s near-collapse in 2008 was triggered by CDS margin calls, forcing the Federal Reserve to intervene.
Total return swaps (TRS) and other structured credit instruments give investors economic exposure to a bond or loan without owning it. They shift both price risk and default risk. During periods of credit stress, TRS can amplify mark-to-market losses and create sudden margin demands.
Foreign Exchange & Commodity Derivatives
Although not the focus of this piece, FX and commodity derivatives are essential to global trade and investment. Banks offer FX forwards and options to clients hedging currency exposure. Commodity swaps help producers and consumers manage price risks in oil, metals, and agriculture. These markets are generally smaller for banks than interest-rate swaps, but extreme price moves—such as the oil futures collapse in April 2020—can lead to large variation margin calls and liquidity demands.
Counterparty & Market Risk
Derivatives generate two principal types of risk: market risk and counterparty credit risk. Market risk refers to changes in the value of a derivative due to moves in underlying rates, prices, or volatilities. Counterparty risk arises when the other party in the contract fails to perform.
Market Risk & Value-at-Risk (VaR)
Banks quantify market risk using metrics like Value-at-Risk (VaR) and stressed VaR. These models estimate potential losses over a specified horizon with a given confidence level. During periods of high volatility, VaR can spike, prompting banks to reduce exposures or increase capital. Regulatory stress tests assess banks’ resilience to market shocks, including interest-rate spikes and basis dislocations. For example, see the OCC’s quarterly reporting framework in the OCC Quarterly Derivatives Report (Q2 2025) .
Counterparty Credit Risk & Net Current Credit Exposure
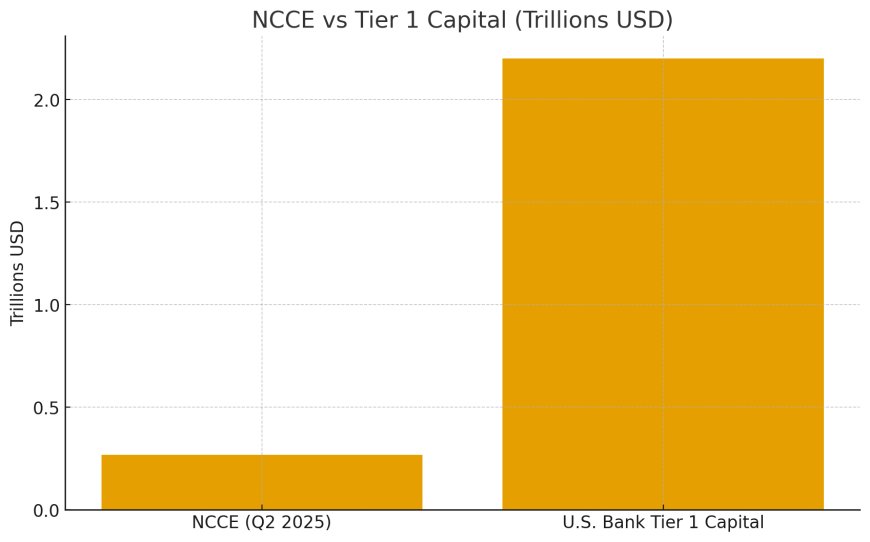
The OCC reports NCCE as a measure of potential loss if counterparties default. NCCE subtracts the value of collateral and netting from gross positive exposures. While notional amounts exceeded $223 trillion in Q2 2025, NCCE was only $267 billion per the OCC Q2 2025 report . This difference reflects two key mitigants:
- Netting agreements: Under International Swaps and Derivatives Association (ISDA) master agreements, gains and losses across multiple contracts with the same counterparty are netted. Only the net amount is owed.
- Collateral and margin: Variation margin is posted daily (or intraday) based on current market values. Initial margin is collected up front to cover potential future exposure. High-quality collateral and central clearing further reduce credit risk.
Nevertheless, credit risk remains. If a major counterparty defaults, the process of replacing contracts can be costly. In 1998 the hedge fund Long Term Capital Management (LTCM) faced massive margin calls on relative-value trades. Without a coordinated rescue, its failure could have triggered broader losses across its counterparties (see History).
“Too Big to Fail,” FDIC Reality, and Why Backstops Exist
The intuition: The U.S. banking system is structurally maturity-transformed and leveraged. It cannot hold dollar-for-dollar cash against deposits; it relies on confidence, collateral, and central-bank liquidity. That’s why backstops exist—and why systemic liquidity (reserves, repo access) matters more than headline notional figures.
How FDIC Insurance Actually Works
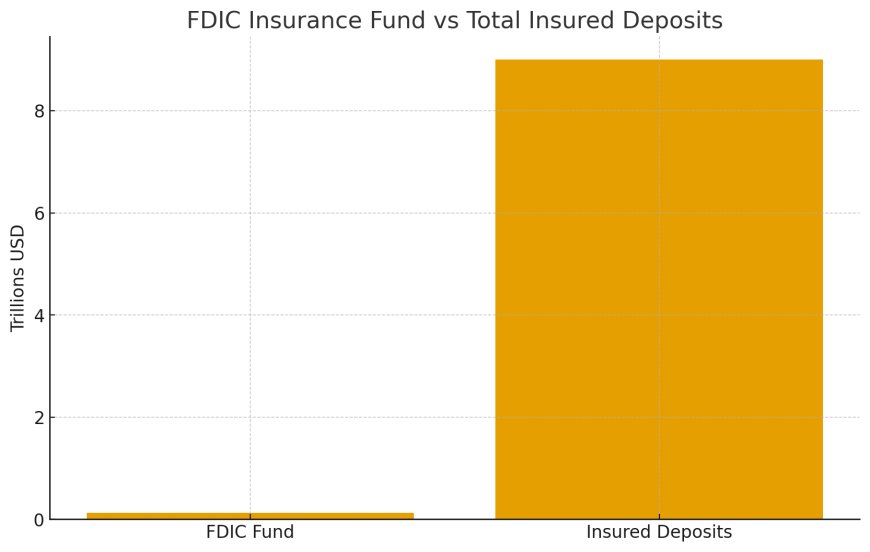
FDIC deposit insurance protects most retail and small-business depositors up to statutory limits (generally $250,000 per depositor, per bank). The insurance pool—the Deposit Insurance Fund (DIF)—targets a reserve ratio (assets of the fund ÷ insured deposits). Historically, the statutory minimum target has been 1.35% of insured deposits, not 100%. See: FDIC — Deposit Insurance and FDIC — Reserve Ratio / Restoration Plan .
Translation: The DIF is not meant to cash-collateralize all deposits at once. In a systemic event, the FDIC can draw on an explicit Treasury backstop/line of credit , impose special assessments on banks, and use resolution tools to bridge institutions and sell assets over time.
“1.5%” vs. Systemic Reality
You’ll hear takes like “there’s only ~1–2% to back deposits.” What’s true: the DIF’s reserve ratio is intentionally small relative to insured deposits. That doesn’t mean only 1–2% of deposits are “backed.” It means the system is designed to resolve failing banks over time—via purchase-and-assumption transactions, bridge banks, loss-sharing, and assessments—while maintaining confidence. See: FDIC — Quarterly Banking Profile.
When a Large Institution Fails: The Toolchain
- Least-cost resolution & bridge banks: FDIC can transfer deposits and good assets to a healthy buyer or a temporary bridge bank while it markets the franchise. Primer: FDIC — Failed Bank List & Resolutions .
- Systemic Risk Exception (SRE): Allows the FDIC, Fed, and Treasury to take actions beyond least-cost if failure would threaten financial stability (e.g., making all deposits whole). See: FDIC — SRE authority.
- Orderly Liquidation Authority (OLA): For certain very large/nonbank SIFIs under Dodd-Frank Title II—run by the FDIC if bankruptcy is not viable. See: Treasury/FSOC — OLA overview
- GSIB playbook (TLAC): The biggest banks hold loss-absorbing debt and have single-point-of-entry plans so equity/creditors take losses before taxpayers. Primer: Federal Reserve — TLAC.
Why This Links Directly to Liquidity (and Derivatives)
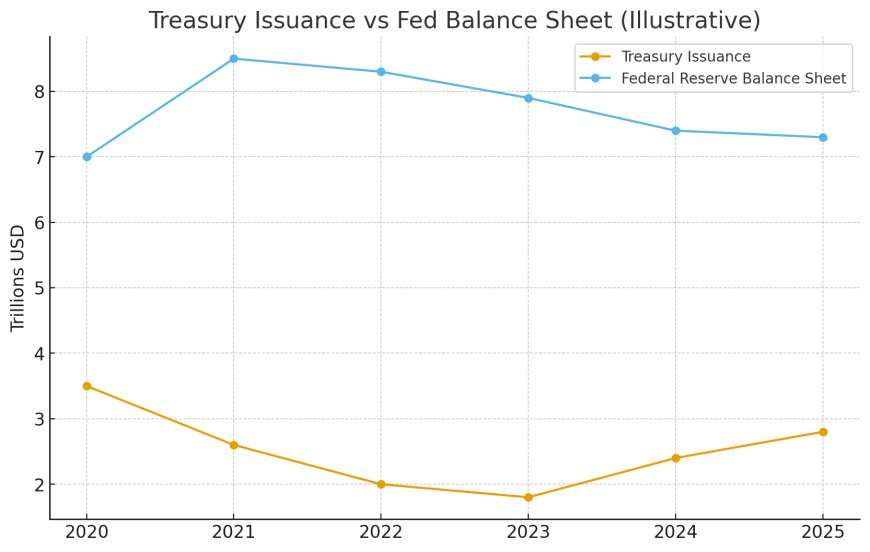
Crises are about timing and cash. In a derivatives-heavy system, losses arrive via variation margin and collateral calls—daily and sometimes intraday. If reserves are scarce (QT, heavy Treasury issuance, or broad risk-off), funding markets seize up before assets can be sold at fair value. That’s when the central bank becomes market-maker-of-last-resort: repos, standing facilities, and, in larger shocks, asset purchases to restore function. See: Federal Reserve — Credit & Liquidity Programs .
M2, Reserves, and “Why the Money Stock Tends to Rise Over Time”
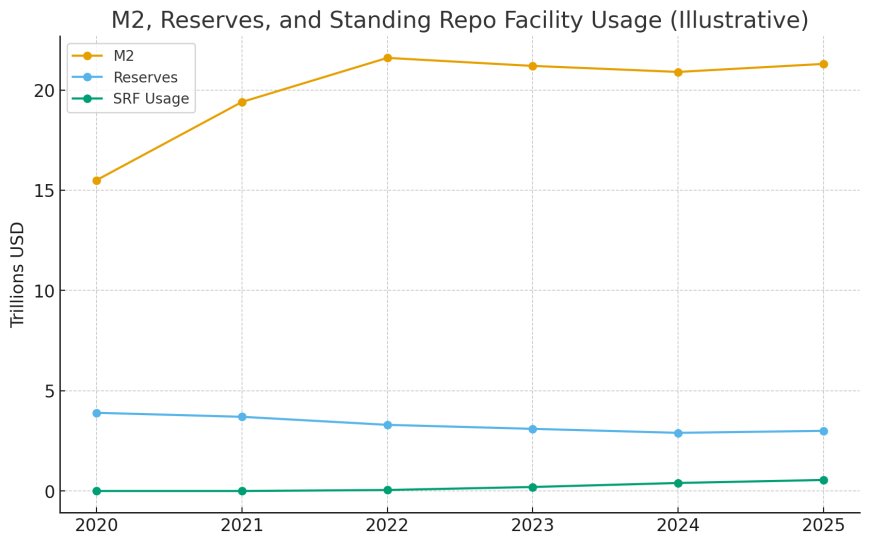
Reserves (balances banks hold at the Fed) are the immediate plumbing variable for margin/funding; M2 is a broader measure of money in the economy. Over the long run, nominal GDP growth + credit creation tends to push M2 higher. Data: FRED — M2 Money Stock and FRED — Reserve Balances with Federal Reserve Banks .
Unfunded Liabilities & Fiscal Backdrop
The long-term fiscal outlook (entitlements, interest, demographics) implies rising federal outlays. Official accounting distinguishes between on-budget deficits and long-horizon obligations. However you frame it, a larger Treasury footprint intersects with banking liquidity, repo dynamics, and derivative margining. See: CBO — The 2025 Long-Term Budget Outlook and Treasury — Financial Report of the U.S. Government .
Bottom Line
- FDIC isn’t 100% pre-funded on purpose. Confidence + resolution + Treasury backstop designed into system.
- Liquidity is the bridge. Between mark-to-market losses and orderly resolution, the system needs collateral & cash now.
- M2/reserves trend up because liabilities scale with economic + fiscal reality — especially when margin demands surge.
- Derivatives amplify liquidity needs because collateral calls are real-time.
Margin, Collateral & Netting: The Plumbing
The derivative system runs on a web of margin requirements and collateral flows. Understanding this plumbing is critical to seeing why liquidity matters:
- Variation margin: Posted when a contract loses value, usually in cash or high-quality collateral. In cleared markets, variation margin is called intraday. Rising volatility increases demands.
- Initial margin: Collected up front to cover potential future exposure. Higher haircuts or rising margin schedules drain liquidity system-wide.
- Netting & close-out: ISDA agreements allow netting across trades. Without netting, system exposures would be an order of magnitude larger.
Why liquidity matters: In quiet markets, margin flows are manageable. But when reserves tighten, variation margin demands create a dash for cash. This happened in March 2020, when even the U.S. Treasury market seized and the Fed intervened with massive repo injections and QE.
Similarly, the UK’s 2022 LDI crisis showed how leveraged hedging + rising yields forced collateral posting, triggering forced gilt sales until the Bank of England intervened
Liquidity & Monetary Policy: QT, SRF & the “Money Printer” Debate
Large derivative books don’t automatically mean “the Fed must print money.” But margin calls and collateral cycles do intersect with monetary mechanics.
Banks fund margin calls with reserves or Treasuries. Under QE, reserves are abundant. Under quantitative tightening (QT), reserves shrink. When QT meets high Treasury issuance or broad risk-off, repo stress emerges.
In 2024–2025, reserve scarcity tightened SOFR spreads and drove heavy usage of the Fed’s Standing Repo Facility (SRF). To avoid a repeat of 2019’s repo crisis and to manage collateral stress, the Fed signaled QT ending December 1, 2025.
The Fed’s liquidity ladder:
- Smooth QT: Reinvest maturities to stabilize reserves.
- Repos: Term & overnight repos (SRF) to backstop collateral funding.
- QE: Outright bond buying to restore market functioning under severe stress.
This isn’t “money printing for speculation.” It’s maintaining system plumbing. Margin calls settle in reserves or repo collateral; when banks scramble, the Fed acts to prevent cascading funding failures.
Deeper dives: • QT vs QE Explained • Reverse Repo Trap
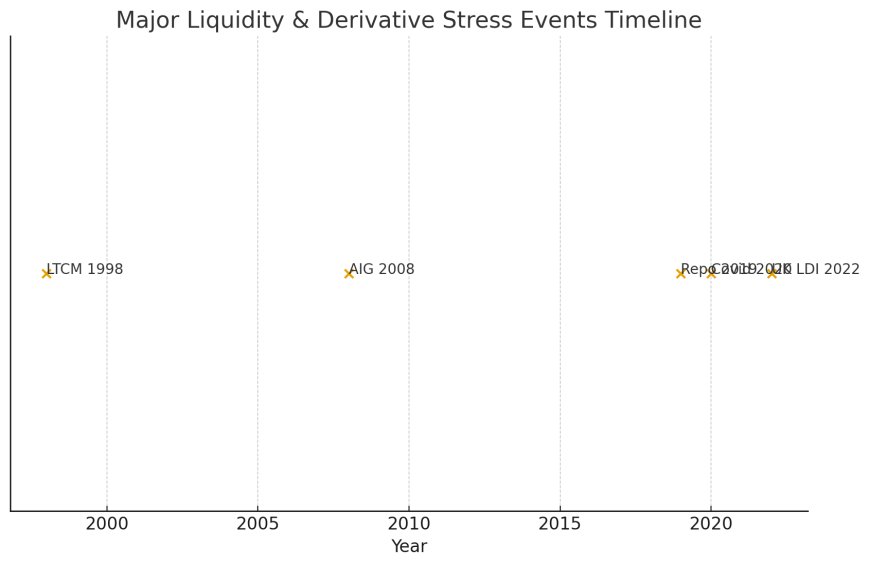
Historical Stress Episodes: Lessons from the Past
Derivative stress = leverage + margin calls + insufficient liquidity. Key case studies:
1998 — LTCM
Highly leveraged bond spreads strategy failed; margin calls cascaded. Fed brokered rescue to prevent systemic liquidation.
2008 — AIG & CDS
AIG sold CDS protection on mortgage credit. Downgrades → collateral calls → Fed bailout to prevent systemic counterparty failure.
2011–2012 — European Sovereign Debt Crisis
Bond-spread hedging stress + funding pressure → ECB launched LTRO repo facilities.
2020 — Dash-for-Cash
Leveraged Treasury basis trades + panic selling → repo spike, Treasury illiquidity → unlimited QE.
2022 — UK LDI Crisis
Pension hedging leverage + gilt yield spike → forced sales → BOE emergency gilt purchases.
Theme: Derivatives aren’t dangerous until liquidity thins. Margin dynamics turn price moves into systemic instability.
Potential Stress Triggers in 2025 and Beyond
- Rate shocks: Rapid hikes or fast cuts → swap repricing → margin stress.
- Funding tightness: Repo spikes, SRF usage, RRP depletion signal reserve scarcity.
- Counterparty events: Hedge fund or dealer collapse (e.g., Archegos).
- Basis trade unwind: Leveraged Treasury trades forced out → collateral spiral.
- Geopolitical shocks: Currency & commodity stress → variation margin surge.
Not a forecast — a conditional map. Derivatives amplify shocks when liquidity thins. Clearinghouses, capital rules, and central bank facilities dampen — but don’t eliminate — systemic risk.
What It Means for You
For depositors and retail investors, the derivative system seems distant. But its plumbing underpins many facets of everyday finance:
- Deposits & FDIC insurance: Standard bank deposits remain insured up to the statutory limit (currently $250,000 per depositor per institution). Even in stress, the FDIC protects depositors. Derivative losses could affect bank profitability, but deposit insurance limits shield retail customers.
- Loans & mortgages: Bank funding costs influence loan rates. Derivative-related funding stress can raise mortgage and business loan rates. Likewise, a credit crunch triggered by large derivative losses could tighten lending standards.
- Investment portfolios: Broad market volatility influences 401(k) balances and brokerage accounts. Systemic stress can cause correlations to rise; even diversified portfolios may drop in tandem. Understanding the drivers of volatility helps investors manage risk.
- Pensions & insurance: Many pension funds and insurers use derivatives to hedge liabilities. Stress can force them to raise cash, potentially affecting payouts or funding levels. The UK LDI episode is a cautionary tale.
In short, while you may never trade a swap, the stability of derivatives markets matters for your savings, borrowing costs, and financial security.
Signals to Watch
Monitoring a few key indicators can help gauge the health of the derivative and funding ecosystem:
- Money-market spreads: Compare SOFR, fed-funds, and repo rates. Persistent elevations or spikes indicate funding stress.
- SRF & RRP usage: High take-up of the Standing Repo Facility or persistent drains from the overnight reverse repo facility (ON RRP) reveal reserve dynamics. Sudden shifts can signal changes in liquidity demand.
- Dealer balance-sheet capacity: Narrow bid/ask spreads in off-the-run Treasuries and low fails-to-deliver suggest healthy market making. Widening spreads or persistent fails may precede stress.
- Bank disclosures: Quarterly reports and regulatory filings reveal NCCE, VaR, and collateral posting. Rising exposures or changes in clearinghouse margin can indicate growing risk.
- Hedge-fund leverage: Public data on leverage in futures and swaps (e.g., CFTC Commitments of Traders) can hint at crowded trades that might unwind violently.
- Policy pivots: Watch for Fed announcements on QT, repos, and liquidity facilities. Sudden changes often coincide with emerging stress.
Glossary
Below is a concise glossary of key terms used in this article. Tables are kept succinct to avoid long sentences. If you need more detail, follow the internal links provided.
| Term | Definition / Use |
|---|---|
| Notional | Face amount used to calculate derivative payments; not equal to risk of loss. |
| NCCE | Net Current Credit Exposure: potential loss if counterparties default after netting and collateral. |
| Variation Margin | Daily (or intraday) payments reflecting mark-to-market losses. |
| Initial Margin | Up-front collateral to cover potential future exposure until next margin call. |
| ISDA Master Agreement | Standard contract enabling netting across multiple derivatives with a counterparty. |
| QT | Quantitative Tightening: the Fed reduces its bond holdings, shrinking reserves. |
| QE | Quantitative Easing: the Fed buys bonds, expanding reserves and lowering term premiums. |
| SRF | Standing Repo Facility: Fed facility lending cash against Treasuries to ease funding stress. |
| OIS | Overnight Index Swap: derivative referencing an overnight rate (e.g., SOFR). |
Frequently Asked Questions
Is $223 trillion really at risk?
No. The $223 trillion figure is the notional value of all bank derivatives. Net exposure (NCCE) is roughly $267 billion (see OCC Q2 2025 report —. Notional amounts often cancel through netting; collateral further reduces risk.
So why worry about big numbers at all?
Because they reflect activity and concentration. A small number of banks dominate derivative markets. Large positions mean that mis-hedges, counterparty failures or rapid market moves can produce substantial losses. Combined with scarce liquidity, the risk is that margin calls force fire-sales.
Does the Fed have to “print money” because of derivatives?
Not automatically. The Fed may supply reserves via repos, adjust QT, or in extreme cases undertake QE to stabilise funding markets. These moves aim to keep the plumbing working, not to inflate asset prices for speculation.
Are my bank deposits safe?
Deposits are insured up to $250,000 per depositor per bank. A bank’s derivative losses could hurt its capital, but deposit insurance protects consumers. However, stress can spill over through credit availability and market volatility.
TL;DR Summary
- $223 trillion in notional derivatives is not the risk number; net exposure is around $267 billion in Q2 2025 (see OCC Q2 2025 report . Concentration and liquidity determine systemic risk.
- Notional fell sharply in Q4 2024 and bounced back in Q1–Q2 2025 (OCC Q4 2024 f; OCC Q1 2025 ; OCC Q2 2025 ).
- Interest-rate derivatives dominate (about two-thirds of notional) (see OCC reports above). Four banks hold roughly 87% of derivatives (see OCC Q2 2025).
- Liquidity, margin and collateral flows matter more than gross notional. Tight reserves and heavy margin calls can create systemic stress.
- History shows leverage + margin + scarce liquidity = risk (LTCM 1998, AIG 2008, Dash-for-Cash 2020, UK LDI 2022).
SEO Keywords
bank derivatives, $223 trillion, notional vs exposure, interest-rate swaps, net current credit exposure, NCCE, margin calls, variation margin, collateral, repo, SRF, ON RRP, quantitative tightening, quantitative easing, liquidity, SOFR, systemic risk, OCC Q2 2025, OCC Q1 2025, OCC Q4 2024, BIS 2025 survey, LTCM, AIG, LDI crisis.
Apa Reaksi Anda?
 Suka
0
Suka
0
 Tidak Suka
0
Tidak Suka
0
 Cinta
0
Cinta
0
 Lucu
0
Lucu
0
 Wow
0
Wow
0
 Sedih
0
Sedih
0
 Marah
0
Marah
0

Founder of Pattern Nexus. I research markets, macro, geopolitics, AI, history, ancient systems, and the patterns most people overlook. I’m also building Market Radar, a trading scanner designed to read pressure, risk, confirmation, and setup quality before chasing a move. Pattern Nexus is where I connect the dots between data, history, technology, and the bigger system playing out around us.
















Komen-komen (0)