
The Polar Vortex Is Stretching to the Breaking Point: Why Late December Could Turn Brutal
The polar vortex is undergoing rapid deformation between December 7–11, 2025, with stratospheric winds elongating into a classic pre-collapse pattern. This Pattern Nexus deep dive explains what the vortex evolution means, how the cold propagates downward, and why North America may be the bullseye for a severe late-December cold outbreak.
Today’s Update (Dec 7 Live Data + Dec 9 & Dec 12 Projections)
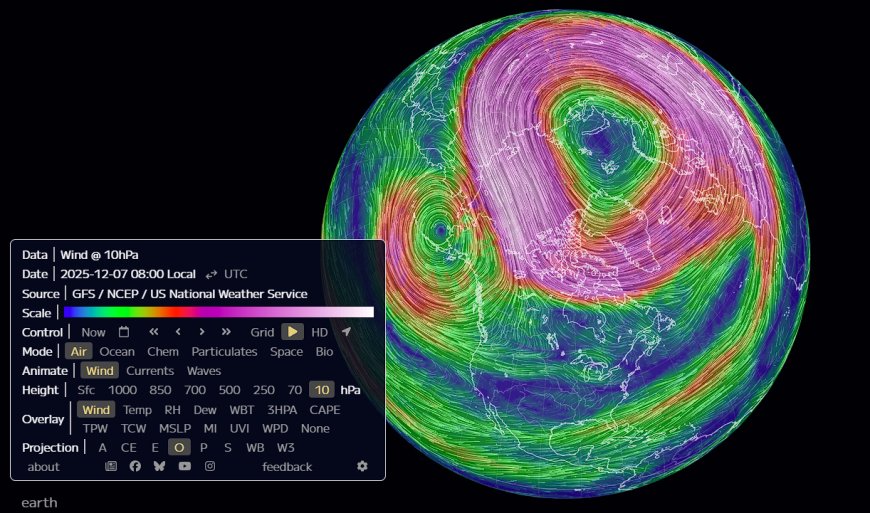
The polar vortex has now entered a phase of structural deformation that’s impossible to ignore. Today’s frame — December 7 — isn’t a forecast. It’s live. It’s real. It’s happening right now. And when you line that up against the Dec 9 and Dec 12 model projections, the shape of the next two weeks becomes brutally clear: the vortex is weakening, elongating, and shifting in a way that typically precedes major Arctic displacements into North America.
The Live State (Dec 7): The Vortex Is Already Breaking Symmetry
The first frame shows the vortex as it exists today:
- Completely off-center around the pole
- Pulled into a stretched “comma” shape rather than a tight circle
- A deep intrusion of warm air rising into the polar cap
- Core circulation displaced away from the geographic pole
- Rotation field uneven, with weakening along the western flank
This is the early phase of a deformation event — the kind that historically becomes far worse once downstream waves amplify. We’re already past the “early wobble” stage. We’re in the beginning of a structural distortion.
This is not what a healthy polar vortex looks like. A stable vortex is tight, concentric, symmetric, and anchored. This is none of those things.
The December 9 Projection: Split-Like Geometry Starts Emerging
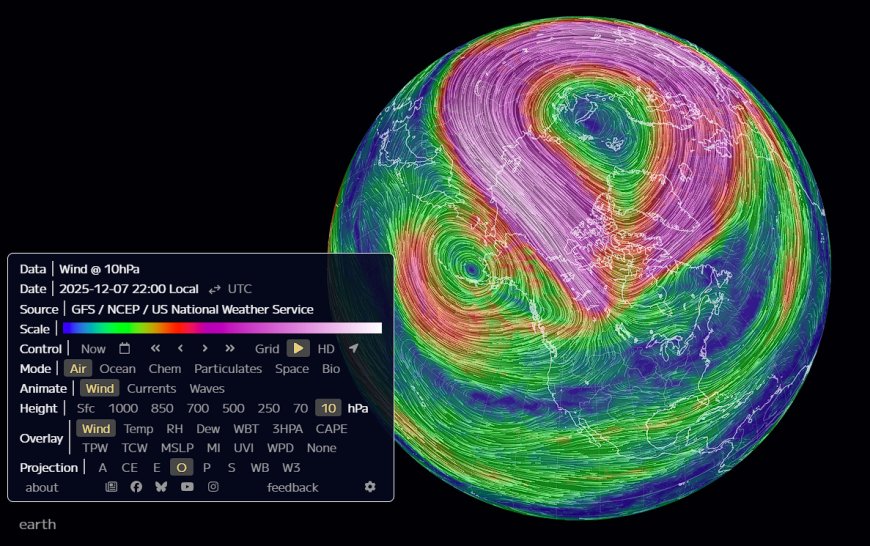
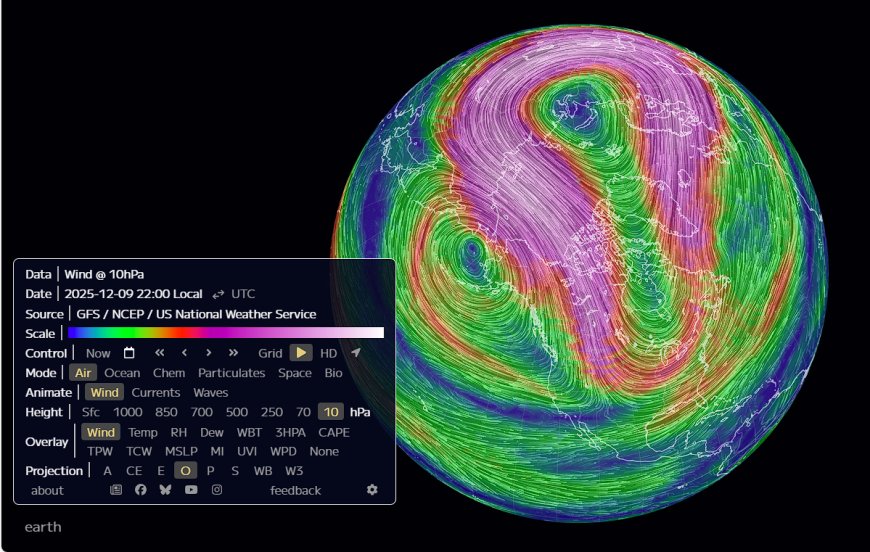
The next frame, roughly 48 hours out, shows the deformation accelerating. The vortex elongates further, forced into a stretched, peanut-like configuration. What stands out:
- The warm-air ridge intrusion over the Arctic strengthens and digs deeper
- The vortex core pulls southeast toward Canada, away from its normal anchor point
- The western lobe expands as rotational integrity weakens
- Wind speeds concentrate along a tightening band, indicating shear and strain
- The entire structure tilts — a classic signature of downward-coupling potential
When you see a vortex stretched like taffy, you know the troposphere is about to feel the consequences. This isn’t a random wobble. It’s a full, large-scale displacement pattern forming.
The Dec 9 projection is the warning shot — the system is losing its stability point.
The December 12 Projection: This Is How You Set Up a Continental Outbreak
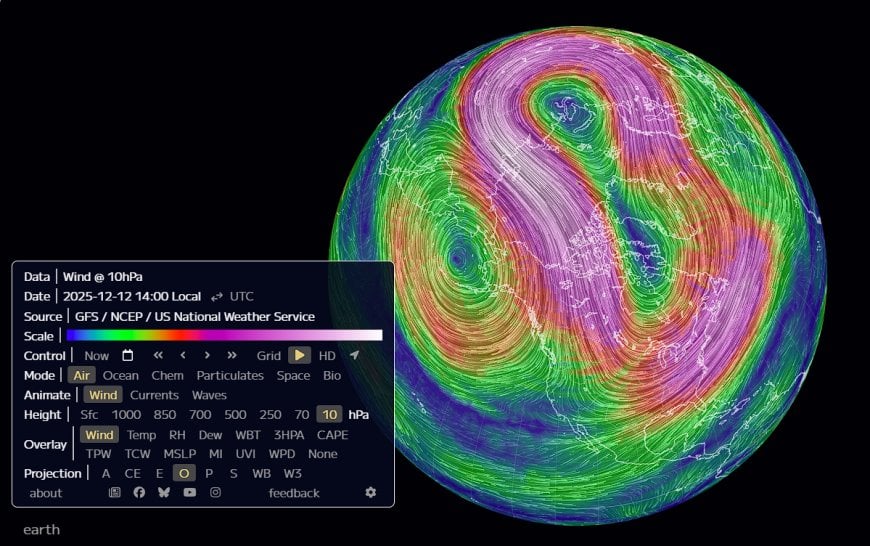
By Dec 12, the model diverges from “concerning” into “textbook high-risk.” The vortex becomes fully elongated and shoved so far off-center that the cold pool is practically pointed like a spear toward North America. Key features:
- The displacement vector intensifies, with the cold lobe positioned directly over Canada
- The ridge intrusion into the Arctic is now deep and aggressive
- The rotational field shows shear stress consistent with events that couple down into the jet stream
- The high-altitude flow takes on a split-like character, even without a full SSW
- The pattern becomes self-reinforcing — the longer the shape persists, the more likely the troposphere locks in
This is the kind of map that precedes multi-week cold regimes, not isolated cold shots. Once the vortex is distorted like this, the jet buckles. When the jet buckles, cold air is no longer “visiting” — it moves in and stays.
What This Means for the Next 2–4 Weeks
If the projections verify — and the consistency across the runs makes that increasingly likely — the implications are straightforward and very real:
Energy & Grid
- Heating demand sharply increases
- Nat-gas storage drawdowns accelerate
- Spot and futures volatility rise
- Regional grid strain probability increases, especially across the Midwest and Northeast
- Electricity pricing begins to reflect cold-duration risk
Infrastructure & Transport
- Freight and logistics networks slow under persistent cold and snow
- Aviation routes are disrupted by an unstable, buckling jet
- Road transport faces multi-day freeze and ice impacts
- Snowstorm potential increases as the jet meanders and stalls
Agriculture
- Soil freeze penetrates deeper into key growing regions
- Early-winter crop stress rises where ground isn’t fully protected
- Livestock operations face shelter, feed, and water-supply complications
- Plains and Midwest risk prolonged below-normal temperatures
Macro & Markets
- Energy commodities react first as heating-degree expectations shift
- Weather becomes a primary trading factor instead of background noise
- Cold-duration risk starts to reprice across gas, power, and related assets
- Winter volatility bleeds into broader macro narratives and positioning
The Pattern Nexus Interpretation
The atmosphere is signaling something bigger. We’re watching a top-down destabilization that often marks the beginning of a locked-in winter pattern. It doesn’t need a full sudden stratospheric warming event to crack the jet — a displaced, elongated vortex can do the same job.
From today’s live Dec 7 map to the Dec 12 projection, you can see the entire sequence unfolding: live instability → increased elongation → core displacement → jet-buckle setup → continental Arctic regime.
This is the pattern that matters: once the vortex loses its symmetry and anchor, the cold doesn’t just arrive — it digs in, and it sits.
The Polar Vortex Is Stretching to the Breaking Point
December 2025 Stratospheric Deformation Signals a Severe Cold Outbreak Ahead
Overview
Between December 7 and December 11, 2025, the polar vortex at 10 hPa underwent a rapid and unusually clean deformation sequence: tilt → elongation → displacement. This pattern is a textbook precursor to a major cold outbreak in the mid-latitudes. While a full vortex split has not yet occurred, the trajectory is aligned with past events that triggered severe winter weather across North America.
Below are the three snapshots—taken two days apart—that show exactly how quickly the vortex is destabilizing.
December 7: Early Signs of Stress
The first frame shows a strong vortex already tilting toward Eurasia, with wave-1 activity pushing the circulation off-center. This is the earliest sign that the vortex is losing symmetry—a warning flag for downstream winter weather.
December 9: Full Elongation Into a Horseshoe Pattern
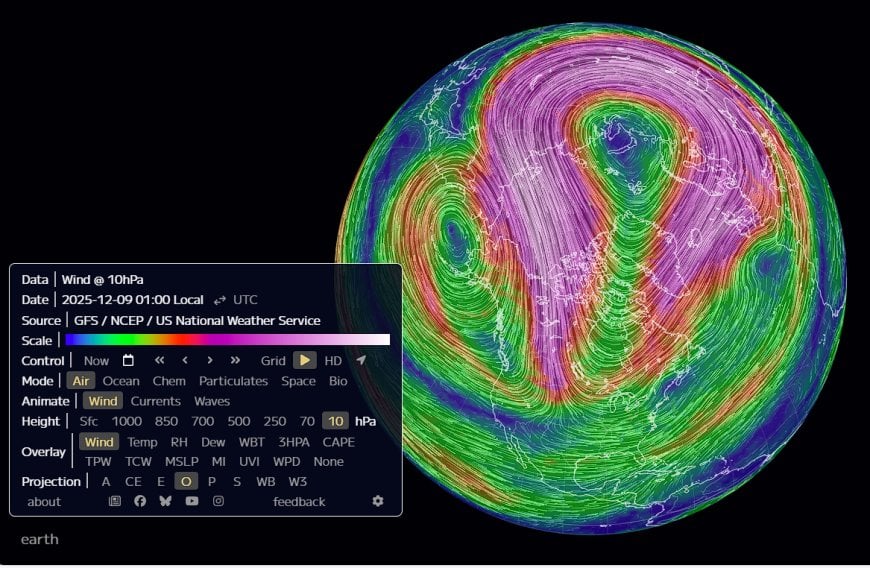
By December 9, the vortex elongates into a classic “horseshoe” or “peanut” configuration. This shape indicates strong wave-2 forcing and is historically one of the most reliable signatures that a major displacement event is forming.
This stage is crucial, because it creates a direct pathway for Arctic air to be dislodged into lower latitudes.
December 11: Displacement Toward North America
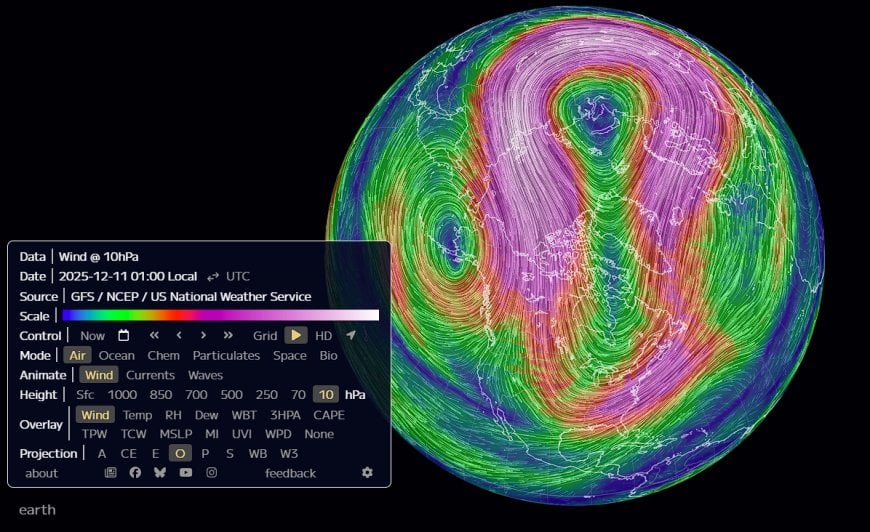
By December 11, the vortex tightens into a vertical funnel shape, with its lowest-latitude lobe positioned directly above Canada. This configuration strongly favors North America as the target zone for a major Arctic intrusion.
It is this final displacement stage that typically produces severe cold outbreaks 10–14 days later.
How Vortex Deformation Triggers Extreme Cold
The vortex doesn’t collapse all at once. The cold impacts occur when stratospheric changes propagate downward through the atmosphere—a process known as stratosphere–troposphere coupling.
- Step 1: Elongation — Warm air intrudes into the vortex, weakening symmetry.
- Step 2: Displacement — The vortex shifts off the pole, dragging cold air toward the mid-latitudes.
- Step 3: Downward Coupling — Wind anomalies descend through pressure layers (10 hPa → 50 hPa → 100 hPa → surface).
- Step 4: Jet Stream Distortion — Blocking develops, steering Arctic air southward.
This sequence is what produced the January 2014 freeze, the 2009 cold outbreak, and the February 2021 Texas deep freeze. The December 2025 pattern closely resembles those precursors.
Expected Timeline: When the Cold Hits
Based on standard propagation dynamics:
- Stratospheric deformation: Dec 7–11
- Downward propagation begins: Dec 14–18
- Surface pattern lock-in: Dec 20–24
- Main cold outbreak window: Dec 20 – Jan 5
Not every day in this period will be extreme, but the overarching pattern becomes profoundly favorable for:
- Large-scale Arctic intrusions
- Deep cold waves centered on the U.S. and Canada
- Severe winter storms if moisture interacts with displaced Arctic air
Energy Market Impact: Why a Vortex Displacement Hits Hardest in Winter 2025–2026
A polar vortex displacement in late December doesn’t just create cold weather — it reshapes the entire energy landscape. Because the vortex is already extending its lower lobe toward North America, this pattern directly intersects with the most vulnerable region in the global energy system: the U.S. residential heating corridor from the Dakotas to the Northeast. In an era of tight inventories and fragile logistics, even a single cold outbreak carries outsized macro consequences.
1. Natural Gas Demand Surge
- Heating Degree Days (HDDs) spike when Arctic air pours south.
- Residential + commercial draw accelerates faster than industrial demand can taper.
- Storage withdrawals run hotter than the five-year average.
In the past, vortex-driven cold events increased natgas demand by 10–18 Bcf/day above seasonal norms. Given the already tight supply structure of 2025, a similar spike will stress both regional pricing and storage.
2. Regional Natural Gas Price Blowouts
Extreme cold doesn’t move Henry Hub as violently as it used to — but it detonates regional markets:
- New England ISO — pipeline constraints cause sharp winter premiums.
- Minnesota, Dakotas — distribution bottlenecks create local shortages.
- Midwest hubs — basis spreads widen sharply during vortex-driven cold snaps.
If the displacement locks in for a week or two, localized energy shocks become more likely.
3. Power Grid Stress
- Gas plants must ramp harder to cover demand spikes.
- Wind output becomes unreliable during deep Arctic outbreaks.
- Spiking demand pushes peak-load grids toward emergency drawdowns.
Unlike the 2021 Texas freeze, this event is shaping up as a northern-tier strain, hitting regions with older infrastructure and limited surge capacity.
4. Diesel & Logistics Disruption
- Heating oil demand jumps in the Northeast.
- Cold thickens diesel, increasing treatment costs.
- Rail, trucking, and inland shipping slow under prolonged Arctic conditions.
Every cold outbreak is a logistics shock — but a vortex displacement magnifies it, freezing supply chains at the exact time the U.S. economy is running lean inventories.
5. Global LNG Dynamics
If the U.S. Northeast experiences severe cold while Europe is simultaneously under blocking, LNG spot prices can rise sharply. The two markets are now more interlinked than ever, and winter vortex events are often the triggers for price volatility.
Bottom Line
The December 2025 vortex deformation is not just a meteorological event — it's a potential energy market catalyst. If the displacement continues and downward coupling completes, the last ten days of December could bring a meaningful spike in natural gas demand, regional price instability, and heightened grid stress across the northern U.S. and Canada.
Pattern Nexus Lens
This vortex deformation ties directly into the broader Pattern Nexus climate-macro framework: instability at the poles translates into volatility across energy markets, agriculture, logistics, and infrastructure. The next 3–4 weeks will create conditions that ripple through diesel demand, natural gas pricing, transportation delays, and regional grid stress. Winter 2025–2026 is shaping up to be the first in years where stratospheric forcing—not just ENSO—dominates the atmospheric regime.
FAQ
Does this guarantee a polar vortex collapse?
No, but the deformation sequence is consistent with pre-collapse or major displacement events in past analogs.
Will the U.S. definitely get severe cold?
The Dec 11 displacement strongly points toward North America as the primary cold target. Europe may receive secondary impacts depending on how the blocking sets up.
Could this turn into a full Sudden Stratospheric Warming (SSW)?
Yes. A technical SSW is possible if zonal winds reverse. Current model signals show weakening but not yet full reversal.
When will we know for sure?
The next 72–120 hours of model runs will determine whether the event becomes a displacement, a split, or a full SSW.
Sources
- GFS / NCEP / US National Weather Service
- NOAA Stratospheric Monitoring
- ECMWF Atmospheric Dynamics Reports
- Historical analogs: 2009, 2014, 2018, 2021
Apa Reaksi Anda?
 Suka
0
Suka
0
 Tidak Suka
0
Tidak Suka
0
 Cinta
0
Cinta
0
 Lucu
0
Lucu
0
 Wow
0
Wow
0
 Sedih
0
Sedih
0
 Marah
0
Marah
0

Founder of Pattern Nexus. I research markets, macro, geopolitics, AI, history, ancient systems, and the patterns most people overlook. I’m also building Market Radar, a trading scanner designed to read pressure, risk, confirmation, and setup quality before chasing a move. Pattern Nexus is where I connect the dots between data, history, technology, and the bigger system playing out around us.















Komen-komen (0)