
Markets Catch Up to the Narrative: Jobs Noise, AI ROI Reality, and the Liquidity Repricing
A full cross-asset breakdown of December 16, 2025: the “noisy” delayed jobs report, a Fed that has already started cutting but won’t sprint, oil breaking below $60, and an AI complex forced to prove returns. This is not a headline day. It’s a regime day.
Published: December 16, 2025
By: Pattern Nexus
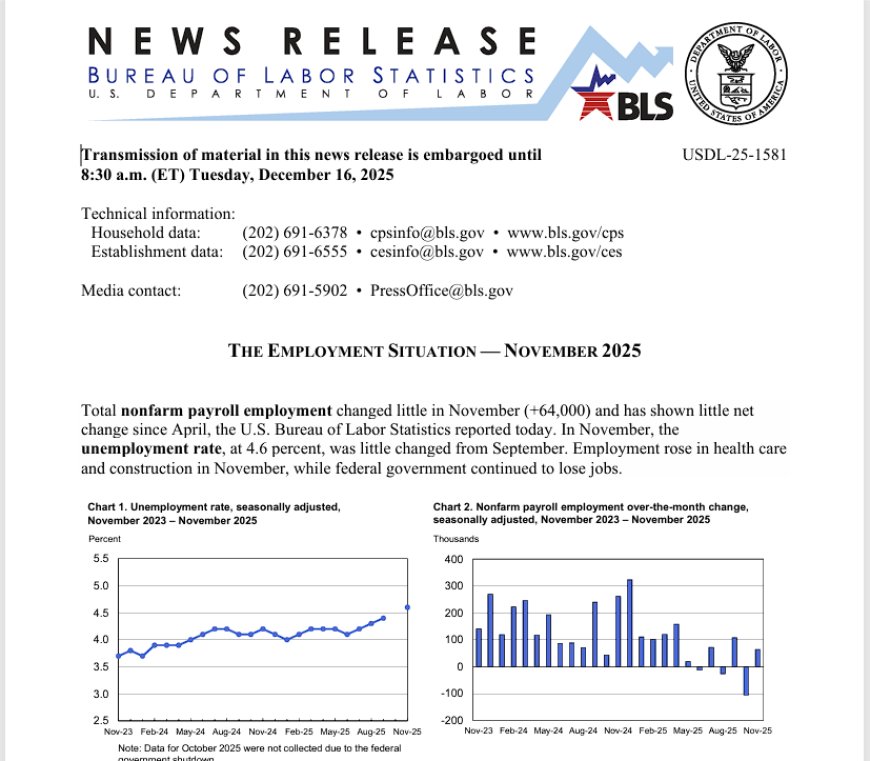
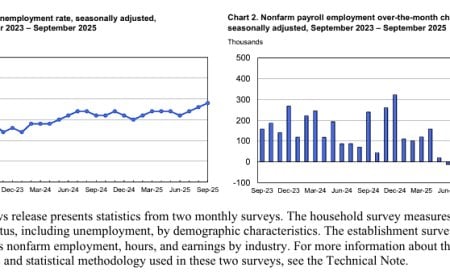
Today’s market tape is downstream of one thing: the delayed jobs report. Not because the headline number was shocking, but because the internals confirm a labor regime change. Payroll growth has basically flatlined since spring, unemployment is rising, the quality-of-work indicators are deteriorating, and the “shutdown distortion” doesn’t erase the trend. This report is noisy, but it still tells you where the system is headed.
The Headline Numbers
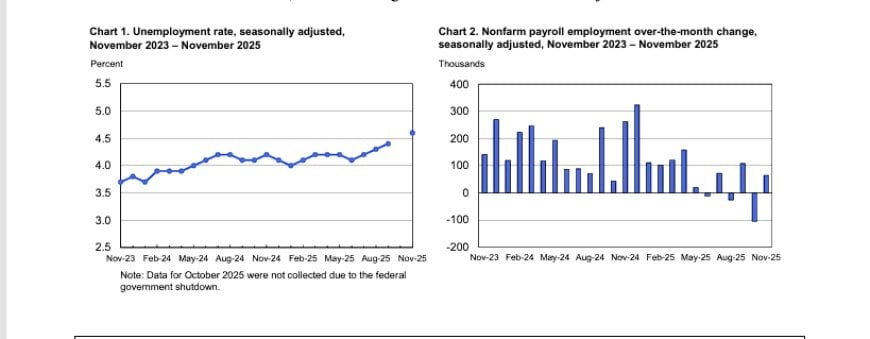
Bottom line: Two months of delayed labor data arrived at once. October was contractionary. November was marginally positive. Unemployment rose to a cycle high. The task is not to average the months—it is to identify the regime.
- October payrolls: −105,000
- November payrolls: +64,000
- Net two-month change: −41,000
- Unemployment rate: 4.6%
- Total unemployed: 7.8 million
Interpretation: Payroll growth is no longer additive. Net job creation has stalled, unemployment is drifting higher, and the labor market is transitioning from “tight” to “loosening.” That shift has macro consequences even if the month-to-month data is imperfect.
Why This Print Was “Noisy”
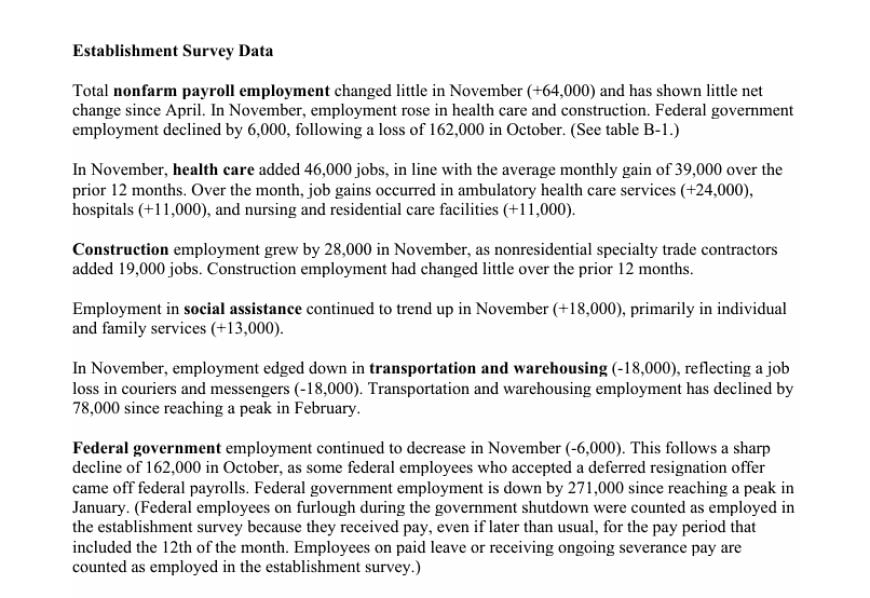
“Noisy” does not mean meaningless. It means statistical confidence bands widened while directional signals remained intact. The BLS is explicit about why this release must be interpreted carefully—and why it still matters.
1) October household survey was not collected
Due to the federal shutdown, the October household survey was not conducted and was not retroactively reconstructed. This breaks the normal monthly continuity for unemployment, participation, and labor utilization metrics.
2) November household survey response rate fell to 64.0%
Collection began late and required extended follow-up. As a result, the BLS applied modified weighting formulas and explicitly warned that standard errors are higher than usual.
Critical technical note: Because of higher variance, the unemployment rate would have needed to move 0.26 percentage points to be statistically significant, versus 0.21 in September. Direction still matters, but precision does not.
3) Establishment survey was also disrupted
October payroll data is a first publication with no revisions this month. Collection rates were ~74% for both October and November, achieved only by extending collection windows. Federal employees on paid leave or severance were counted as employed.
The point: This report is messy because regime transitions are messy. Clean prints occur mid-cycle. Turning points arrive with distortions, revisions, and argument.
Establishment Survey: Where the Jobs Actually Showed Up
November payrolls rose by 64,000, but the more important line in the release is this: payroll employment has shown little net change since April.
Regime marker: Hiring momentum has stalled. The labor engine is no longer pulling growth forward.
Sector gains
- Health care: +46,000
- Construction: +28,000
- Social assistance: +18,000
Sector losses
- Transportation & warehousing: −18,000 (−78,000 since February peak)
- Federal government: −6,000 in November; −271,000 since January peak
Structural read: Job creation is concentrated in defensive, government-adjacent, and demographic-inelastic sectors. Cyclical and logistics employment is contracting. This is not expansion behavior.
Context that matters in a shutdown-disrupted period: federal employees on paid leave or severance are counted as employed in payrolls, and furloughed employees were treated as employed if they received pay for the period including the 12th (even if later than usual). That’s why you do not treat the federal payroll line as “pure macro” in isolation. You treat it as a demand and policy shock interacting with noisy measurement.
Household Survey: Unemployment, Participation, and Labor Quality
The household survey is where labor stress appears first. That is why this report is a regime signal even with imperfect data. The BLS frames November vs September (because October household data was not collected). Directional shifts across this window are the signal.
- Unemployment rate: 4.6%
- Total unemployed: 7.8 million
- Labor force participation: 62.5%
- Employment-population ratio: 59.6%
Translation: Unemployment rose without a participation surge. This is not re-entry pressure. It is slack formation.
Underemployment spike
- Part-time for economic reasons: 5.5 million
- Change since September: +909,000
This is critical: Underemployment is rising faster than headline unemployment. That is how consumer slowdowns begin before layoffs dominate headlines. If the market is “catching up,” this is one of the primary mechanisms. You don’t need mass layoffs to weaken demand. You just need fewer full-time paychecks and more forced part-time.
Unemployment duration
- Less than 5 weeks: 2.5 million (+316,000 from September)
- 27 weeks or longer: 1.9 million (24.3% of unemployed)
Short-term unemployment rising is consistent with a labor market that is beginning to loosen at the margin. If this persists, it tends to feed into confidence and spending before it feeds into a clean unemployment spike.
Outside the labor force
- Not in labor force, want a job: 6.1 million
- Marginally attached: 1.8 million
- Discouraged workers: 651,000
These numbers don’t trend on financial television. But they tell you how much hidden slack exists outside the headline labor force definition. In weakening regimes, these pools are where stress accumulates before it becomes visible in the unemployment rate.
Demographic Labor Stress
Labor weakening is not evenly distributed. The report shows pressure in groups that historically turn before the aggregate and foreshadow broader softness if the trend persists.
- Teen unemployment: 16.3% (increased from September)
- Adult men: 4.1%
- Adult women: 4.1%
- White: 3.9%
- Black: 8.3%
- Asian: 3.6%
- Hispanic: 5.0%
Interpretation: When youth unemployment rises and disparity widens, it often signals that the labor market is losing its “tightness buffer.” That doesn’t guarantee recession. It does guarantee that the consumer is more fragile than the headline suggests.
Wages and Hours: The Quiet Confirmation
Wages and hours are where you look for confirmation. If labor is weakening, you typically see it first in slower earnings momentum, subtle hours shifts, and higher underemployment. That is exactly the combination this report delivers.
Average hourly earnings
- Average hourly earnings (private): $36.86 (+$0.05, +0.1%)
- Year-over-year: +3.5%
- Production & nonsupervisory: $31.76 (+$0.11, +0.3%)
Wage signal: Growth is cooling, not accelerating. That helps disinflation narratives, but it also reduces the “consumer resilience” cushion if job creation is not offsetting it.
Hours worked
- Average workweek (private): 34.3 hours (+0.1)
- Manufacturing workweek: 40.0 hours (little changed)
- Manufacturing overtime: 2.9 hours (unchanged)
Key point: hours did not collapse, but underemployment surged. Hours lag. Quality of work leads. If you want the early signal of demand stress, you watch the part-time-for-economic-reasons line.
Revisions and the “Stall Since April” Message
This is where the report becomes harder to dismiss. Revisions were lower, and the release explicitly frames the post-spring trend as flat.
- August revision: −22,000
- September revision: −11,000
- Net revision (Aug+Sep): −33,000
- October revisions: none this month (first publication after shutdown delay)
Why this matters: the slowdown is not “starting now.” It started months ago. Today’s report simply forced the market to price it all at once.
What This Means for the Fed
The Fed now has confirmation that labor is loosening—but not collapsing. That supports continued easing, not emergency response. The policy fight becomes pace, not direction.
The policy implication: a softening labor market supports a continued cut path, but the noisy measurement means the Fed will triangulate. Inflation prints and credit conditions will decide how fast they move, not a single disrupted jobs release.
The deeper issue is not whether unemployment is 4.6% versus 4.5%. The deeper issue is whether labor quality is deteriorating in a way that weakens consumption while the Fed is trying to control a landing. That is why the underemployment spike matters more than the headline.
Why Markets Moved the Way They Did
Markets didn’t get a clean answer. They got a regime signal with wider confidence bands. That produces a specific tape: cautious equities, bonds that hesitate between “cuts ahead” and “data uncertainty,” and leadership that gets stress-tested instead of rewarded.
- Equities: weaken as expectations reprice and cyclicality gets questioned
- Bonds: hesitate because the direction (cooling) is clear, but the precision is compromised
- Dollar: drifts on the repricing of the policy path, not on conviction of a new trend
- Oil: weakness reinforces demand doubts and tightens the earnings narrative for cyclical exposure
The link: labor softening is the transmission channel. It hits consumption, then earnings, then credit, then policy expectations. That’s the chain. Today’s report sits at the top of it.
Pattern Nexus Lens
Thesis: The system is transitioning from “tight labor, sticky inflation, narrative premium” to “loosening labor, disinflation pressure, risk premia rebuilding.” The jobs report is the pivot confirmation, even if the month-to-month precision is compromised.
Why the report matters even if it’s noisy
- Unemployment at 4.6%: direction matters more than precision
- Payroll momentum stalled since April: the hiring engine is idling
- Underemployment surge: labor quality is deteriorating ahead of the headline
- Wage growth cooling: disinflation-friendly, but consumer-limiting
- Market behavior shifts: when labor stops being a tailwind, risk premia rebuild fast
What “catching up” looks like: the market stops trading vibes and starts trading constraints. Labor is a constraint. Consumption is a constraint. Cashflow is a constraint. This report pushes all three in the same direction.
Scenarios
Scenario A: Controlled cooling (base case)
- Payroll growth remains low but positive, unemployment rises gradually
- Underemployment stabilizes rather than accelerating
- Inflation continues easing, allowing measured cuts
- Outcome: volatility persists, but credit stays orderly
Scenario B: Underemployment becomes the real recession channel
- Part-time for economic reasons stays elevated or climbs further
- Consumption weakens without a dramatic headline unemployment spike
- Earnings and guidance roll over, delinquencies drift up
- Outcome: yields can fall while equities still struggle (earnings repricing regime)
Scenario C: Data uncertainty delays conviction
- Labor prints remain statistically messy
- Markets can’t price policy with confidence and correlations stay unstable
- Outcome: chop, rotation, and repeated “false starts” in risk assets
Tell to watch: if part-time-for-economic-reasons remains elevated and short-term unemployment keeps rising, labor is weakening in a way that shows up next in earnings, spending, and delinquency data.
What I’m Watching Next
- Next jobs report (Jan 9, 2026): does “little net change since April” persist or turn negative?
- Underemployment: does 5.5M stabilize or accelerate?
- Transport/logistics employment: does the contraction spread beyond couriers?
- Credit spreads: especially consumer and high-yield sensitivity to demand stress
- Consumer delinquencies: the lagging confirmation that the labor-quality signal was real
- Wage trend: does 3.5% YoY continue cooling without a sharp employment break?
Summary: This report is not a clean datapoint. It is a regime document. The market is reacting accordingly.
FAQ
So is the economy “fine” because November was +64,000?
One small positive month does not restart the engine. The report explicitly states payroll employment has shown little net change since April. That is the signal.
Why should I care about part-time for economic reasons?
Because it’s direct evidence of labor stress and demand softness. It weakens consumption without requiring a dramatic unemployment spike.
Does the shutdown make the report useless?
It makes month-to-month precision weaker. It does not erase the direction: unemployment is higher, payroll momentum is stalled, and underemployment jumped.
What’s the cleanest takeaway?
Labor is loosening, labor quality is deteriorating first, and the system is repricing what that means for consumption, earnings, credit, and policy.
Sources
Vad är din reaktion?
 Gilla
0
Gilla
0
 Ogilla
0
Ogilla
0
 Kärlek
0
Kärlek
0
 Rolig
0
Rolig
0
 Wow
0
Wow
0
 Ledsen
0
Ledsen
0
 Arg
0
Arg
0

Founder of Pattern Nexus. I research markets, macro, geopolitics, AI, history, ancient systems, and the patterns most people overlook. I’m also building Market Radar, a trading scanner designed to read pressure, risk, confirmation, and setup quality before chasing a move. Pattern Nexus is where I connect the dots between data, history, technology, and the bigger system playing out around us.














Kommentarer (0)