
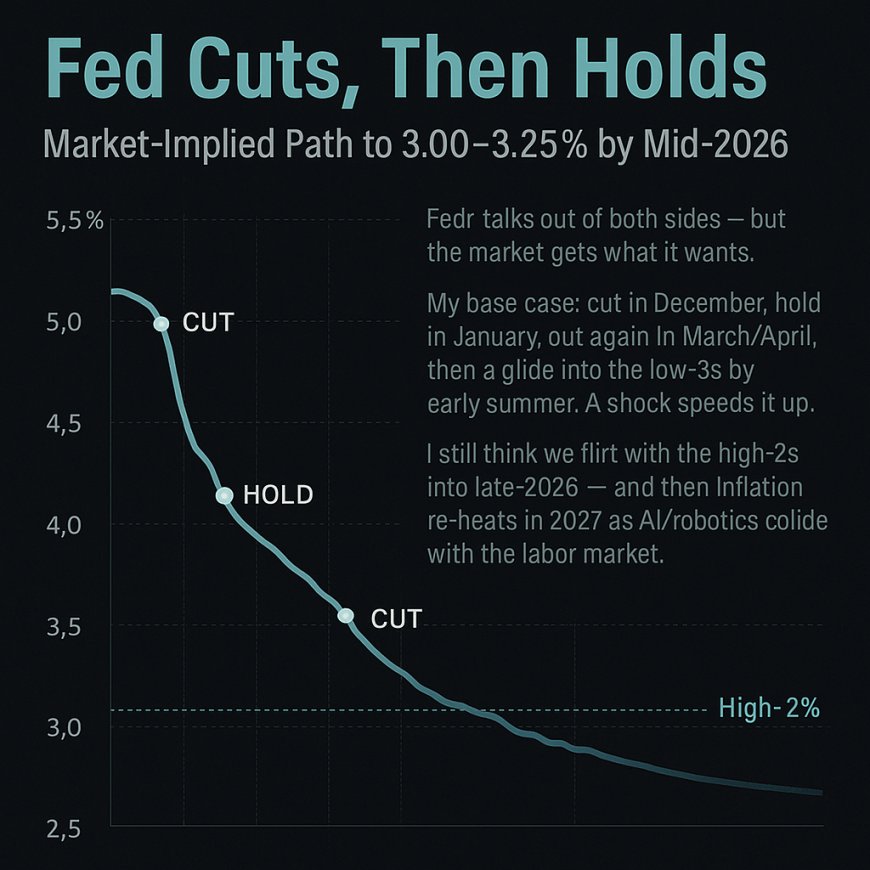
Fed Cuts, Then Holds: Market-Implied Path to 3.00–3.25% by Mid-2026
The curve and FedWatch odds point to a December cut, a brief January pause, and more easing into spring—likely landing the target range near 3.00–3.25% by mid-2026. I outline accelerants, risks, and why 2027 could see inflation re-heat as AI/robotics scale.
Fed Cuts, Then Holds: Market-Implied Path to 3.00–3.25% by Mid-2026
My base case: cut in December, hold in January, cut again in March/April, then a glide into the low-3s by early summer. A shock speeds it up. I still think we flirt with the high-2s into late-2026—and then inflation re-heats in 2027 as AI/robotics collide with the labor market.
My take: The Fed will keep talking out of both sides to manage optics. The market will still drag policy where it wants—toward lower rates through mid-2026.
Overview
Reading across the curve and implied probabilities, the most consistent path is a December 2025 cut, a January hold, then another cut in March or April. By June–July 2026, markets are comfortable with the target range drifting toward 3.00–3.25%. If growth cools and the labor market continues to normalize, my bias is a controlled slide into the high-2s by late-2026. After that, I expect a **2027 inflation re-acceleration** as AI + robotics scale—raising productivity, yes, but also stressing specific inputs (power, compute, specialized labor) that re-price the system.
None of this requires the Fed to “admit” anything today. They will continue to signal patience one week and data-dependence the next. That’s deliberate misdirection to stabilize conditions. Pricing, not the press conference, is where the truth shows up.
My Take (Plain English)
- December cut is the tell. The Fed won’t say “we’re easing,” but the first 25 bps confirms the turn.
- January pause is theater. They’ll “watch the data” to avoid looking like they’ve lost the script.
- March/April cut resumes the path. By early summer we’re living in 3.00–3.25%.
- Crisis = accelerator. Any funding, credit, or labor wobble pulls us faster toward the high-2s.
- 2027 flips the narrative. AI/robotics adoption changes wage dynamics and input costs—risking another hawkish turn.
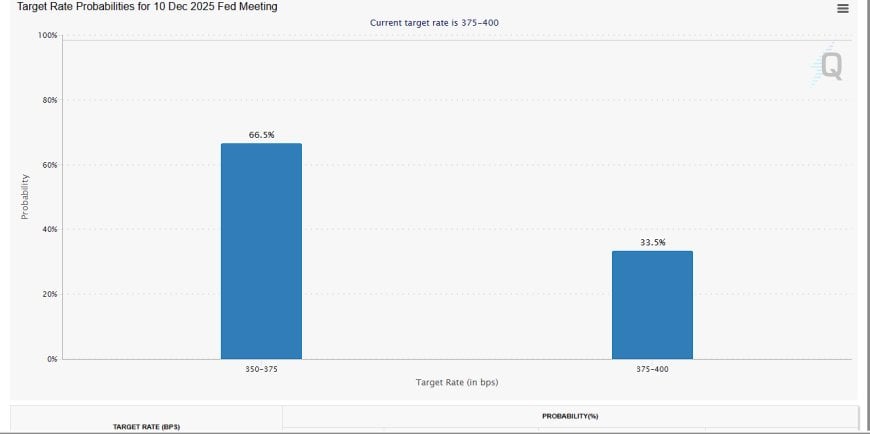
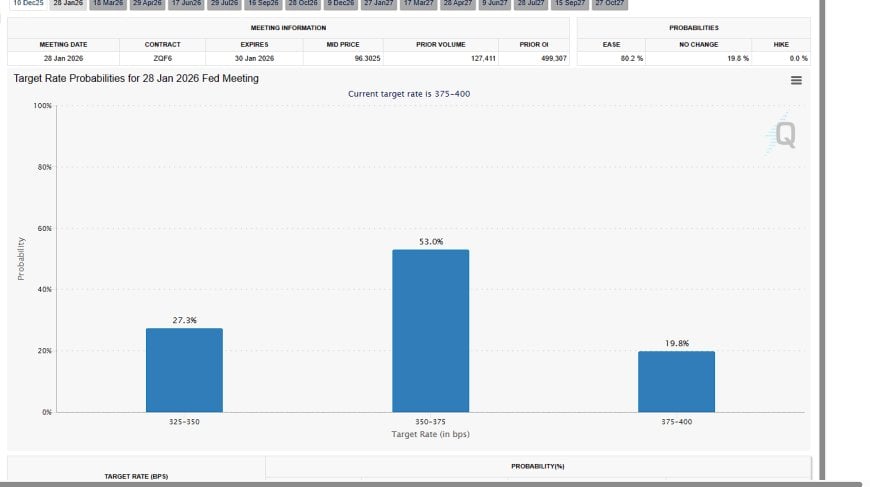
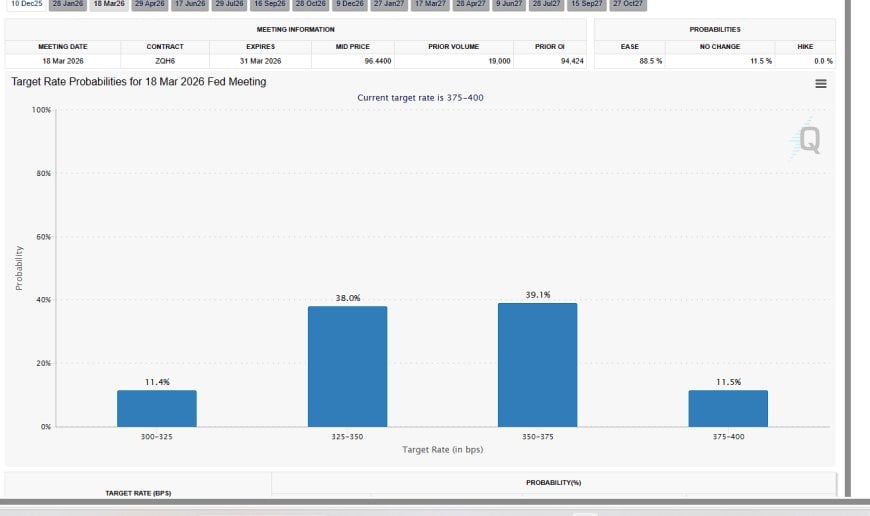
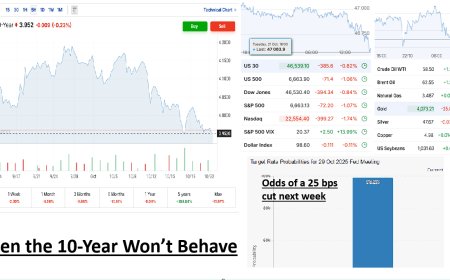
What the Market Is Pricing (FedWatch snapshots)
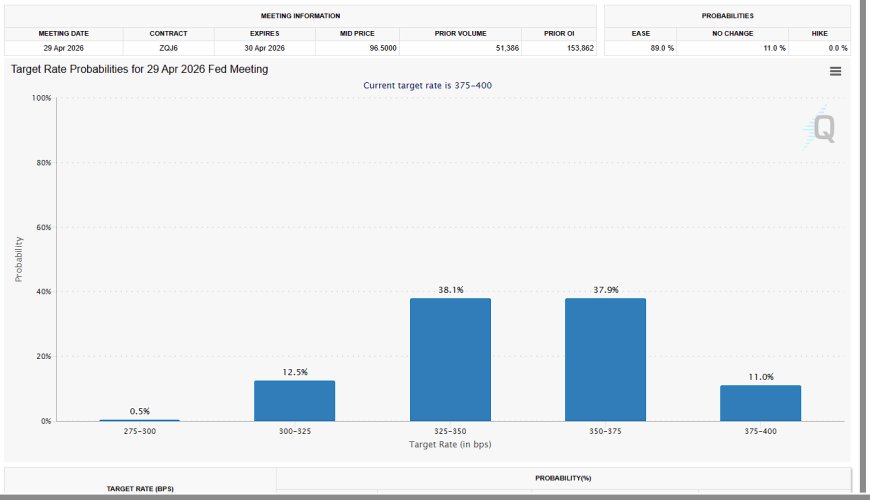
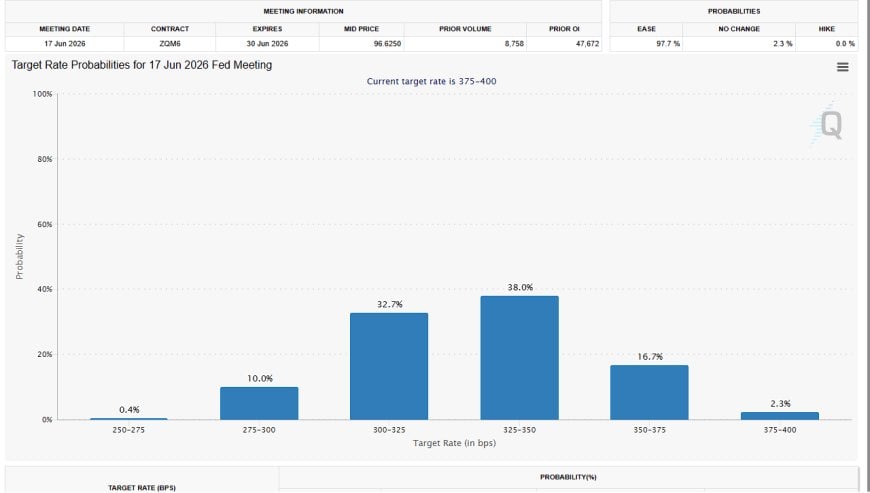
Base Path: Dec → Jul
- December 2025: −25 bps begins normalization.
- January 2026: Hold to re-anchor expectations.
- March/April 2026: −25 bps as disinflation + slack progress.
- June/July 2026: Range gravitates toward 3.00–3.25%.
- Late-2026: Drift toward the high-2s if growth cools.
- 2027: Risk of re-tightening if inflation re-accelerates on AI/robotics pressures.
What Could Accelerate Cuts
- Labor softening beyond trend (claims, revisions, rising U-6).
- Credit events (ABS/CRE cracks, funding stress, cross-currency basis widening).
- Inflation downside surprises (core services ex-housing rollover, shelter catch-down).
- Collateral/liquidity plumbing that tightens financial conditions faster than intended.
Risks to the View
- Sticky services inflation (healthcare, insurance, lagged rents) delays easing.
- Energy/supply shocks that re-ignite headline and bleed into core.
- AI-driven productivity boom that supports higher real rates for longer.
- Long policy lags keep activity resilient longer than models assume.
Macro Implications
- Bonds: Belly benefits on glide path to low-3s; long end still about term-premium + fiscal supply.
- Mortgages/Real Estate: Gradual relief aids refi-ability and cap rates; underwriting remains tight.
- Equities: Favor quality cash-flow over funding-fragile stories; cyclicals track pace of easing.
- Dollar: Eases on relative policy—watch growth differentials.
- Gold/Bitcoin: Supported by easing + structural deficits/liquidity.
- Labor/AI: 2026–2027 adoption raises productivity and sector frictions; power/compute bottlenecks matter.
Positioning Playbook (Not investment advice)
- Favor duration in the belly over barbelled risk if cut → hold → cut path plays.
- Stagger real-asset exposure (RE, infra, energy-adjacent) with debt-service sensitivity.
- Prefer balance-sheet strength & positive FCF; avoid funding-fragile narratives.
- Optionality around power/compute bottlenecks as AI buildout accelerates.
What to Watch
- Core PCE trend; supercore services.
- Labor: claims, revisions, participation, wage trackers.
- Credit: delinquencies, ABS/CRE spreads, bank lending standards.
- Liquidity: RRP/TGA dynamics, bill vs. coupon mix, funding spreads.
- Fed comms: statements, Minutes, SEP/dot plot shifts.
Where I’m Willing to Be Wrong
If services inflation refuses to budge while growth stays firm and productivity jumps, the Fed can drag this out. My line in the sand: supercore services refusing to roll alongside wage trackers stuck high. If both stay hot through mid-2026, the low-3s become a ceiling, not a waypoint.
Official Readings & Data
- FOMC Statement & Minutes (federalreserve.gov)
- Summary of Economic Projections (SEP) & Dot Plot (federalreserve.gov)
- PCE & Core PCE (bea.gov)
- Employment Situation & JOLTS (bls.gov)
- CME FedWatch implied probabilities (cmegroup.com)
Sources & Further Reading
- CME FedWatch snapshots embedded above (images 1–5).
- Federal Reserve: FOMC statements, Minutes, SEP tables.
- BEA/BLS monthly data for inflation and labor.
- Pattern Nexus prior pieces on liquidity plumbing and the AI Industrial Flywheel.
మీ ప్రతిస్పందన ఏమిటి?
 ఇష్టం
0
ఇష్టం
0
 ప్రతికూలం
0
ప్రతికూలం
0
 ప్రేమ
0
ప్రేమ
0
 కలుకలు
0
కలుకలు
0
 అబ్బా
0
అబ్బా
0
 దురద
0
దురద
0
 కోపంగా
0
కోపంగా
0

Founder of Pattern Nexus. I research markets, macro, geopolitics, AI, history, ancient systems, and the patterns most people overlook. I’m also building Market Radar, a trading scanner designed to read pressure, risk, confirmation, and setup quality before chasing a move. Pattern Nexus is where I connect the dots between data, history, technology, and the bigger system playing out around us.













కామెంట్లు (0)