
The Oil War Is Becoming a Global Economic War
An extensive Pattern Nexus reconstruction linking the Iran/Hormuz disruption with Ukrainian refinery attacks, diesel shortages, Saudi pipeline damage, U.S. and Venezuelan supply, Cuba’s grid, the dollar system, Treasury financing, Fed tightening, public energy-stock disclosures and the next conditional liquidity cycle. Includes an auditable Pattern Nexus article timeline, four sourced charts and 36 primary/reporting references.
I have been writing about Venezuela, Iran, Cuba, and the possible connection between them since before the latest war became everybody's favorite headline. This did not begin for me when Brent crossed a round number. It began with the geography of oil, the trade routes that move it, the dollar that finances it, and the governments that can deny another country access without ever occupying it.
I also mentioned another, later causal chain. I identified its outline but did not publish the whole scenario because I could not establish the necessary steps. I still cannot. The Trump–Xi meeting this week may clarify one piece, or it may change the path entirely. I am preserving the unresolved part as unresolved. I am not going to turn a theory into a recorded fact just because several earlier connections now have observable evidence behind them.
But here is what I can document. The war around Iran is disrupting Gulf oil and refined products. Ukrainian attacks are restricting parts of Russia's refining capacity. Saudi Arabia's main pipeline alternative to Hormuz has been struck. Cuba's electricity system keeps collapsing under a combination of fuel scarcity, sanctions, damaged equipment, and long-running domestic structural problems. American companies are arranging investments in Venezuela. The U.S. is the largest crude producer on the planet and remains a major importer, refiner and exporter. Energy prices have lifted inflation, the Fed has raised its policy rate, and the long end of the Treasury market has moved into the territory I had been warning about. [1][2][3][4][5][6][7]
Those are not six identical events or proof of a single centrally scripted operation. They are different events meeting inside one physical-and-financial operating system. That distinction is the premise of this entire article.
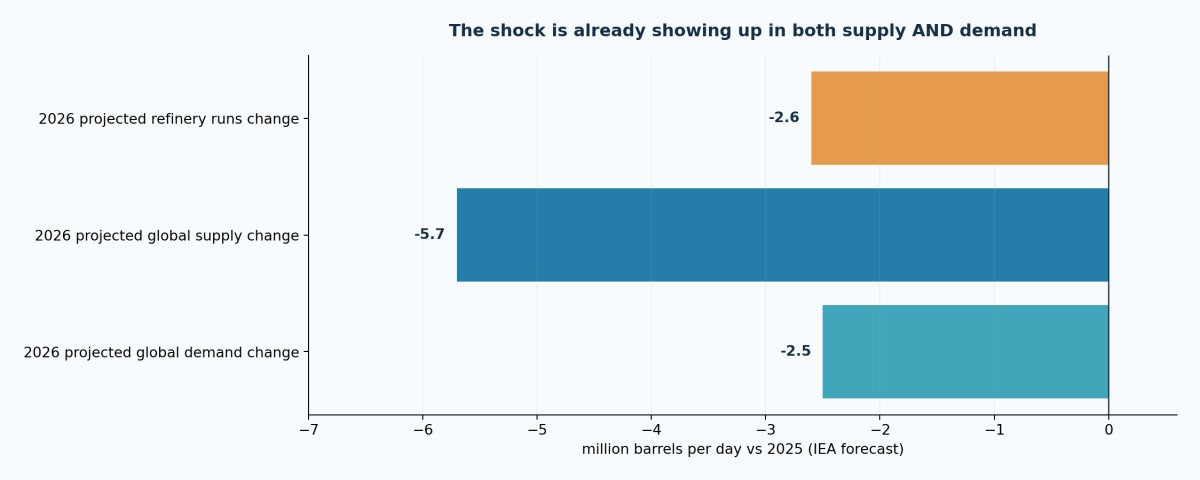
Figure 1. IEA September forecast, 2026 vs 2025. Supply, demand and refinery throughput are separate measures. These are not cumulative losses.
The question I want to follow is not simply who wins the war. It is who can still produce, refine, insure, transport, finance, and purchase the next deliverable barrel; who owns the cash flows; who pays the cost; and whether the resulting inflation and refinancing stress eventually push the financial system into another intervention cycle.
01 · PATTERN NEXUS SYSTEM MAP
1. GO BACK TO THE ORIGINAL SEQUENCE: VENEZUELA, IRAN, CUBA
I wrote about Iran's currency, protests, state repression, and external military pressure in January. The January decision-window articles watched intelligence and military options, diplomatic withdrawals, blackout conditions, airspace and force posture. They were risk indicators, not a claim that I possessed anyone's secret attack orders. By March, the conflict had moved from a possible strike to a regional energy and maritime event; in The Clock Starts at Hormuz, I made the timing and inventory argument explicit. The archive at the end links the connected research in order. [29]
Venezuela matters because of the Western Hemisphere oil geography and the refinery match. Iran matters because the Gulf is a global maritime junction and a large source of crude, products and gas. Cuba matters because fuel access is also electricity, sanitation, transport, refrigeration, and the capacity of a government to maintain basic civilian services. The chain is not that one country resembles the other militarily. The chain is the strategic use of energy access and infrastructure dependency under completely different national conditions.
The sequence has not played out quickly or cleanly. Cuba did not simply follow Iran on a fixed timetable. The Iran conflict has persisted. I would rather tell readers where the earlier framework met delays and surprises than quietly rewrite the January argument to make everything look inevitable.
02 · PATTERN NEXUS SYSTEM MAP
2. UKRAINE IS STRIKING THE CONVERSION MACHINE, NOT JUST RUSSIAN OIL
Start at the refinery. Crude in the ground is not diesel at a farm. It is not jet fuel at an airport, gasoline at a station, or a low-sulfur marine fuel loaded at a port. Those molecules have to be separated, processed, cleaned, blended, stored, and moved. Refineries are specialized industrial systems; losing a cracking or desulfurization unit can change the product slate even if some crude throughput continues.
Reuters reported on September 15 that half of Russia's leading diesel-producing refineries had cut output after Ukrainian drone strikes. That does not mean half of all Russian refining permanently vanished. It means major facilities that together make up a large share of diesel production were curtailed. Russian diesel exports to Central Asia actually increased in August under exemptions from wider export restrictions, another reminder that the actual flow ledger is more useful than absolutist headlines. [2][8]
Ukraine's military logic is to impair Russian war-supporting fuel capacity and revenues. Russia continues attacking Ukraine's energy system, whose damage the UN has documented. What interests me economically is the international spillover: a refinery unavailable to serve one market cannot simultaneously help refill another market's tanks, even when a different war caused that second shortage. [9]
The IEA's September report quantifies the overlap: combined net diesel/gasoil exports from the Gulf and Russia in August were 1.6 million barrels per day below February. Before the crisis those exporters together accounted for almost 45% of seaborne diesel/gasoil trade. The Gulf's own net diesel/gasoil exports were only 390,000 barrels a day, just over one quarter of their prewar level. [1]
This is why I am not interested in a simplistic Russia-war article stapled to an Iran-war article. The wars meet in the same middle-distillate market. A Russian refinery hit and a Gulf tanker delayed can compete for the same emergency replacement cargo. A third-country refinery can respond, but only if it has the right crude, capacity, shipping access, credit, and output yields.
The market's emergency response is revealing. The IEA says refinery margins reached record levels in the Atlantic Basin in August, led by diesel cracks, while global refinery runs remained 4.2 million barrels a day lower than a year earlier. Refiners able to process and sell the missing product can receive an unusually large margin. A country producing lots of crude but lacking the right processing equipment cannot simply substitute its way out of that shortage. [1]
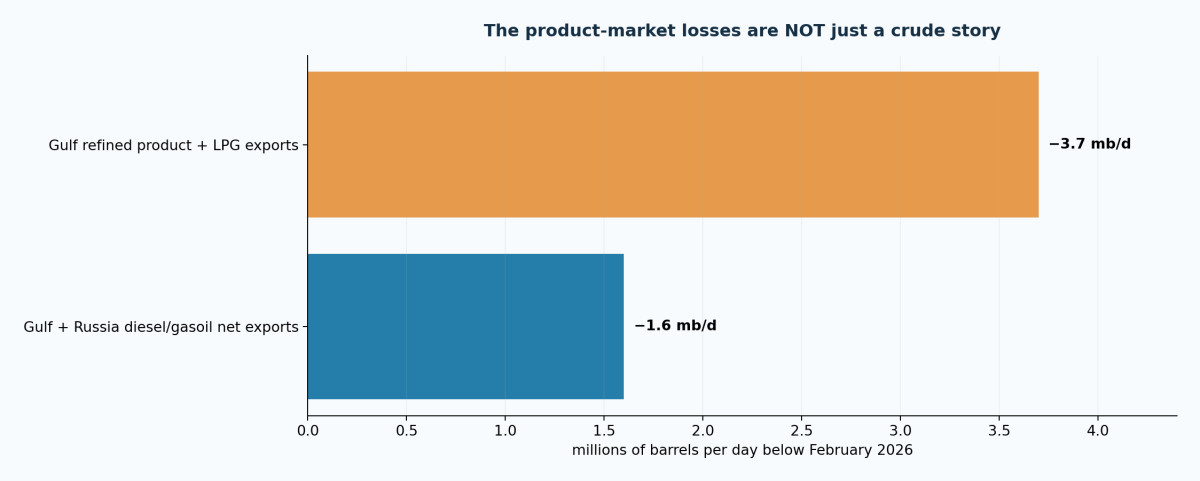
Figure 2. IEA August 2026 vs February 2026: product export losses. The two categories overlap; do not add these bars together.
Think about who needs that fuel: trucks, tractors, combines, excavators, forklifts, rail systems, mines, emergency generators, construction equipment, and industrial transport. Diesel is the cost of moving the physical economy. A shortage propagates into prices and operating decisions long before the average person learns what a refining crack spread is.
Today's Financial Times report adds an important counterweight to the theory that Washington simply welcomes every disrupted Russian barrel: Trump reportedly asked Zelenskyy to stop hitting Russian refineries because diesel scarcity was feeding American fuel costs. That is a reported diplomatic request, not proof that Ukraine agreed. It shows the conflict between American producer revenues and American consumer costs inside the same administration's incentives. [10]
03 · PATTERN NEXUS SYSTEM MAP
3. HORMUZ IS NOT A LIGHT SWITCH; IT IS A PRICE AND ACCESS SYSTEM
I have been arguing since March that the Strait of Hormuz can be legally open in some sense and commercially impaired at the same time. When ships need escorts, transfers, reroutes, enhanced war-risk insurance, extra working capital, and weeks of uncertain arrival time, a cargo's landed cost changes even if it eventually arrives.
The September IEA report estimates Gulf exports at roughly 13 million barrels a day in August, nearly half the prewar level. Gulf refined-product and LPG exports were 3.7 million barrels a day below February, a fall approaching 60%. Global observed stocks fell 95 million barrels in August, bringing the cumulative draw since February to 507 million barrels. [1]
Reuters reports ship-to-ship transfers near Oman rose from about 1.4 million barrels a day in August to 2.5 million in September, while very large tanker freight costs in some trades have exceeded $30 per barrel. That is impressive improvisation. It is not a return to normal trade costs. [11]
And then the supposedly safer alternative was hit. Three pumping stations on Saudi Arabia's East–West pipeline were damaged in the September attacks. The route had been carrying around 4–5 million barrels a day while bypassing Hormuz. Repairs and partial recovery can change week by week, but the operational point is fixed: redirecting cargoes concentrates additional dependence on the bypass. A bypass can become a target or bottleneck itself. [3]
The Red Sea and Bab el-Mandeb add another layer. A barrel moved toward a different port still needs a ship willing to call, an insurer willing to cover it, and an importer able to accept its grade. Every detour consumes tanker-days; tanker-days are a limited resource. Money can pay more for a ship. It cannot teleport a ship through an unavailable passage.
04 · PATTERN NEXUS SYSTEM MAP
4. WHY THE INVENTORY CLOCK HAS STARTED TO SHOW UP IN THE OFFICIAL DATA
In March I called it the inventory clock. In June I expanded it into the oil cushion. In August I published the longer inventory reconstruction. My point was never that the planet is literally about to consume its last crude barrel. It was that stocks buy time, and different kinds of stock buy different kinds of time.
Commercial crude is refinery feedstock. Diesel inventory is usable fuel. A government strategic barrel needs authorization and the right logistics to reach a plant. Oil on water is in transit or floating storage, not necessarily available at a local depot. A barrel that is sanctioned, badly located, wrong for the refinery, or uninsurable is not equivalent to a delivered replacement barrel.
The IEA's 507-million-barrel observed draw between February and August is large. The agency also forecasts world oil supply averaging 5.7 million barrels a day less in 2026 than in 2025, and demand averaging 2.5 million barrels a day less. Those are different year-on-year forecasts, not a subtraction from the inventory figure and not a declaration that demand is permanently lost. [1]
The U.S. emergency stock is also being used. The EIA's weekly series records 413.325 million barrels in the Strategic Petroleum Reserve on April 3 and 284.957 million on September 11. That is a reduction of about 128.4 million barrels between those observations; it is not an estimate of net global supply lost. It is stock transferred from the public emergency buffer into present availability. [12]
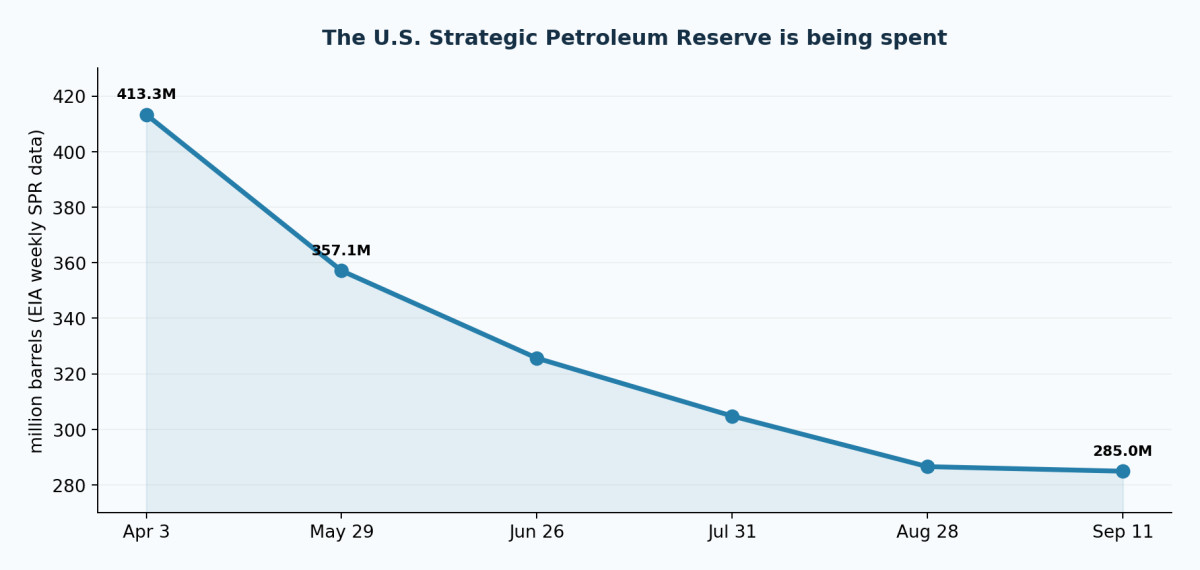
Figure 3. EIA weekly SPR ending stocks, selected dates. Roughly 128.4 million barrels drawn between April 3 and September 11, 2026.
And there is a second, less comfortable mathematical possibility: the crude price can fall before the supply network fully heals because households and firms are forced to consume less. Demand destruction is not the same thing as recovery. A recession can clear a commodity market by removing purchasing power. That was one of the central qualifications in the August inventory research, and it belongs in the September update.
The policy question is what stock is being drawn, who owns it, who receives payment for the replacement barrel, and how quickly it can be rebuilt once the current conflict subsides.
05 · PATTERN NEXUS SYSTEM MAP
5. THE UNITED STATES IS NOT THE PETRODOLLAR COUNTRY IT WAS IN THE 1970s
Now the piece that initially sounds contradictory. The United States used to be structurally more dependent on imported crude. Today it produces more crude than any other country. The EIA reports a record 13.6 million barrels per day in 2025, the eighth consecutive year the U.S. held the number-one crude-producer position. That does not mean America holds a literal world oil monopoly; Russia, Saudi Arabia, other OPEC producers, and many other countries remain major suppliers. [6]
America also still imports crude. Some American refineries, especially along the Gulf Coast, are equipped for heavier sour grades, whereas much shale output is lighter. Imports and exports can coexist rationally. The ability to produce the largest crude volume does not remove every grade, product, refinery, or shipping dependency.
The old petrodollar relationship was more than a slogan that everybody bought oil with dollars. It combined invoicing, security guarantees, surplus recycling, dollar credit, U.S. Treasury markets, and global finance. The modern system adds another direct American revenue channel: American producers and exporters sell the commodity and the refined products themselves. American firms may also sell the equipment, engineering, insurance, trading, ships, power infrastructure, and software used to expand production elsewhere.
That is the argument I developed in The Petrodollar Did Not Die. It Mutated Into the Commodity Dollar. The dollar is not legally backed by oil. Commodity production, shipping access, dollar liquidity, Treasury collateral, sanctions compliance, and financial depth can reinforce its international role without giving one government sole control of every barrel. [30]
The U.S. can gain through energy exports, sector earnings, asset demand and investment in some circumstances even as U.S. consumers face higher fuel prices. The word is distribution, not a blanket national win. A pipeline investor, an oil producer and a trucking company do not have the same exposure to a diesel shock.
06 · PATTERN NEXUS SYSTEM MAP
6. VENEZUELA IS THE WESTERN HEMISPHERE BUILDOUT, NOT INSTANT NEW SUPPLY
Look at what was announced at the end of August. The White House says the binational Venezuelan arrangement grants a private company, North American Blue Energy Partners, long-term concessions over 17 fields with about 65 billion barrels of stated proven reserves, together with U.S. governance and economic rights. The administration characterizes this as U.S. majority control. The Department of Energy then reported September agreements involving Chevron, Eni and GE Vernova to increase production and modernize electricity infrastructure. Halliburton announced additional memorandums of understanding on September 21. [5][13][14]
That is meaningful because it is a map of ownership, contractual access, service work and future infrastructure—not simply a one-day sanction waiver. But 65 billion barrels in the ground are not 65 billion barrels available this year. The IEA estimated Venezuelan August output at 1.16 million barrels a day. Years of capital investment, stable contracts, workforce recovery, diluent, electric power, pipelines, export terminals and compatible refining are needed to change the flow. [1]
A long-dated concession can have enormous option value. The owner or rights-holder may benefit from improving expectations long before annual oil throughput reaches its engineering potential. Oilfield-service firms may earn installation or restoration revenue. Gulf Coast refiners may gain access to heavy grades. Shareholders may capture some of the expected upside. Venezuelan workers and the Venezuelan treasury may receive different shares depending on the agreements and execution. That ownership map is a separate piece of the economic story from how much oil leaves a port next week.
It is also why I do not want the article to claim that disrupted Russian or Iranian exports automatically cause Venezuela's buildout. Those events can improve the strategic and commercial value of reliable Western Hemisphere supply, while the Venezuelan opportunity also depends on its own geology, legal framework and politics.
07 · PATTERN NEXUS SYSTEM MAP
7. CUBA SHOWS WHAT ENERGY ACCESS MEANS AFTER THE LIGHTS GO OUT
Cuba has not followed the fast scenario I once considered. It has followed a more prolonged energy-and-infrastructure crisis. U.S. restrictions affect fuel availability, including a May executive order expanding sanctions targeting sectors of Cuba's economy. Cuba's own aging generators, maintenance gaps, financial constraints and economic decisions are also essential to explaining repeated failures. It is a mistake to assign every blackout to one cause. [15]
On September 18, another nationwide grid collapse left millions without electricity. Associated Press reporting described the practical effects on water, transportation, food preparation and communication. Electricity is not one sector of life. It is the prerequisite underneath multiple sectors. [4]
I have described the restriction of Cuba's fuel supply as an energy blockade. That is the economic effect I am analyzing; I am not claiming that a continuous physical cordon of warships seals every Cuban port. Legal sanctions, secondary sanctions, tanker access, payment restrictions and fear of penalties can constrain commerce without a conventional naval siege.
Here is why Cuba belongs in the same piece as diesel, Iran and Russia. The components are different, but the sequence is legible: fuel access contracts; electricity becomes unreliable; pumps and refrigeration fail; businesses operate less; currency and tax receipts weaken; maintenance becomes harder to finance; and the next outage causes more damage than the last. The state then has fewer resources to stabilize the system it depends on.
There is also an ownership question in a hypothetical post-crisis opening: who provides new power plants, ports, logistics, mines, telecom, banking and fuel contracts; who receives land or concession rights; and how transparent are the terms? That is an investable transition scenario, not a confirmed transfer of Cuban assets. The human costs of prolonged infrastructure loss have to remain visible beside the hypothetical commercial gains.
08 · PATTERN NEXUS SYSTEM MAP
8. THE CHINA MEETING SITS AT THE INTERSECTION
Xi is scheduled to visit the United States September 23–25. The Chinese Foreign Ministry has confirmed the visit. We do not know its outcome on September 21. [16]
China is simultaneously a major buyer of energy, a major industrial exporter, a major holder and user of dollar assets, and a country exposed to Gulf transport and Russian supply relations. American sanctions affecting buyers of Russian or Iranian energy can change Chinese procurement costs; tariffs can change the economics of trade; purchases of U.S. oil or LNG can affect bilateral balances. None of these issues exists by itself.
The questions worth asking after the meeting are concrete. Do announced agreements lead to cargo purchases? Do sanctions or licenses change? Are LNG or crude supply commitments enforceable? Do freight routes actually reopen? Does China alter its purchases from Iran or Russia? Does the U.S. modify any commercial restriction? And how do the two sides deal with rare earths, AI infrastructure and manufacturing dependencies that interact with energy security?
I had another possible turn in the original chain. I am not presenting that turn as decided by a meeting that has not happened. This is one of the next observable checkpoints.
09 · PATTERN NEXUS SYSTEM MAP
9. FOLLOW THE MONEY: AN OIL SHOCK REDISTRIBUTES INCOME BEFORE IT DESTROYS DEMAND
This is the layer people miss when they hear me say a higher international oil price can strengthen parts of the U.S. economic machine. They interpret it as saying higher gasoline and grocery bills are good for families. That is not what the balance sheets show.
A producer sells a barrel at a higher realized price if its volumes and costs allow it. A refiner with the right inputs and access to scarce diesel may capture a larger crack spread. A pipeline may earn throughput or tariff revenue; an LNG exporter may benefit under specific contracts. A contractor can be paid to expand Venezuelan capacity. A shareholder can benefit from higher expected earnings. A government can collect royalties, taxes and fees. A household, trucker or farmer is usually on the other side of that payment.
The same shock can therefore create sector-level gains and aggregate real-income losses at once. Its net U.S. effect depends on production, imports, exports, domestic prices, wages, distribution of asset ownership and the degree of demand destruction. Oil exporters can still suffer when their fuel purchases or refinery shortages overwhelm their crude revenue. Refiners can lose when freight, grade mismatch or outages exceed the product margin. The real system is a ledger, not a team sport.
As of September 21, Reuters reported benchmark oil down on possible diplomacy and improved Saudi flows, with Brent around $101. The Financial Times reported U.S. diesel averaging $6.51 per gallon and Trump urging an end to Russian refinery strikes. A falling Brent future and an elevated retail diesel price can coexist because crude and product markets have distinct bottlenecks and adjustment times. [10][17]
The public buffer is another balance sheet in that ledger. Strategic Petroleum Reserve releases can support refiners and ease prices for consumers. They also reduce future emergency stocks. A private producer selling into a high-price market, a refinery buying government crude, a household receiving some price relief, and the Treasury bearing the cost of depleted strategic inventory are all participating in different sides of the transaction.
10 · PATTERN NEXUS SYSTEM MAP
10. YES, PUBLIC OFFICIALS OWN ENERGY ASSETS. HERE IS WHAT THE RECORD ACTUALLY SHOWS
I want this section in the article because it belongs in the ownership analysis, not because a screenshot on social media is a substitute for a filing.
CBS reviewed the President's Office of Government Ethics disclosures through the second quarter and reported that Trump's investment accounts bought and sold oil and natural-gas stocks through the fighting, ceasefire and renewed hostilities. CBS identified a particularly material disclosed transaction on April 7, the day Trump declared a ceasefire later that evening: his accounts sold $500,000–$1 million of ExxonMobil shares. CBS says ExxonMobil opened 6.5% lower the next day. These facts establish a disclosed transaction and sequence; they do not prove Trump ordered that sale, knew beforehand how the market would move, or chose diplomacy for a personal trade. [18]
There is a second and quite different measure. Democratic staff of the congressional Joint Economic Committee estimated that Trump's end-2025 oil-and-gas holdings were worth up to $45.6 million, with an estimated later value up to $61.1 million, an estimated difference of up to $15.5 million. They also identified first-quarter energy purchases of as much as $3.6 million. That is a partisan committee-staff analysis of disclosed holdings and price changes, not an audited personal trading-profit statement; the valuation does not account perfectly for subsequent transactions. [19]
The White House told CBS that independent third-party managers operate the portfolio in discretionary accounts using index-like computer models, and that Trump and his family do not direct individual investment timing. CBS also noted that some investment managers considered the broad transaction pattern consistent with tax-loss harvesting and direct indexing. That explanation must be included beside the trades. The financial exposure remains real even if an independent manager executed the orders. [18]
Members of Congress also report energy-company transactions. Public STOCK Act-derived data show Republican Senator John Boozman disclosing a July 2 Chevron purchase of $1,001–$15,000, filed August 17. A separate tracker lists Democratic Representative Gilbert Cisneros reporting February 10 EOG Resources purchases of $15,001–$50,000 and Occidental purchases of $1,001–$15,000, before the February 28 strikes. Another listing records Democratic Representative David J. Taylor selling Chevron in March, a useful reminder that the public record includes sells as well as buys. These are reported transaction bands, not measured personal gains, and third-party congressional trackers should be checked against the linked official filings for any further allegation. [20][21][36][22]
Under Senate ethics guidance, covered transactions over $1,000 generally require a periodic transaction report within 30 days after notification and no later than 45 days after the trade. That creates an unavoidable timing problem for the reader: the trade date and the date we learned about it are often different. A filing released after a strike does not mean the transaction happened after the strike. A purchase before the strike does not by itself show nonpublic foreknowledge. [23]
Corporate insiders belong in their own category, separate from elected officials. MarketWatch reported on September 21 that insiders at more than 35 energy companies had bought roughly $55 million of their companies' shares. Corporate officers buying their own companies' stock are not the same as lawmakers setting sanctions or a president directing military policy, and not every purchase is a bet on prolonged fighting. Yet the purchases illuminate how some people inside the energy business value future earnings even amid ceasefire uncertainty. [24]
What can be concluded? Policy authority, disclosed beneficial ownership, company revenues and market chronology overlap. What cannot be concluded from those observations alone? That a given official chose war, a ceasefire, a reserve release, or a sanction to enrich themselves; that all trades were profitable; or that all trades used material nonpublic information. Those are different claims requiring evidence of decision-making and information flow.
The structural question survives the limits of the evidence: the people shaping the rules can have financial exposure to the industries shaped by those rules. The households paying higher diesel bills usually do not own an offsetting portfolio of energy securities.
11 · PATTERN NEXUS SYSTEM MAP
11. THE CEASEFIRE TRADE: A LULL CAN MOVE BILLIONS WITHOUT MOVING A SINGLE WELL
A ceasefire headline can compress the oil risk premium before export capacity, refinery repairs, and tanker confidence have recovered. A renewed strike can rebuild it. Futures move first; physical deliveries, contracts and insurance take longer. That produces recurring volatility in crude, refiners, transport companies and energy equities.
This creates legitimate opportunities for hedgers and speculative traders, and potential conflicts for officials with access to sensitive diplomacy. But I will not call a sequence of price moves proof of an inside trade. We would need precise transaction timestamps, execution information, nonpublic knowledge, and evidence connecting the trader to that information. Disclosures generally contain value ranges and dates, not minute-by-minute executions or exact gains.
In fact, the April 7 sale discussed above is a sale, not an example of Trump's account buying the lull. The distinction matters. If I say officials buy at every lull, I need a date-by-date audit showing exactly that. The evidence supports a narrower and already important statement: his accounts continued making energy transactions during major war and ceasefire phases, while individual lawmakers reported purchases and sales at different dates.
12 · PATTERN NEXUS SYSTEM MAP
12. FOLLOW THE FOREIGN CAPITAL—BUT DO NOT LABEL EVERY INFLOW 'OIL MONEY'
The financial architecture beneath the energy architecture matters. Export earnings, commodity trading, insurance, investment banking, petrochemical assets, sovereign funds and dollar working capital all connect energy to cross-border financial flows. Reliable access to U.S. infrastructure can attract investment; disruption elsewhere can change relative asset demand.
Treasury International Capital data for July, released September 16, record $83.7 billion in net TIC inflows: $73.5 billion private and $10.2 billion official. Those are the Treasury's categories. They do not tell us that $83.7 billion came from displaced Russian and Iranian oil capital. July's net long-term securities figure uses another definition and cannot be silently substituted for the total. [25]
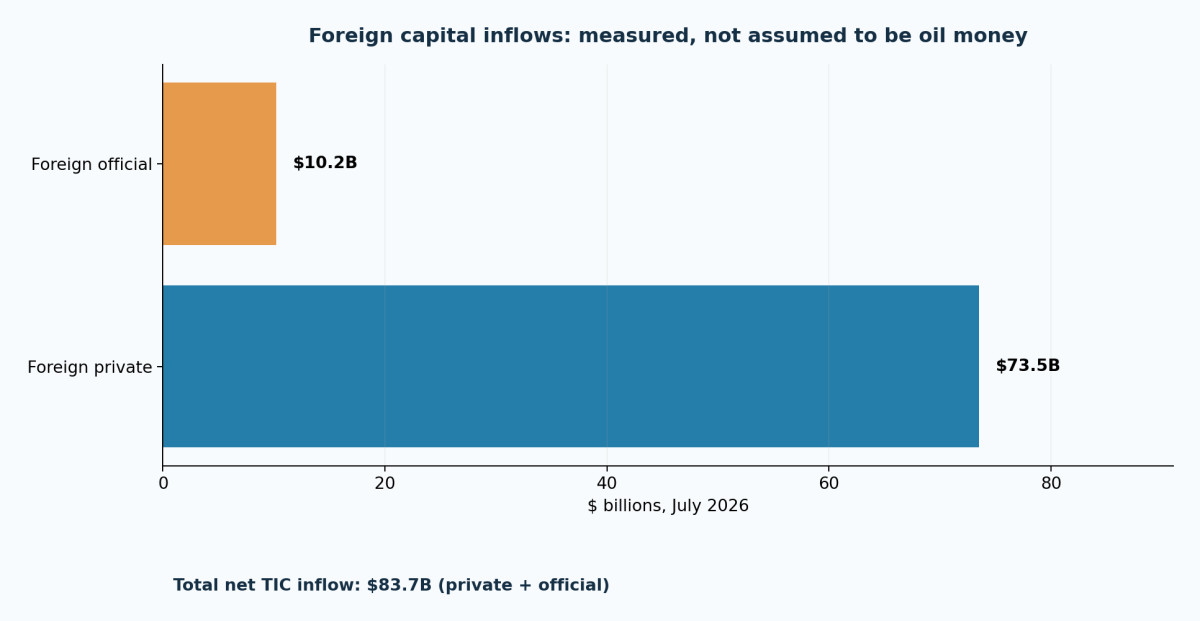
Figure 4. U.S. Treasury July 2026 TIC net inflows. Private and official sum to the reported $83.7 billion; oil attribution is not established.
To test the energy-redirection thesis properly, I would want a transaction trail: announced and completed U.S. upstream and downstream investment, LNG contracts, international purchases of U.S. energy equities, regional foreign-direct investment, foreign Treasury and bill purchases, dollar funding spreads, and the timing of sanctions and cargo rerouting. Then compare that flow with a baseline from before the conflict. Otherwise we are describing a plausible channel, not proving its magnitude.
The global dollar system can strengthen through flight-to-liquidity demand, energy settlement, and trusted collateral even if America pays more for diesel at home. It can also come under strain if foreign buyers spend reserves defending currencies or sell assets to pay for imports. A stronger dollar is frequently a symptom of global stress, not automatically proof that the real global economy is getting stronger.
13 · PATTERN NEXUS SYSTEM MAP
13. THE DEBT-INFLATION MECHANISM: HOW THE STATE CAN GAIN AND LOSE IN THE SAME SHOCK
This is where I want readers to separate a slogan from the arithmetic. With an existing nominal fixed-rate liability, a higher general price level can erode what that old promise is worth in real goods and services. If nominal GDP and tax receipts also rise, the debt-to-nominal-GDP ratio can become easier to manage than it otherwise would have been.
But the U.S. keeps issuing debt and refinancing maturing debt. If inflation expectations and term premium lift new yields, the government replaces yesterday's coupons with tomorrow's more expensive coupons. A slowdown can erode real output and reduce tax receipts even while some prices remain high. Indexed obligations and program costs respond differently. The distribution depends on the maturity ladder, holder base, tax structure, inflation surprise, and growth path.
The simplest debt identity is debt-to-GDP change ≈ (effective interest rate − nominal GDP growth) × existing debt ratio + primary deficit ratio. That is an approximation, not a forecast. Inflation can improve the denominator, while higher rollover costs deteriorate the interest-rate term. If real output weakens, nominal growth may be less favorable than the headline CPI would suggest. [31]
I have argued for years that a heavily indebted system creates incentives to tolerate some inflation rather than let every nominal balance sheet deflate simultaneously. That is an argument about financial incentives, not established evidence that the Iran war was organized to erase the U.S. national debt. The people making policy can face inconsistent objectives: cheaper consumer fuel, greater energy investment, lower Treasury interest expense, stronger sanctions, and faster inflation reduction cannot all be maximized at once.
At the September 16 FOMC meeting, the Fed raised its target to 3.75%–4.00%. August CPI was 3.4% year on year, with gasoline up 3.9% in the month. The ten-year Treasury had recently crossed 5%. [7][26][27]
That is the collision I had been drawing attention to in the CPI, QE and Fed-hike articles. If a refinery or tanker constraint is the immediate source of diesel scarcity, another 25 basis points does not repair the machinery. It can reduce domestic spending, expectations and financial demand; it can also increase cash-flow pressure. Which force dominates depends on what else is happening in the economy. The Fed's statement describes solid activity and resilient spending; I cannot erase that evidence simply because I am concerned about future vulnerability. [7]
14 · PATTERN NEXUS SYSTEM MAP
14. THE 1929–33 COMPARISON AND THE NEXT LIQUIDITY PHASE
The Federal Reserve's own history identifies serious mistakes in the Great Depression, including tightening in 1928–29, insufficient action during banking panics, and the consequences of defending gold convertibility. It does not say a single hike caused the Depression, nor does today's fiat system replicate the interwar gold standard. The historical lesson I am using is narrower: a central bank can amplify an existing fragile adjustment by misreading financial transmission and responding too slowly to failures in funding and banking. [28]
Now ask what the current system must refinance: government bills and notes, mortgages, bank liabilities, corporate debt, leveraged Treasury positions, private credit, commercial property, and an investment boom in power and AI infrastructure. Not all of these break together. The vulnerability is the possibility of a shock jumping from one into another through collateral and funding.
A higher Treasury yield reduces the market value of existing fixed-coupon bonds. Leveraged holders may need to post margin or sell assets. Dealers have limited balance-sheet capacity. Repo rates can reveal the mismatch between collateral supply and cash. Treasury auctions can clear at higher yields even when there is no classic auction 'failure'. None of these mechanics requires a theory that the Fed wants a collapse.
The Fed's September implementation note explicitly preserves authority for Treasury-bill and, if needed, short-dated Treasury purchases to maintain ample reserves. That is reserve management. It is not by itself a new large-scale program purchasing ten- and thirty-year bonds to compress duration yields. I separate the two because a government can face a long-end problem even when overnight money markets remain supported. [32]
The spectrum of possible responses runs from standing repo and ordinary reserve management, through changes in Treasury issuance and buybacks, to more direct duration purchases in a disorderly market. Yield-curve control and an Operation Twist-style maturity exchange would be different policy choices and would require separate evidence of adoption. A future policy response is conditional; as of this article, the Fed has not announced the entire ladder.
I keep coming back to the same issue: inflation makes easing the price of credit more difficult, while financial dysfunction can make liquidity support more urgent. The two policy instruments can move in apparently opposite directions. If the economy adapts, energy flows recover, spreads remain orderly and fiscal financing continues, the extreme scenario does not follow. If the product shortage and high long end persist while credit cash flows weaken, the financial channel deserves more attention.
15 · PATTERN NEXUS SYSTEM MAP
15. FOOD: THE LAGGED COST THAT ARRIVES AFTER THE WAR HEADLINE
I already published the deeper fertilizer analysis and regression work. Here is why it belongs in this causal chain. Nitrogen fertilizer depends heavily on natural gas as feedstock and energy. Diesel affects farming, processing, inland freight and shipping. Some crop-input decisions are made months before harvest. A period of expensive inputs can therefore affect the next production window even if oil futures fall before the public sees the final grocery bill.
The world is not one empty grain warehouse. Aggregate supply, household access, national foreign-exchange availability, fertilizer application, weather, import financing and humanitarian delivery are distinct variables. An import-dependent country with a weakening currency can pay both a higher dollar commodity price and a higher local-currency price for the same shipment. Food insecurity can increase without a uniform worldwide harvest collapse. That was the qualification in The Fertilizer Strait, and it remains necessary. [33]
16 · PATTERN NEXUS SYSTEM MAP
16. THE MILITARY ESCALATION LADDER IS NOT THE SAME AS A GROUND OCCUPATION
A conventional U.S. invasion and occupation of Iran would require an enormous and durable military, political, logistical and fiscal commitment. I do not treat a major occupation as the automatic next step. But prolonged air, maritime, drone and limited coastal operations can still damage the industrial and commercial systems on which recovery depends.
The political debate ahead of November's midterms may affect incentives around diplomacy, fuel prices and use of force, but it does not establish a secret post-election bipartisan war schedule. The reported Trump request to curb Russian refinery strikes is itself a reminder that the U.S. administration confronts near-term domestic price pressure. At the same time, congressional action on Russia and Iran sanctions demonstrates that some forms of sustained pressure have support across party lines; that is a documented policy position, not proof that legislators agreed on military escalation. [10][34]
A conflict can persist without territory being occupied. Degrading military logistics, port access, coastal defenses, bridges, electricity, water, rail or industrial components creates enormous rebuilding needs. But civilian infrastructure is not a generic category of lawful targets: international humanitarian law requires distinctions, precautions and proportionality assessments, and the civilian consequences can be catastrophic. The UN's reporting on attacks against Ukraine's energy network documents how power damage spreads into water, heat, health care and displacement. The humanitarian cost belongs inside any serious infrastructure-war scenario. [9]
In The Lincoln Trap, I examined the military version of the inventory clock: aircraft, munitions, ships, maintenance schedules, sailors, interceptors and the consequences of consuming assets in one theater while another theater also needs readiness. The cost of maintaining a campaign is not measured only in the number of bombs available today. [35]
17 · PATTERN NEXUS SYSTEM MAP
17. HERE IS THE CAUSAL CHAIN I AM WATCHING NOW
Physical disruption: Russian refining losses, Gulf product losses, Saudi bypass damage, uncertain tanker access.
Price and inventory response: higher delivered fuel costs, wider product spreads, emergency releases, shrinking stocks, reroutes and demand destruction.
Sectoral wealth transfer: producers, selected refiners, infrastructure owners, contractors, traders and financial asset holders may gain; consumers and fuel-intensive firms absorb costs.
Geographic realignment: North American supply and Venezuelan development may become more valuable; China and other importers adjust contracts and routes; Cuba remains heavily constrained.
Monetary transmission: higher inflation and financing costs coexist; the Fed's policy-rate response interacts with Treasury term premium, mortgage rates and debt refinancing.
Financial stress or adaptation: the system either repairs and replenishes, or tighter cash flow and market plumbing produce demand for new liquidity measures.
That is a conditional sequence. I am not publishing a certainty that it ends in a depression, world war, regime change, or QE. My earlier ten-year Treasury call was not perfectly timed; I specifically acknowledged how the war and term premium changed the path. I will not turn the outcome of one thesis into a retroactive claim that every asset call landed.
18 · PATTERN NEXUS SYSTEM MAP
18. WHAT WOULD CHANGE THE ANALYSIS
Several months of sustained Gulf exports, normal insurance and freight costs, restored Saudi pipeline operations, Russian diesel recovery, replenished onshore commercial products, and a halt in SPR depletion would weaken the physical-shortage thesis. Meaningful output from signed Venezuelan agreements would strengthen the new-supply thesis, but a press release alone cannot do it. A China agreement would matter when its terms change actual cargoes and finance.
A fall in long yields alongside orderly repo, tighter credit spreads and sustained real growth would weaken the stronger liquidity-break scenario. More failed refinancing, impaired dealers, disorderly collateral calls, and persistent inflation would strengthen it. Actual, dated transaction reports would strengthen the political-ownership audit; screenshots that confuse filing and trade dates would not.
The September 21 information set includes encouraging adaptation as well as sustained stress. Saudi exports have partly recovered through workarounds, Russia increased some exempt regional diesel deliveries, and markets repriced diplomatic possibilities. The IEA still describes a material refined-product shortage and very large inventory draw. Both observations belong in the same article. [1][8][11][17]
19 · PATTERN NEXUS SYSTEM MAP
FINAL THOUGHT: THE SAME MACHINE CAN ENRICH ONE BALANCE SHEET AND DAMAGE ANOTHER
I did not start writing about Venezuela, Iran, Cuba and the dollar because I thought every event would line up neatly on a calendar. I was trying to describe where energy, sanctions, trade routes, industrial power and monetary dependence intersect.
The intersection is visible now in oil fields, refining units, pump stations, tankers, fuel bills, public stock disclosures, Treasury markets and international investment agreements. One person calls this a military story. Another calls it a commodity story. Another sees inflation. Another sees Washington, Tehran, Moscow, Kyiv, Beijing or Havana. They are looking at different parts of a coupled system.
The hardest part is accepting that the same event can generate real profits for some American owners, worsen living standards for other Americans, drain a public reserve, strain a foreign importer, support parts of the dollar system, and make the Federal Reserve's job more difficult—all at the same time.
That is not a contradiction. It is the accounting.
Watch the barrels. Watch the conversion equipment. Watch the owners. Watch the financing. And do not mistake a temporary lull in the headlines for a rebuilt physical system.
PATTERN NEXUS RESEARCH ARCHIVE
Previous research: read the chain in order
These earlier Pattern Nexus posts are the research behind this article. Direct article links are used where confirmed; for a few older pages the link opens the site search for the titled report rather than an unverified slug. The summaries are reading guidance, not claims that each prediction landed.
- January 2 · Middle East fragmentation — Iran sits within overlapping Gulf, Red Sea and regional instability.
- January 3 · Iran at the Edge — Currency stress, protests, internal pressure and external signaling.
- January 12–14 · Iran decision window — Military options, blackout, airspace and diplomatic/military warning indicators.
- February 28–March 5 · Iran War, Day by Day — Opening strikes, retaliation and the move into regional energy and port systems.
- March · Hormuz and tanker disruptions — Functional commercial closure, escorts, insurance and product-market risk.
- March 2 · Oil, gold and volatility — Why an immediate market move cannot settle the underlying supply risk.
- March 25 · Military force posture — Readiness, deployment categories, and the limits of treating preparation as an attack order.
- March 26 · The Hormuz theory — Limited coastal pressure and escalation paths distinguished from full occupation.
- March 28 · Liquidity Needs a Cover — How shocks can widen the political operating room for financial support.
- March 29 · The Clock Starts at Hormuz — The corridor and inventory clock: uneven timing across importers and industries.
- March 31 · The system shows its seams — The monthly synthesis of conflict, energy, AI, markets and monetary strain.
- April 11 · Research update — The difficulty of tracing conflict, inflation and liquidity without losing the causal chain.
- May 1 · UAE, dollar and swap lines — Gulf energy relationships, dollar funding and short-term Treasury-market architecture.
- May 7 · The Headline Is Late — Retrospective linking the Iran shock to earlier trade, dollar and liquidity research.
- May 14 · War economy — Industrial capacity, munitions replacement and the limits of financial purchasing power.
- June 1 · The Oil Cushion Is Breaking — Commercial and strategic stocks, refinery constraints, shipping and liquidity.
- June · Gold and the 10-year retrospective — Gold thesis and the acknowledged timing/level miss on the 10-year as war changed yields.
- June 19 · Peak Insanity scenario — Explicitly speculative interactions across war, markets and global risks.
- July 9 · Iran War, bridge and network isolation — Why alternate northern/continental routes matter beside southern maritime access.
- July 18 · The Petrodollar Mutated — Energy production, exports, sanctions and financial channels reinforce the dollar role.
- July 24 · The system repriced in 30 days — How the war joins tariffs, energy, AI capital expenditure and liquidity pressure.
- July 24 · The Fertilizer Strait — Fuel and fertilizer shocks become a delayed food access and crop-input problem.
- July 24 · Global shipping and Red Sea — The second chokepoint and delivery costs surrounding Gulf disruption.
- August 2 · Oil Inventory War Machine — Full buffer reconstruction, SPR and empirical inventory-price analysis.
- August 14 · The Lincoln Trap — Readiness, munitions, carrier operating time and Pacific opportunity costs.
- August 18 · Price of a Fractured World — Geopolitical term-premium discussion at the long end of Treasuries.
- August 20 · Public forecast audit — Retrospective distinguishing the Hormuz thesis from the 10-year Treasury miss.
- August 22 · One System, Many Flags — Munitions, sanctions, energy and interconnected military theaters.
- September 11 · CPI and hike trigger — Energy CPI, rate expectations and the long-end refinancing trap.
- September 17 · Fed Just Hiked Into a 5% 10-Year — The September rate hike, collateral, reserve operations and liquidity response paths.
Sources and research notes
Source references are numbered in order of their research file. Official releases are used for what agencies actually announced; committee-minority estimates and journalists’ reports are attributed. Market forecasts are forecasts. Political disclosures report transaction ranges, not exact executions or profits.
- IEA — September 2026 Oil Market Report (11 September) ↑
- Reuters — Russia’s diesel-producing refineries cut output after strikes (15 September) ↑
- Reuters — Three Saudi East–West pipeline pumping stations damaged (17 September) ↑
- Associated Press — Cuba hit by another nationwide blackout (19 September) ↑
- White House — U.S.–Venezuela oil agreement fact sheet (31 August) ↑
- EIA — United States produced more crude than any country in 2025 ↑
- Federal Reserve — September 16 FOMC statement ↑
- Reuters — Russian diesel deliveries to Central Asia in August (21 September) ↑
- UN Human Rights Monitoring Mission — Attacks on Ukrainian energy infrastructure (29 June) ↑
- Financial Times — Trump presses Zelenskyy to stop strikes on Russian refineries (21 September) ↑
- Reuters — Hormuz ship-to-ship transfers and freight (21 September) ↑
- EIA — Weekly U.S. ending stocks of crude oil in SPR ↑
- DOE — Venezuela energy agreements with Chevron, Eni, GE Vernova (2 September) ↑
- Reuters — Halliburton Venezuela energy MOUs (21 September) ↑
- Federal Register — Executive Order 14404 Cuba sanctions ↑
- Chinese Foreign Ministry — Xi visit September 23–25 (21 September) ↑
- Reuters — Oil falls on possible U.S.–Iran diplomacy and Saudi exports (21 September) ↑
- CBS — Trump oil and gas stock trades during Iran war (29 August) ↑
- Joint Economic Committee Democratic staff — estimated value of Trump energy holdings (24 August) ↑
- Quiver Quantitative — Chevron congressional trade ledger (Boozman, July 2) ↑
- Quiver Quantitative — EOG congressional transaction ledger ↑
- Congressional Trader — 2026 Chevron filings and sale/purchase examples ↑
- U.S. Senate Ethics — periodic transaction reporting rules ↑
- MarketWatch — Energy-company insider buying during Iran war (21 September) ↑
- U.S. Treasury — Treasury International Capital data for July 2026 ↑
- BLS — August 2026 CPI release (11 September) ↑
- Reuters — 10-year U.S. Treasury yield reaches 5% (14 September) ↑
- Federal Reserve History — The Great Depression ↑
- Pattern Nexus — Iran archive: search?q=iran ↑
- Pattern Nexus — The Petrodollar Did Not Die; It Mutated ↑
- Pattern Nexus — The Deficit Never Ends: debt to 2040 baseline and references ↑
- Federal Reserve — Implementation Note (16 September) ↑
- Pattern Nexus — The Fertilizer Strait ↑
- Financial Times — U.S. House passes Russian oil and Iran sanctions bill (17 September) ↑
- Pattern Nexus — The Lincoln Trap ↑
- Quiver Quantitative — Occidental congressional transaction ledger ↑
Research cutoff: September 21, 2026. Figures have heterogeneous observation dates. No invented precision, undisclosed trading-gain estimates or speculative claim about official motives is treated as an established fact. This article is independent research and is not investment advice.
మీ ప్రతిస్పందన ఏమిటి?
 ఇష్టం
0
ఇష్టం
0
 ప్రతికూలం
0
ప్రతికూలం
0
 ప్రేమ
0
ప్రేమ
0
 కలుకలు
0
కలుకలు
0
 అబ్బా
0
అబ్బా
0
 దురద
0
దురద
0
 కోపంగా
0
కోపంగా
0

Founder of Pattern Nexus. I research markets, macro, geopolitics, AI, history, ancient systems, and the patterns most people overlook. I’m also building Market Radar, a trading scanner designed to read pressure, risk, confirmation, and setup quality before chasing a move. Pattern Nexus is where I connect the dots between data, history, technology, and the bigger system playing out around us.



కామెంట్లు (0)