
The Fertilizer Strait: Why the 2027 Food Shock May Already Be Forming
Fertilizer prices, Persian Gulf disruption, a potentially historic El Niño, expanding drought risks, weak currencies, and fragile food-import systems are converging ahead of the 2027 growing cycle. This extended Pattern Nexus analysis examines more than 50 years of population, grain production, fertilizer, energy, climate, inventory, and food-price data to determine whether the world is approaching another major food-inflation and political-instability cycle.
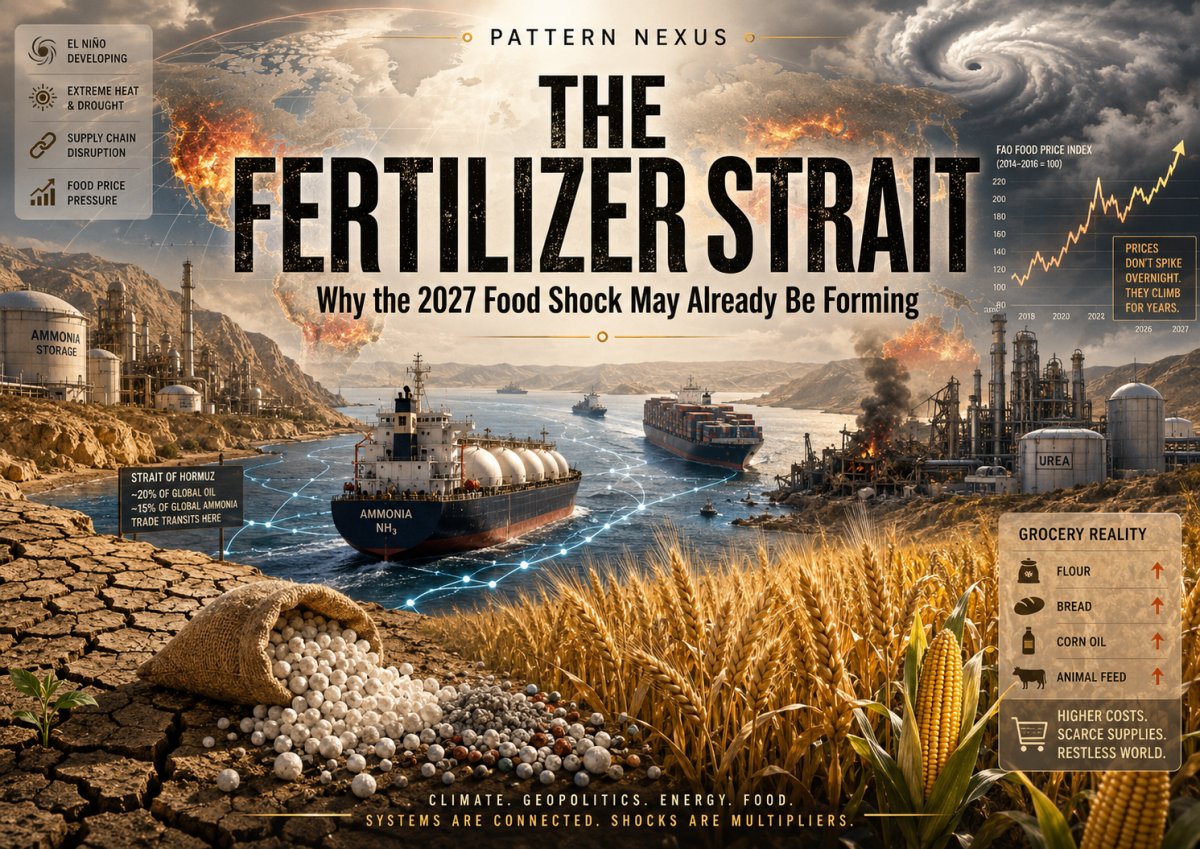
- The food system is not currently empty. FAO still projects the 2026 cereal harvest to be the second largest on record, with global stocks equal to roughly 32% of annual use.[1]
- The input system is under real stress. Urea briefly moved above $850 per metric ton in April after Persian Gulf production and shipping disruptions exposed the concentration of nitrogen fertilizer supply.[5]
- The immediate risk is cost transmission and regional scarcity, not a confirmed worldwide grain shortage.
- A potentially very strong El Niño is developing. NOAA assigns a 97% probability that it persists into early spring 2027 and a high probability that it becomes very strong late in 2026.[3]
- El Niño does not reduce every global crop. Its impact is geographically uneven, but simultaneous losses in major exporting regions can become systemic when trade restrictions and war are added.[13]
- The political danger is concentrated in import-dependent states. Weak currencies, high debt, food subsidies, conflict, unemployment, and distrust can turn a commodity-price shock into unrest.
- The central Pattern Nexus conclusion: the world may continue producing enough total food while an expanding share of humanity loses the ability to purchase or import it.
The world is not out of food.
That is not the same as saying the world food system is safe.
Global grain inventories remain substantial. The 2026 cereal harvest is still projected to be the second highest ever recorded. On paper, there is enough food moving through the system to prevent an immediate worldwide physical shortage.[1]
But the world food system is not one warehouse. It is an interconnected structure of natural gas, ammonia, urea, phosphate, sulfur, potash, seed, water, credit, insurance, currencies, ports, railroads, export laws, subsidies, soil moisture, and political stability.
Several of those structures are now being stressed at the same time.
Core distinction: Global food availability and local food access are not the same measurement. Food can exist in aggregate while becoming unaffordable, inaccessible, or politically unavailable to the people who need it.
Input shock
Natural gas, ammonia, urea, phosphate, or sulfur remain expensive or unavailable during application windows.
Weather shock
El Niño, heat, drought, flood, or water scarcity reduces yields in multiple important exporting regions.
Trade shock
Governments restrict exports, accumulate reserves, or prioritize domestic markets.
Financial shock
Importers lose purchasing power through currency depreciation, debt stress, higher freight, or expensive energy.
Political shock
Subsidies become unaffordable, governments ration supply, and public anger collides with unemployment and weak legitimacy.
01 · EVIDENCE BOUNDARY
The Thesis Is Directionally Correct, but the Causal Chain Must Be Precise
The strongest defensible conclusion is not that global famine is inevitable in 2027. The evidence supports a materially elevated probability of renewed food inflation, localized crop failures, worsening acute hunger, and political instability in fragile import-dependent countries.
The systemic crisis case requires several separate failures to synchronize:
The likely path is therefore not a single straight line from El Niño to famine. It is a transmission network:
Energy disruption → fertilizer inflation → reduced application or acreage → lower expected yields → reserve accumulation and export controls → freight and currency pressure → subsidy stress → unaffordable food → unrest.
| Claim | Assessment | Evidence-based conclusion |
|---|---|---|
| Fertilizer is expensive and vulnerable | Strong | Nitrogen, ammonia, sulfur, and phosphate exposure is real; potash is comparatively better supplied. |
| Fertilizer plants are being destroyed worldwide | Overstated | Verified damage, shutdowns, and logistical disruption are concentrated in strategic production corridors. The evidence does not establish generalized worldwide destruction. |
| El Niño will reduce global yields | Mixed | It raises regional failure risk, but global crop effects vary by crop and geography. |
| U.S. drought will expand throughout 2027 | Possible | Current drought and soil-moisture stress elevate risk, but a deterministic national 2027 forecast is not justified yet. |
| Middle Eastern drought will expand everywhere | Too broad | Syria and several Near Eastern areas are highly stressed, while parts of North Africa and the Near East have recently improved. |
| Another Arab Spring is possible | Plausible tail risk | Food inflation can accelerate unrest when combined with unemployment, subsidy cuts, corruption, repression, and weak state legitimacy. |
| Worldwide famine is the base case | Not supported | Famine danger is concentrated in conflict zones and fragile states; aggregate global stocks remain substantial. |
02 · STRUCTURAL CONTEXT
The 50-Year Productivity Escape
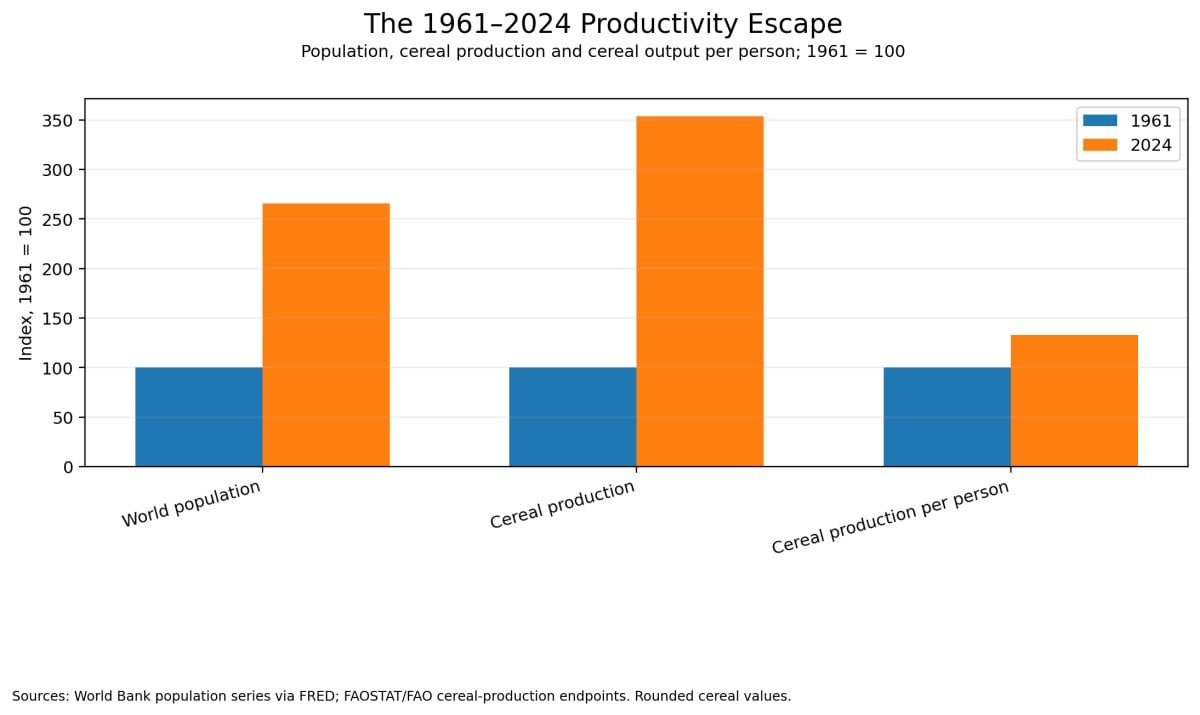
In the early 1960s, the world contained a little more than 3 billion people and produced roughly 876 million metric tons of cereals. By 2024, population had exceeded 8.2 billion, and global cereal production had moved above 3 billion tons. Production increased faster than population.[15][16]
Using rounded values, cereal output increased from approximately 0.28 metric tons per person in 1961 to roughly 0.36 tons per person in the current system—an increase of around one-quarter in per-capita output despite the addition of more than 5 billion people.
| Period | World population | Global cereal production | Approx. cereal output per person |
|---|---|---|---|
| 1961 | ~3.1 billion | ~876 million tonnes | ~0.28 tonnes |
| 2025 | More than 8.2 billion | ~3.043 billion tonnes | ~0.37 tonnes |
| 2026 forecast | ~8.3 billion | ~2.983 billion tonnes | ~0.36 tonnes |
This improvement did not happen because the food system became simpler. It happened because it became more industrialized and interconnected:
- Synthetic nitrogen fertilizer converted natural gas into higher yields.
- Phosphate and potash replaced nutrients removed from soil.
- Irrigation reduced dependence on local rainfall.
- Mechanization increased the land area one worker could manage.
- Plant genetics increased yield potential and standardized crops.
- Global trade moved food from surplus regions to deficit regions.
- Finance allowed farmers, processors, governments, and traders to bridge seasonal timing gaps.
Modern abundance is therefore not separate from the industrial system. It is an output of the industrial system.
That system has also been fighting a structural climatic drag. Research published in Nature Climate Change estimated that anthropogenic climate change reduced the cumulative growth of global agricultural total-factor productivity by approximately 21% since 1961—roughly equivalent to losing seven years of productivity growth. Estimated losses were larger in warmer regions, including Africa and Latin America.[12]
The contradiction: Humanity has produced more food per person while becoming more dependent on concentrated energy, fertilizer, water, logistics, credit, and political coordination. The system is more productive and, in some ways, more fragile at the same time.
03 · GLOBAL INVENTORIES
The Current Grain Balance Sheet Does Not Yet Show a Worldwide Physical Shortage
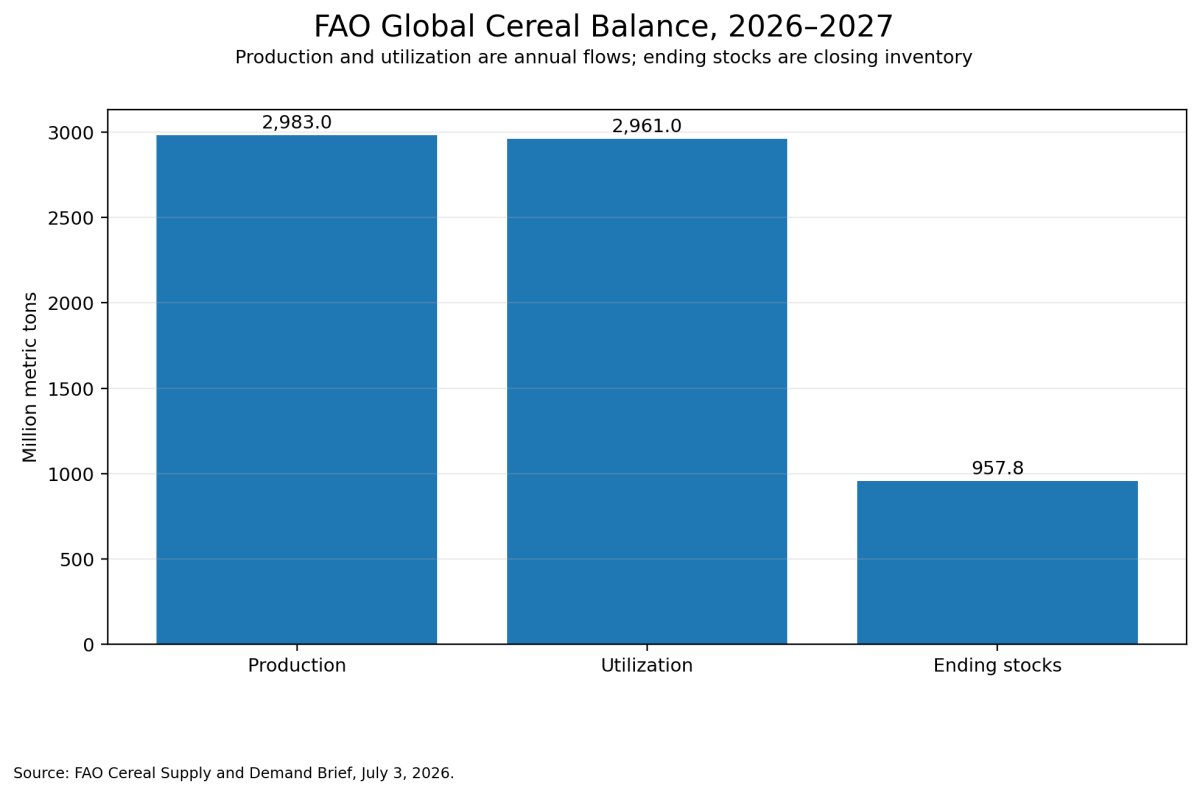
FAO's July 2026 balance sheet is the strongest evidence against an immediate global-collapse narrative. The forecast still shows nearly 3 billion metric tons of cereal production, high ending stocks, and a stocks-to-use ratio near one-third of annual consumption.[1]
| Indicator | 2026–2027 outlook | Interpretation |
|---|---|---|
| Global cereal production | ~2.983 billion tonnes | Down from the 2025 record, but still the second-highest crop on record. |
| Global wheat production | ~806.5 million tonnes | Approximately 4.3% below the prior year. |
| Global cereal utilization | ~2.961 billion tonnes | Consumption remains high but below projected production. |
| Ending cereal stocks | ~957.8 million tonnes | A large aggregate buffer. |
| Stocks-to-use ratio | ~32.0% | Not characteristic of an immediate global physical shortage. |
| Global cereal trade | ~507.6 million tonnes | Only a fraction of total production crosses borders, making export behavior critical. |
June price data also showed that the panic had not yet become a self-sustaining food-price spiral. FAO's Food Price Index was 130.3 in June 2026, down slightly from May, while international wheat prices declined approximately 4.4% during the month.[2]
World Bank monthly commodity data provided another counterpoint: after the wartime surge, its fertilizer price measure fell sharply in June, while energy and food commodity indexes also declined.[7]
These facts matter. A credible analysis must distinguish a dangerous setup from an already-completed crisis.
Why the aggregate buffer can still mislead
Global stocks are not evenly owned or freely available. A ton of wheat held inside a strategic reserve in a large state does not automatically protect a low-income importer. Governments can withhold reserves, increase precautionary purchases, restrict exports, or prioritize domestic prices.
The market-clearing question is not merely how much grain exists. It is how much grain is available to trade at a price importers can finance.
The world can possess adequate physical food while the tradable, financeable supply becomes insufficient for the number of countries that need it.
04 · INPUT CHOKEPOINT
The Fertilizer Shock Is the Strongest Confirmed Part of the Thesis
Food inflation often begins far from the field. It can begin in a natural-gas market, an ammonia plant, a sulfur terminal, a shipping-insurance contract, or a maritime chokepoint.
Nitrogen fertilizer is manufactured through an energy-intensive process. Natural gas is both an input and a fuel source. Phosphate fertilizer requires mined phosphate rock, ammonia, and sulfur. Each material must arrive at the right plant, at the right price, before the farmer's application window closes.
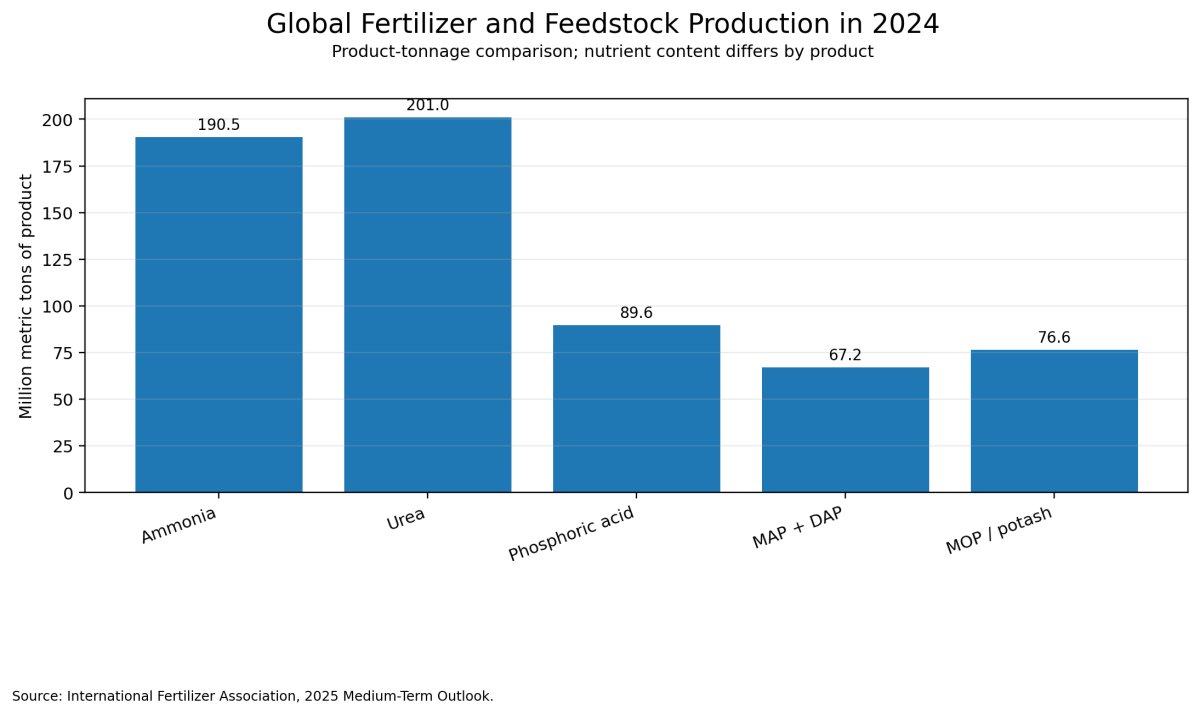
The Persian Gulf disruption exposed how concentrated this structure is. International Fertilizer Association estimates indicate that countries upstream of the Strait of Hormuz account for roughly 23% of global ammonia trade, 34% of urea trade, 49% of sulfur trade, and 18% of traded MAP and DAP phosphate fertilizer.[8]
| Input moving through the exposed corridor | Approximate share of global trade | Agricultural role |
|---|---|---|
| Ammonia | 23% | Foundation feedstock for nitrogen fertilizers and an input for phosphate production. |
| Urea | 34% | The world's most heavily traded nitrogen fertilizer. |
| Sulfur | 49% | Required to manufacture sulfuric acid used in phosphate processing. |
| MAP and DAP | 18% | Concentrated phosphate fertilizers used across major crop systems. |
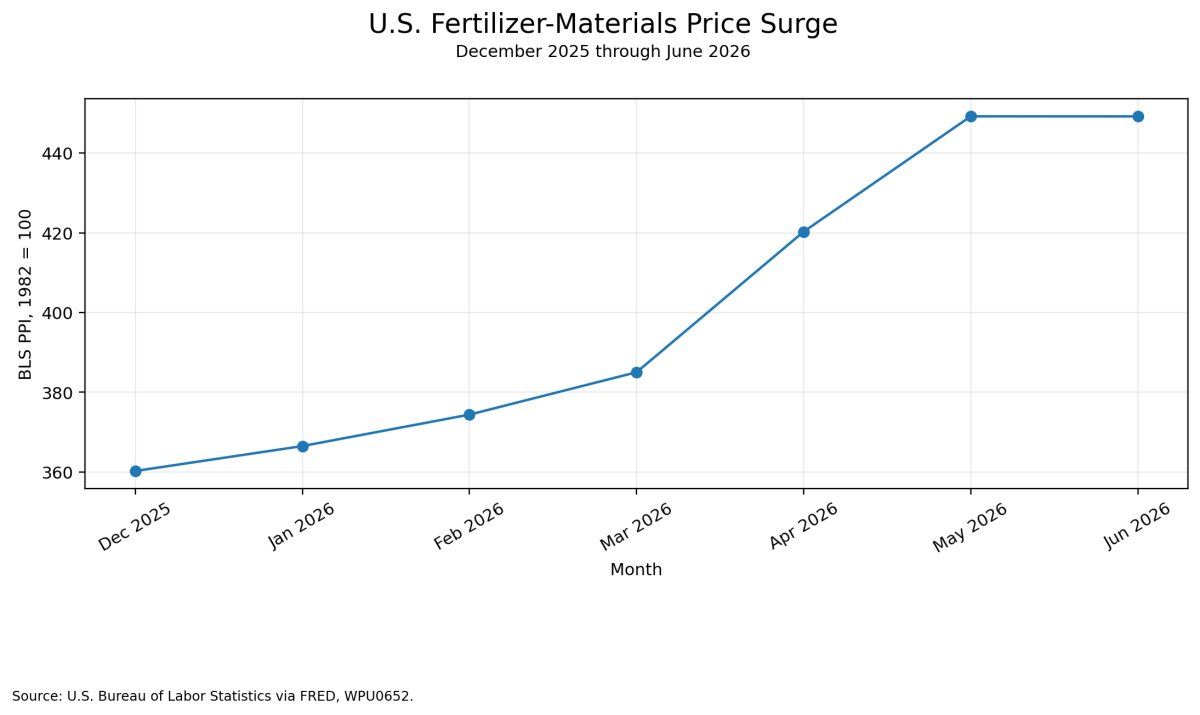
World Bank reporting showed urea briefly exceeding $850 per metric ton in April 2026, approximately 80% above February levels and the highest price since 2022. The broader fertilizer index rose rapidly as Gulf production, shipping, energy, and input availability tightened.[5]
The important correction is that this was not an equal shortage in every nutrient category. Potash supply was comparatively comfortable because Canada, Russia, Belarus, and other producers are less directly dependent on the Gulf. Nitrogen and phosphate were the more exposed systems.[5][6]
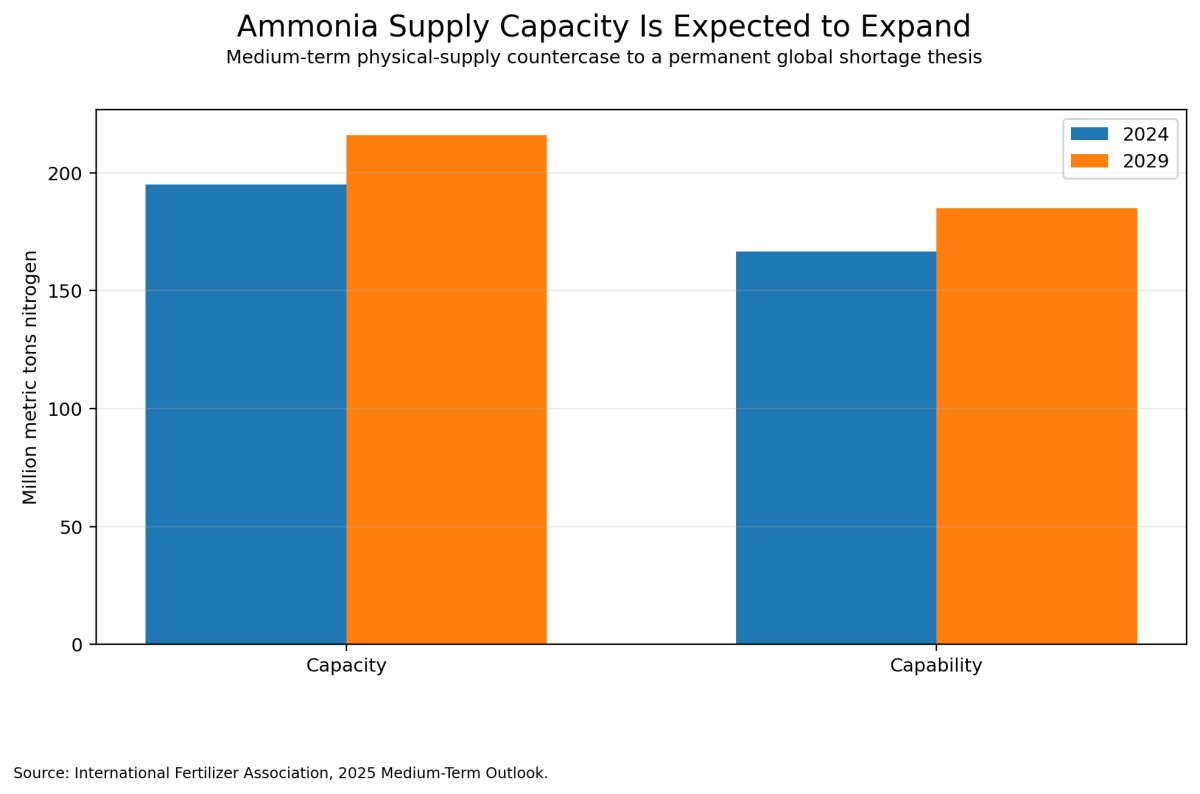
Prices also retreated after the initial spike. Trade was rerouted, demand adjusted, and other suppliers responded. That demonstrates adaptive capacity. It does not remove the structural concentration.
The real warning: A price spike can recede before the agricultural consequences appear. What matters is whether farmers purchased and applied enough fertilizer during the required window—not whether the spot price looked calmer months later.
05 · TIME DELAY
The Harvest Shock Can Arrive After the Fertilizer Market Appears to Stabilize
Commodity markets react immediately. Biological systems do not.
A fertilizer shock moves through a sequence:
- Input prices rise. Producers, importers, and distributors face higher replacement costs.
- Credit tightens. Farmers need more working capital to purchase the same physical quantity.
- Demand is rationed. Smaller or more indebted farmers reduce application, delay purchases, plant fewer acres, or switch crops.
- The crop is planted. The field may initially look normal.
- Nutrient limitations appear. Yield potential declines during vegetative growth, flowering, or grain filling.
- Production estimates fall. Futures markets reprice before the final harvest is measured.
- Governments respond. Importers buy earlier; exporters consider restrictions; reserves become politically valuable.
- Consumers receive the shock. Retail food prices rise after processing, transport, currency, and subsidy channels transmit it.
This sequence can take months or more than one crop cycle. It can also be interrupted. Favorable weather can partially offset lower fertilizer application. Higher crop prices can encourage acreage expansion. Governments can subsidize inputs. Producers outside the disrupted region can increase output.
But the lag means the absence of immediate empty shelves is not evidence that the input shock was harmless.
The fertilizer market can normalize in June while the yield loss does not become visible until September—and the political price is not paid until the following winter.
06 · CLIMATE MULTIPLIER
El Niño Does Not Need to Destroy Every Crop to Destabilize the Market
NOAA's July 2026 ENSO assessment gives El Niño a 97% probability of continuing into early spring 2027. It also assigns a high probability that the event becomes very strong during late 2026.[3]
A very strong event is not a universal crop-failure switch. NOAA explicitly warns that even strong ENSO events do not produce the textbook effect in every location.
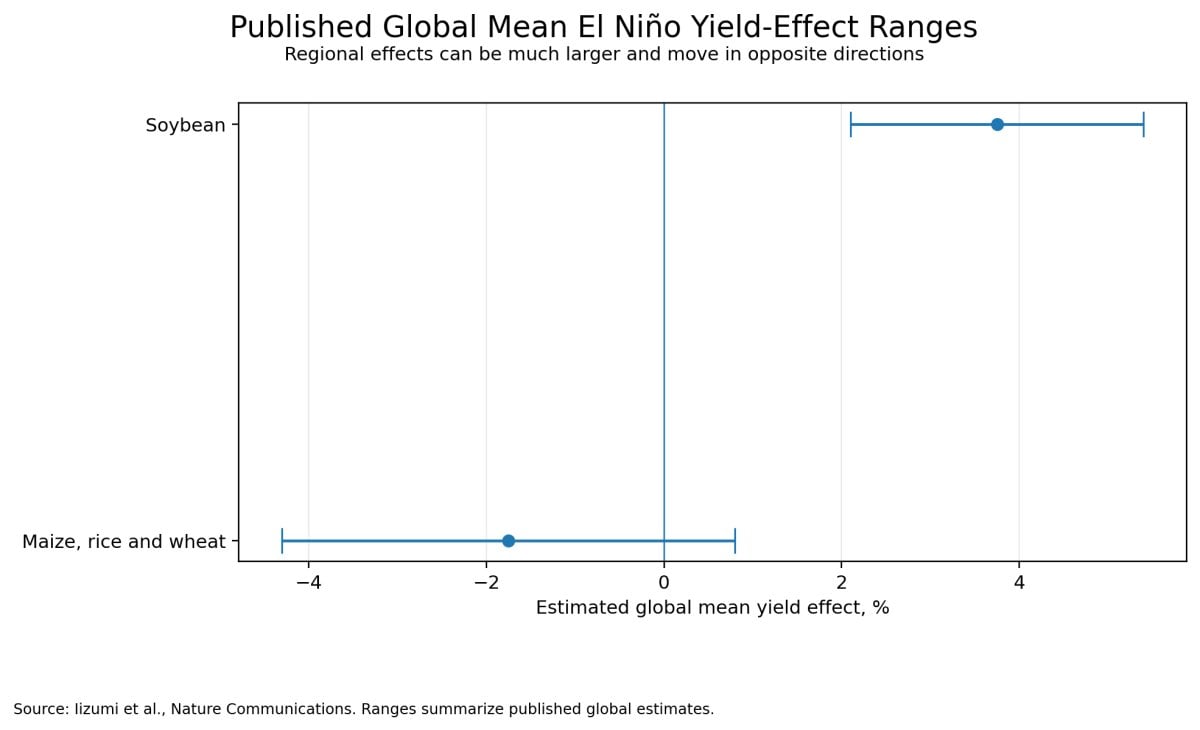
Global crop research reaches the same conclusion. Historical El Niño effects on worldwide maize, rice, and wheat yields ranged from approximately negative 4.3% to positive 0.8%, while global soybean yields were estimated to increase between roughly 2.1% and 5.4%.[13]
That result can appear reassuring until the geography is considered.
Global averages allow a favorable crop in one country to offset a severe failure in another. The market impact depends on whether the loss occurs in:
- A major exporter rather than an isolated subsistence region.
- A crop with limited substitutability.
- A country likely to impose export controls.
- A region already suffering fertilizer or water constraints.
- Several breadbaskets at the same time.
Research on climate variability also shows that weather explains approximately 32% to 39% of year-to-year yield variability in the portions of global maize, rice, wheat, and soybean production with statistically significant climate responses. That represents tens of millions of tons of annual fluctuation.[14]
The synchrony problem
A single crop failure is normally absorbed by inventories, substitution, trade, and production elsewhere. A synchronized event is different.
If El Niño reduces Australian wheat, stresses southern African maize, changes Asian rice conditions, and overlaps with U.S. heat or drought while nitrogen prices remain high, the global average can deteriorate rapidly. The physical loss is then magnified by behavior: reserve accumulation, speculative buying, export controls, and emergency tenders.
El Niño is a multiplier, not the entire model. Its systemic importance depends on which exporters are hit, how fertilizer was applied, and how governments react.
07 · U.S. PRODUCTION RISK
The United States Is Carrying Real Drought Risk, but 2027 Is Not Yet Determined
By early July 2026, almost half of the contiguous United States was in drought. The pattern was broad enough to matter for pasture, livestock, spring wheat, maize, soybeans, water availability, and rural operating costs.[4]
The United States matters disproportionately because it is not merely a producer. It is a large exporter, reserve holder, feed producer, biofuel producer, and price-setting futures market.
A drought-driven U.S. crop loss can therefore move through several channels:
- Higher maize and soybean prices.
- Higher livestock-feed costs.
- Higher meat, dairy, and egg costs with a delay.
- Higher ethanol and vegetable-oil competition.
- Greater import demand from countries that normally buy U.S. grain.
- Lower reserve accumulation and greater futures volatility.
But the claim that drought will simply expand across the entire United States throughout 2027 exceeds the current forecasting horizon. El Niño can improve cool-season precipitation odds in parts of the southern United States while producing different conditions in northern or western regions. Winter snowfall, spring soil moisture, planting weather, summer heat, and the location of rainfall will determine the outcome.
The correct statement is narrower:
The United States is entering the 2026–2027 transition with meaningful antecedent dryness and heat risk. That raises the probability of crop stress, but it does not make a national 2027 harvest failure inevitable.
08 · IMPORT DEPENDENCE
The Middle East and North Africa Are Not One Drought Map
Syria demonstrates the extreme case. FAO estimated its 2025 cereal crop at roughly 1.2 million tonnes—more than 60% below average—after rainfall during the main season fell more than 50% below the long-term norm. Wheat import requirements for the following marketing year were projected near 3 million tonnes, approximately 70% above the five-year average.[10]
That is a genuine food-security shock.
But the entire region is not moving in the same direction. Crop conditions improved in portions of North Africa, Türkiye, Iran, and other areas after earlier drought, while some 2026 regional production measures recovered toward or above recent averages.[11]
This geographic variation does not remove the political risk because agricultural production is only one component of regional food security. Many states import wheat, cooking oil, animal feed, fuel, fertilizer, equipment, and transport services. Even a country with a reasonable local harvest can suffer inflation if its currency weakens or import costs rise.
The vulnerability stack
Large shares of staple demand must be purchased internationally.
A global price increase becomes a much larger local-currency increase.
Governments must absorb the shock or transfer it to households.
Production, transport, storage, and household incomes are already damaged.
Groundwater depletion and rainfall volatility limit domestic substitution.
Economic pain is interpreted through corruption, inequality, and legitimacy.
The most exposed country is not necessarily the country with the worst rainfall. It may be the country with the weakest combination of foreign exchange, fiscal capacity, logistics, and political legitimacy.
09 · HUMAN CONSEQUENCES
Food Inflation Becomes Famine Through Conflict and Becomes Unrest Through Institutions
Famine is not simply a high grain price. It is an extreme outcome involving severe food-consumption gaps, acute malnutrition, and elevated mortality. It usually requires the breakdown of access, distribution, income, security, or humanitarian response in addition to poor production.
That is why modern famine danger is concentrated in conflict-affected areas rather than evenly distributed across every country exposed to the same commodity market.
WFP's 2026 conflict scenario estimated that prolonged Middle Eastern escalation and an oil shock could push almost 45 million additional people into acute food insecurity, on top of approximately 318 million people already facing acute hunger.[9]
Those figures should not be translated into a claim that 45 million people will enter famine. Acute food insecurity includes multiple levels of severity. But the estimate shows how quickly a war-and-price shock can expand humanitarian need.
Could this produce another Arab Spring?
Food inflation can contribute to political instability, but it is rarely sufficient by itself. Research on the Arab Spring identifies food insecurity and price pressure as meaningful factors while also emphasizing unemployment, repression, inequality, governance failures, and political exclusion. The broader literature remains mixed on whether food prices independently cause unrest.[22]
A more accurate model is:
Food does not create every grievance. It converts abstract grievances into a daily household calculation.
When bread, cooking oil, transport, rent, and electricity rise together, the legitimacy of the state becomes measurable at the kitchen table.
Governments then face a narrowing set of choices:
- Expand subsidies and worsen fiscal deficits.
- Reduce subsidies and transfer the shock directly to households.
- Spend foreign-exchange reserves to preserve imports.
- Devalue the currency and increase imported inflation.
- Ration supply.
- Borrow at higher cost.
- Restrict exports.
- Suppress the political response.
None of these choices removes the loss. Each moves it to a different part of the system.
10 · HISTORICAL ANALOGS
What the 1970s, 2008, 2011, and 2022 Actually Teach
Historical food crises are not identical, but they reveal recurring mechanisms.
| Episode | Primary pressures | System lesson |
|---|---|---|
| 1972–1974 | Poor harvests, energy shock, fertilizer costs, Soviet grain purchases, low stocks, trade intervention | Energy, inventories, and state purchasing can turn crop losses into a global price regime. |
| 2007–2008 | Low stocks, oil, biofuel demand, currency changes, export restrictions, panic buying | Government behavior can amplify the original shortage. Research attributes a large portion of rice and wheat price escalation to export restrictions.[20] |
| 2010–2011 | Weather losses, Russian grain restrictions, high commodity prices, household stress | Food inflation can coincide with political unrest but operates through existing social and institutional fractures.[21][22] |
| 2021–2022 | Natural gas, fertilizer, pandemic logistics, Ukraine war, grain and oilseed disruption | Food, energy, and fertilizer are one connected commodity complex rather than separate markets.[23][24] |
| 2026–2027 risk | Gulf war, fertilizer concentration, El Niño, drought, debt, weak currencies, humanitarian funding pressure | The danger is the synchronization of several known mechanisms inside a more indebted and politically fragmented world. |
The export-restriction multiplier
During the 2008 crisis, World Bank analysis estimated that export restrictions accounted for roughly 45% of the international rice-price increase and approximately 30% of the wheat-price increase.[20]
This matters because the 2027 crisis does not require a proportional physical loss. A 5% production loss can produce a much larger price response if governments remove additional supply from the tradable market.
Markets price the marginal ton, not the average ton.
11 · DATA MODEL
Regression Analysis: Energy and Fertilizer Explain a Large Share of Annual Food-Price Movement
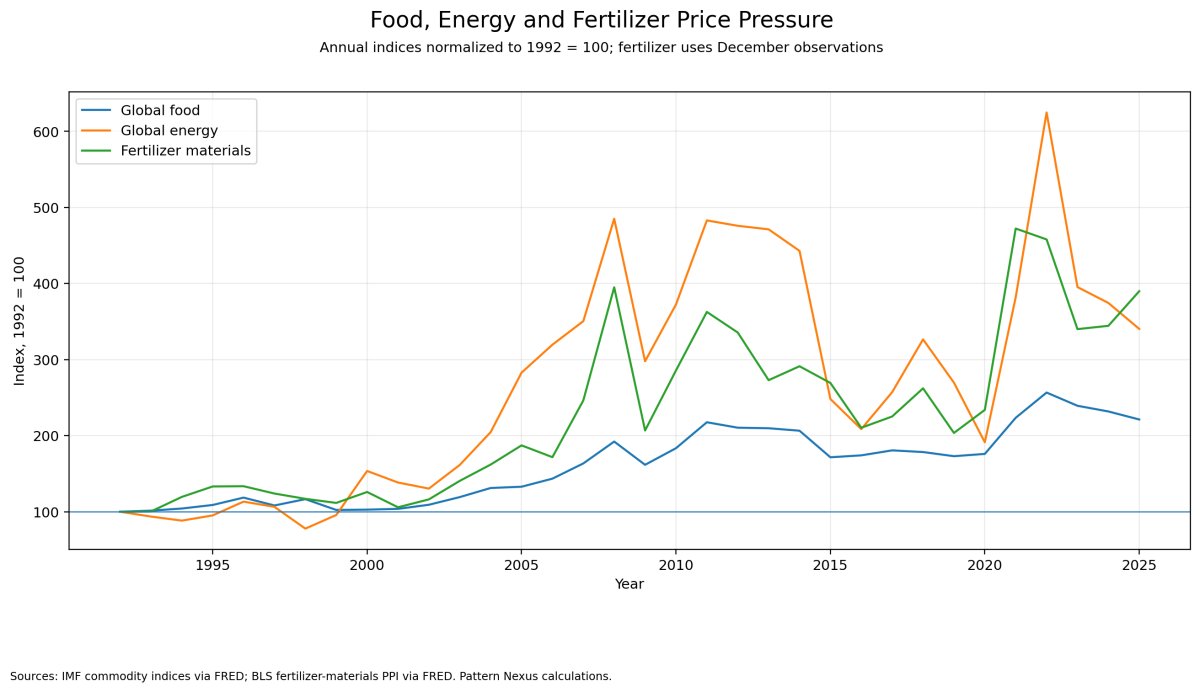
To test the cost-transmission thesis, I constructed an annual exploratory regression covering 1993 through 2025.
Variables
- Dependent variable: annual logarithmic change in the IMF global food commodity price index.[17]
- Energy variable: annual logarithmic change in the IMF global energy commodity price index.[18]
- Fertilizer variable: annual logarithmic change in the U.S. Bureau of Labor Statistics fertilizer-materials producer-price index, used as a long-running fertilizer-cost proxy.[19]
- Climate test: a NOAA El Niño onset dummy was added in a separate specification.[3]
- Sample: 33 annual observations.
- Estimation: ordinary least squares with heteroskedasticity- and autocorrelation-consistent standard errors.
| Model | Energy coefficient | Fertilizer coefficient | El Niño coefficient | Model fit |
|---|---|---|---|---|
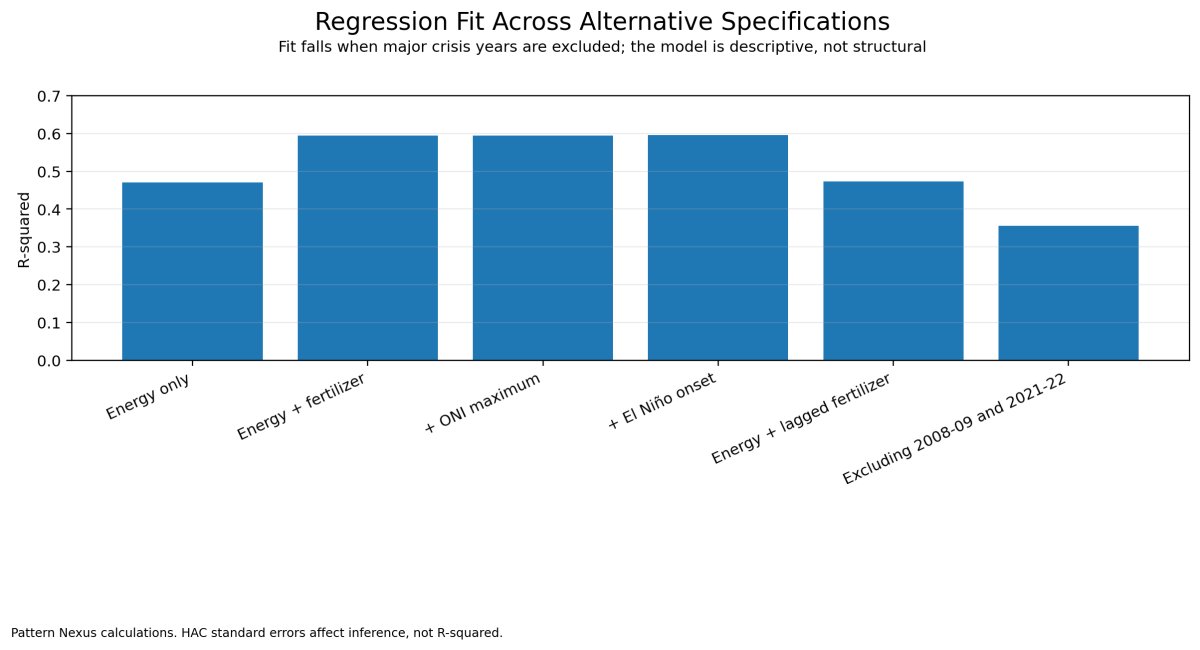
| Energy only | 0.227, p<0.001 | — | — | R² ≈ 0.47 |
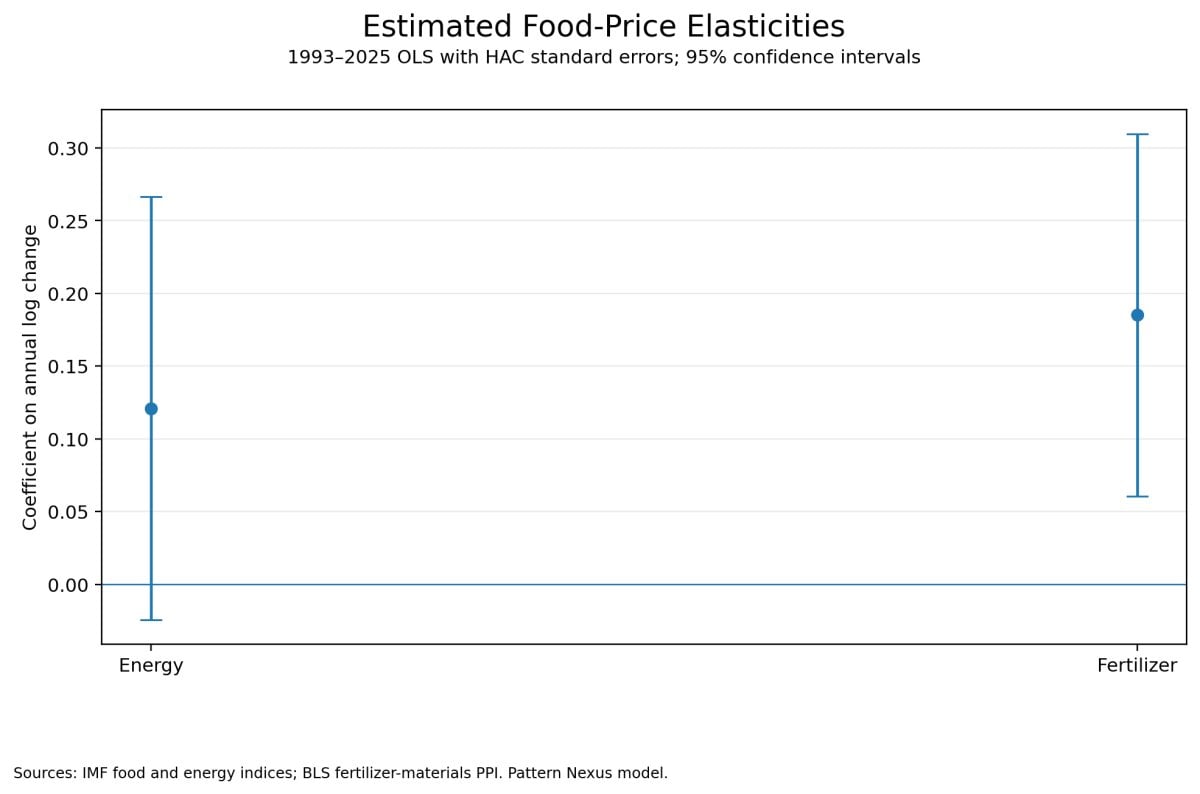
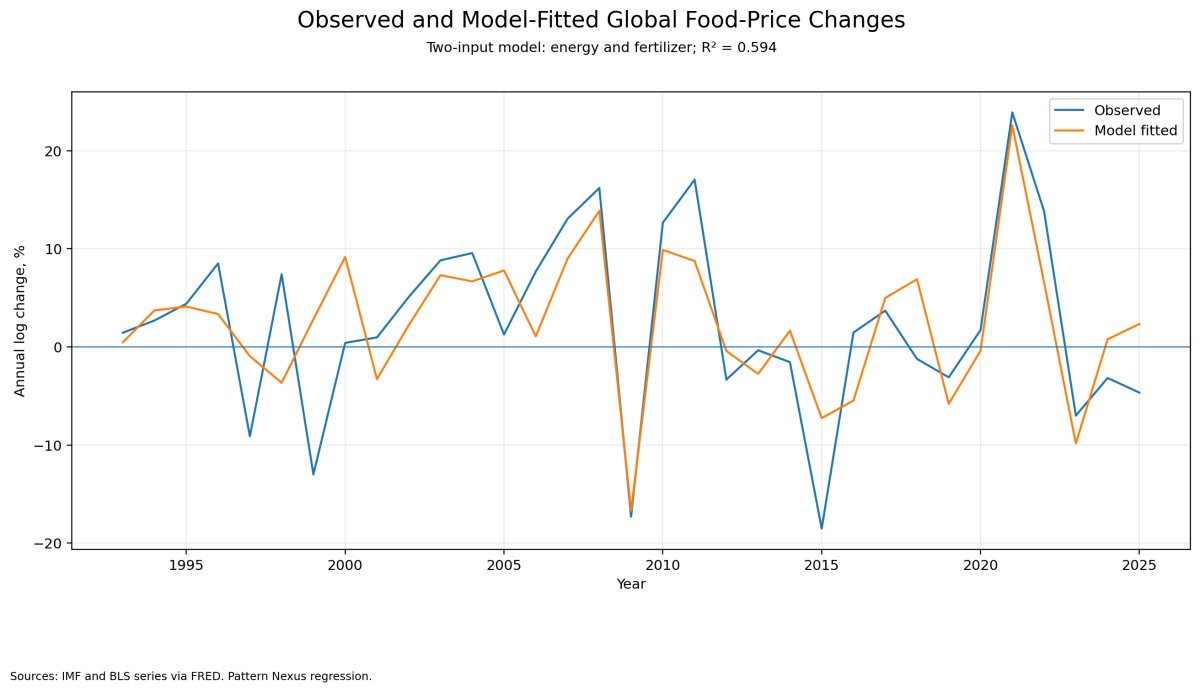
| Energy + fertilizer | 0.121, p=0.103 | 0.185, p=0.004 | — | R² ≈ 0.59 |
| Energy + fertilizer + ONI maximum | 0.129, p=0.065 | 0.183, p=0.002 | 0.003, p=0.874 | R² ≈ 0.59 |
Interpretation
The two-input model explains approximately 59% of annual movement in the global food commodity index. That is substantial for a simple annual model.
Holding the other variable constant:
- A 10% fertilizer-price increase is associated with approximately a 1.8% increase in the global food commodity index.
- A 10% energy-price increase is associated with approximately a 1.2% increase in the two-variable model, although the energy coefficient is less precisely estimated once fertilizer is included.
The El Niño dummy was not statistically significant at the global annual level. That does not mean El Niño is harmless. It indicates that a binary global annual variable is too blunt to capture regional winners, regional losers, crop-specific timing, and the interaction between weather and trade policy.
Conditional shock estimates
| Energy-price change | Fertilizer-price change | Model-implied global food commodity change |
|---|---|---|
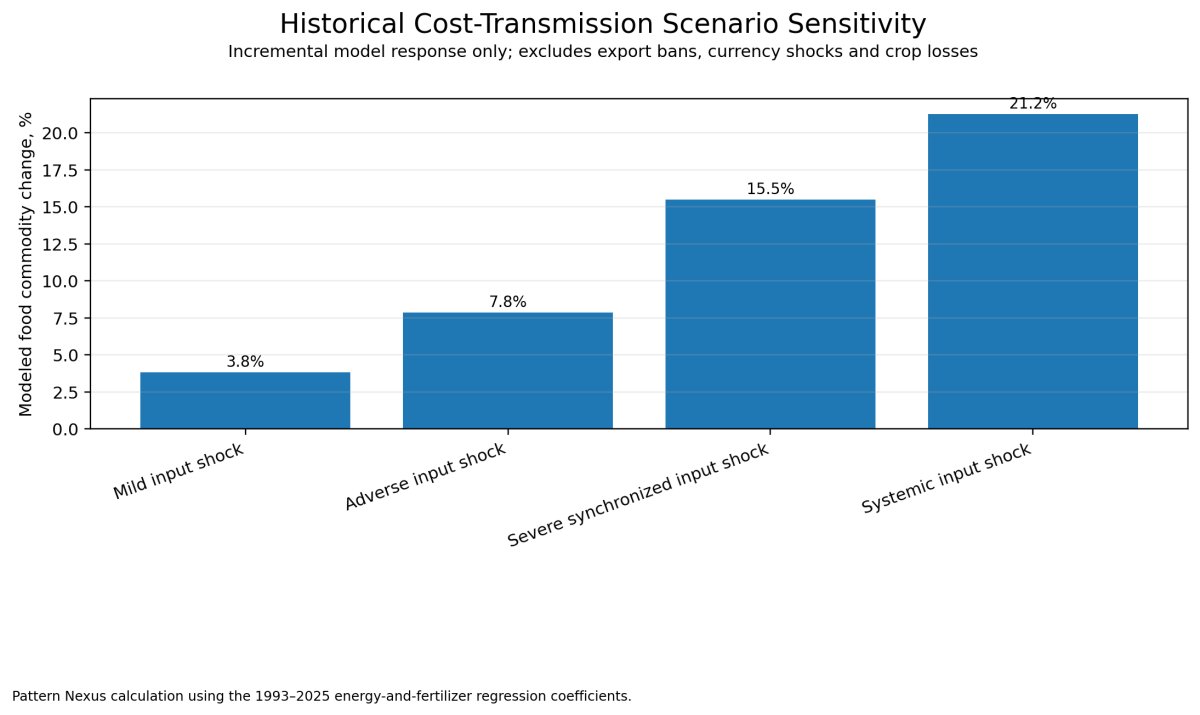
| +10% | +15% | Approximately +3.8% |
| +25% | +30% | Approximately +7.8% |
| +60% | +60% | Approximately +15.5% |
| +100% | +80% | Approximately +21.2% |
What the model does not measure
This is an association model, not a causal crop simulation or a retail grocery forecast. It does not directly include:
- Currency depreciation.
- Export bans and reserve accumulation.
- Freight, insurance, and port disruption.
- Government subsidies and price controls.
- Individual crop calendars.
- Soil moisture, extreme heat, floods, and irrigation supply.
- Strategic inventories and the concentration of those inventories.
- Retail labor, packaging, processing, and distribution costs.
Those omitted variables are often the mechanisms that create nonlinear crises. The regression is more useful for estimating the historical cost-transmission floor than the maximum crisis ceiling.
Model conclusion: Energy and fertilizer are not background variables. Together, they explain a large portion of annual global food-price movement. Weather becomes most dangerous when it strikes on top of that cost structure.
Robustness checks added in the corrected analysis
- Lagged fertilizer: coefficient -0.014, p=0.709. The one-year lag is not statistically significant.
- Excluding 2008–2009 and 2021–2022: the fertilizer coefficient remains positive at 0.188, p=0.025, but R² falls to 0.355.
- Annual maximum ONI: coefficient 0.003, p=0.874. It is not significant in the global annual price model.
- Influence: 2015 and 1999 are the two highest-Cook's-distance observations in the two-input model. The workbook includes the full diagnostics.
Correction: The scenario table now uses exact incremental transformations from the fitted log-log coefficients. It excludes the intercept and should not be interpreted as a retail-grocery forecast.
12 · 2027 OUTLOOK
Three Scenarios for 2027
Scenario One: Adaptive Stabilization
Estimated analytical probability: 35%
Gulf shipping normalizes, ammonia and urea production restarts, China and other suppliers release enough fertilizer to the market, farmers maintain application rates, and El Niño losses are offset by favorable crops elsewhere.
- Global cereal supplies remain adequate.
- Fertilizer prices remain volatile but below the April panic peak.
- Commodity food inflation remains low to moderate.
- Humanitarian crises remain severe but concentrated in existing conflict zones.
- Retail food inflation is uneven rather than globally explosive.
Scenario Two: Broad Food-Inflation Cycle
Estimated analytical probability: 45%
Fertilizer remains expensive through key application windows, El Niño damages several major crop regions, U.S. or Australian output disappoints, and importing countries bid more aggressively for available supply.
- Global food commodity prices rise approximately 10% to 20% from the pre-shock baseline.
- Local inflation is much higher in weak-currency importers.
- Livestock and processed-food inflation follow grain and feed prices with a delay.
- Subsidy budgets expand or household purchasing power falls.
- Acute food insecurity and migration increase.
- Food-related demonstrations become more common in politically fragile states.
Scenario Three: Synchronized Systemic Crisis
Estimated analytical probability: 20%
Persian Gulf infrastructure or shipping remains seriously impaired, natural-gas and fertilizer prices rise again, multiple export breadbaskets suffer major weather losses, and governments restrict grain, rice, oilseed, or fertilizer exports.
- Global commodity food prices rise 20% to 35% or more.
- The tradable supply contracts faster than total physical production.
- Humanitarian agencies lose purchasing power while caseloads increase.
- Fragile countries experience physical shortages in addition to inflation.
- Famine danger expands beyond current conflict centers.
- Subsidy cuts, currency crises, and political unrest reinforce one another.
Probability note: These are analytical scenario weights, not statistically calibrated forecasts. They are intended to discipline the thesis and identify the conditions required for escalation.
13 · OPPOSING VIEW
The Countercase: Why the Food Crisis May Be Contained
A serious analysis must explain what could prevent the thesis from materializing.
1. Inventories are still large
A 32% global cereal stocks-to-use ratio gives the system time to absorb a moderate crop loss.[1]
2. Prices already demonstrated mean reversion
Urea and broader fertilizer measures retreated after the April shock. Markets rerouted cargoes, demand adjusted, and alternate supply emerged.[5][7]
3. High crop prices create a supply response
Farmers can increase acreage, governments can subsidize fertilizer, and producers can bring marginal capacity back online.
4. El Niño creates regional winners
Some crops and regions historically benefit. Global average losses can be much smaller than the most dramatic local failures.[13]
5. North Africa and parts of the Near East have improved
The regional drought narrative is not uniform. Better rainfall and crop recovery in some areas reduce the probability of a synchronized MENA production collapse.[11]
6. Consumers can substitute
Feed formulations, crop selection, import origins, and household diets change when relative prices move.
7. Governments remember 2008 and 2022
Strategic reserves, emergency tenders, humanitarian corridors, fertilizer subsidies, and coordinated trade policy can reduce panic—if political coordination holds.
What would invalidate the stronger thesis?
- Urea and ammonia prices remain well below their April highs through the next major purchasing windows.
- Gulf fertilizer operating rates normalize and shipping insurance falls.
- U.S., Australian, South American, Black Sea, and Asian crops collectively remain near trend.
- Rice and wheat exporters avoid restrictions.
- Global stocks remain near or above a 30% stocks-to-use ratio.
- Import-dependent currencies stabilize and governments maintain staple subsidies.
If those conditions hold, 2027 may produce elevated volatility and regional crises without becoming a broad global food-inflation event.
14 · MONITORING FRAMEWORK
The 2027 Trigger Dashboard
No single indicator is sufficient. The following variables should be monitored as one system.
| Indicator | Watch for | Why it matters |
|---|---|---|
| Gulf ammonia and urea operating rates | Delayed restarts, renewed damage, gas shortages | Determines whether the input shock persists into planting windows. |
| Strait of Hormuz throughput | Fewer cargoes, higher insurance, longer transit times | Measures the real logistical constraint rather than headlines alone. |
| Urea price | Renewed movement toward or above $850/ton | Signals that adaptation has failed or a second supply shock has begun. |
| Natural gas and LNG | Persistent price increase or regional shortage | Gas is embedded in ammonia, fertilizer, electricity, and freight. |
| Fertilizer application | Lower purchases, delayed application, reduced rates | Connects market stress to biological yield risk. |
| U.S. soil moisture and crop condition | Expanding drought during pollination and grain filling | Determines maize, soybean, feed, and export risk. |
| Australian wheat rainfall | Persistent dryness during critical stages | Australia is a major tradable wheat supplier. |
| Southern African rainfall | El Niño-linked deficits | Could deepen regional hunger and import demand. |
| Asian rice conditions | Yield downgrades or flood damage | Rice markets are thin and politically sensitive. |
| Export policy | Restrictions by major grain, rice, oilseed, or fertilizer exporters | Can magnify a moderate physical loss into a major price spike. |
| Chinese reserve and export policy | Accelerated purchases or fertilizer controls | China can alter both demand and supply across several markets. |
| MENA currencies | Rapid depreciation against the U.S. dollar | Amplifies imported food and fuel prices. |
| Subsidy budgets | Bread, fuel, or electricity subsidy reductions | Marks the point where state stress transfers to households. |
| Humanitarian funding | Lower food-assistance purchasing power | Turns price inflation into ration cuts for already vulnerable populations. |
Escalation thresholds
Fertilizer remains 20%–30% above the prewar level, but crop forecasts remain near trend.
Two major exporting regions receive material crop downgrades while fertilizer and freight remain elevated.
Export restrictions spread, stocks-to-use falls rapidly, currencies break, and humanitarian rationing expands.
15 · PATTERN NEXUS LENS
The Food System Is Not Empty. It Is Becoming More Unequal in Its Ability to Deliver
The common mistake is to look for one villain and one cause.
The climate explanation says drought.
The geopolitical explanation says war.
The agricultural explanation says fertilizer.
The economic explanation says inflation.
The political explanation says corruption or unrest.
Each explanation is partially correct and incomplete.
The fertilizer plant connects to the natural-gas field.
The natural-gas field connects to the war.
The war connects to the maritime chokepoint.
The chokepoint connects to freight, insurance, and fertilizer availability.
The fertilizer connects to the farmer's credit line and application rate.
The application rate connects to the yield.
The yield connects to the reserve.
The reserve connects to export policy.
Export policy connects to the importing country's currency.
The currency connects to the bread subsidy.
The bread subsidy connects to the street.
The 2027 food shock, if it arrives, will not be one event. It will be the synchronized movement of systems that are normally analyzed separately.
The global grain balance sheet prevents me from calling worldwide famine the base case. Current production and inventories are too large for that conclusion.
But aggregate abundance should not be confused with universal security.
The most credible forecast is a widening divide between countries that can finance, insure, transport, subsidize, and distribute food—and countries that cannot.
The developed world may experience food inflation.
Fragile import-dependent states may experience shortages.
Conflict zones may experience famine.
Governments may experience fiscal stress.
Populations may experience the entire system as one thing: the price of survival rising faster than income.
Final judgment: A renewed global food-inflation cycle is credible. A regional hunger and instability cycle is highly credible. A synchronized worldwide famine is a tail scenario requiring prolonged fertilizer disruption, multi-breadbasket crop failure, export controls, and financial breakdown to occur together.
FAQ
Frequently Asked Questions
Is a global famine likely in 2027?
It is not the base case. Global cereal production and aggregate stocks remain substantial. The higher-probability risk is regional famine and acute hunger in conflict-affected, import-dependent, and financially fragile countries.
Are global grain inventories currently low?
No. FAO projects ending cereal stocks near 958 million tonnes and a stocks-to-use ratio around 32%. The vulnerability is that reserves are unevenly distributed and may not be offered to the international market during a panic.
Why does fertilizer matter if grain stocks are high?
Stocks protect the current consumption cycle. Fertilizer affects the next production cycle. A prolonged input shock can reduce application and future yields even while current warehouses remain full.
Will El Niño reduce every crop?
No. El Niño produces different regional and crop-specific effects. The systemic danger arises when losses occur in several major exporting regions at the same time.
Is U.S. drought guaranteed to expand in 2027?
No. Current dryness raises risk, but winter precipitation, snowpack, spring soil moisture, planting weather, and summer heat will determine the 2027 outcome.
Could food inflation trigger another Arab Spring?
It could act as an accelerant, especially where unemployment, subsidy cuts, corruption, repression, and weak legitimacy are already present. Food prices alone do not mechanically cause revolution.
Which fertilizer is most exposed?
Nitrogen and phosphate chains are more directly exposed to Gulf natural gas, ammonia, sulfur, and shipping disruption. Potash is comparatively diversified.
What is the single most important indicator?
There is no single indicator. The critical signal is synchronization: persistent fertilizer stress plus crop downgrades in multiple exporters plus trade restrictions and currency weakness.
What would prove the thesis wrong?
Normalized Gulf production, lower fertilizer prices through application windows, near-trend harvests across major exporters, stable currencies, and the absence of export restrictions would substantially weaken the crisis case.
SOURCES
Research and Data Sources
These sources support the production, inventory, fertilizer, climate, drought, price, food-security, and political-risk analysis used throughout this report.
- Food and Agriculture Organization of the United Nations, Cereal Supply and Demand Brief, July 2026 .
- Food and Agriculture Organization of the United Nations, FAO Food Price Index .
- NOAA Climate Prediction Center, ENSO Diagnostic Discussion, July 2026 .
- NOAA and U.S. Drought Monitor, Current U.S. Drought Conditions .
- World Bank, Fertilizer Prices Surge as Strait of Hormuz Disruptions Tighten Supplies .
- World Bank, Commodity Markets Outlook and Fertilizer Price Forecasts .
- World Bank, Commodity Price Data, June 2026 .
- International Fertilizer Association, 2025 Medium-Term Fertilizer Outlook .
- World Food Programme, Middle East Escalation and Acute Food-Insecurity Scenario .
- Food and Agriculture Organization, GIEWS Country Brief: Syrian Arab Republic .
- Food and Agriculture Organization, Crop Prospects and Food Situation, 2026 .
- Ortiz-Bobea et al., Anthropogenic Climate Change Has Slowed Global Agricultural Productivity Growth , Nature Climate Change.
- Iizumi et al., Impacts of the El Niño Southern Oscillation on Global Yields of Major Crops , Nature Communications.
- Ray et al., Climate Variation Explains a Third of Global Crop Yield Variability , Nature Communications.
- United Nations, World Population Prospects 2024 .
- Our World in Data, Crop Yields and Cereal Production .
- Federal Reserve Bank of St. Louis, IMF Global Food Commodity Price Index .
- Federal Reserve Bank of St. Louis, IMF Global Energy Commodity Price Index .
- Federal Reserve Bank of St. Louis, Producer Price Index: Fertilizer Materials .
- World Bank, Food Price Crisis, Export Restrictions, and the 2007–2008 Commodity Shock .
- Food and Agriculture Organization, 2011 Global Food Price Reporting .
- Peer-reviewed literature on food insecurity, political instability, and the Arab Spring .
- World Bank, Commodity Markets Outlook: The 2022 Energy, Food, and Fertilizer Shock .
- World Bank, Fertilizer Affordability and the 2021–2022 Price Shock .
Regression calculations are Pattern Nexus calculations based on the annual series listed in Sources 17–19. Scenario probabilities are analytical judgments, not official forecasts.
Pattern Nexus analyzes systems upstream of the public narrative: incentives, chokepoints, liquidity, infrastructure, energy, demographics, and control structures.
This analysis is for research and educational purposes. It is not investment, legal, agricultural, or emergency-management advice.
What's Your Reaction?
 Like
0
Like
0
 Dislike
0
Dislike
0
 Love
0
Love
0
 Funny
0
Funny
0
 Wow
0
Wow
0
 Sad
0
Sad
0
 Angry
0
Angry
0

Founder of Pattern Nexus. I research markets, macro, geopolitics, AI, history, ancient systems, and the patterns most people overlook. I’m also building Market Radar, a trading scanner designed to read pressure, risk, confirmation, and setup quality before chasing a move. Pattern Nexus is where I connect the dots between data, history, technology, and the bigger system playing out around us.


Comments (0)