
The Oil Cushion Is Breaking: Hormuz, Inventories, and the Liquidity Shock Hiding Inside Energy
Oil Crisis, Strait of Hormuz, Hormuz, Energy Shock, Inflation, Brent Crude, WTI Crude, Strategic Petroleum Reserve, SPR, Oil Inventories, Global Oil Supply, Gasoline Prices, Diesel Prices, Refining, Crack Spreads, Federal Reserve, Liquidity, Recession Risk, Macro, Geopolitics, Pattern Nexus
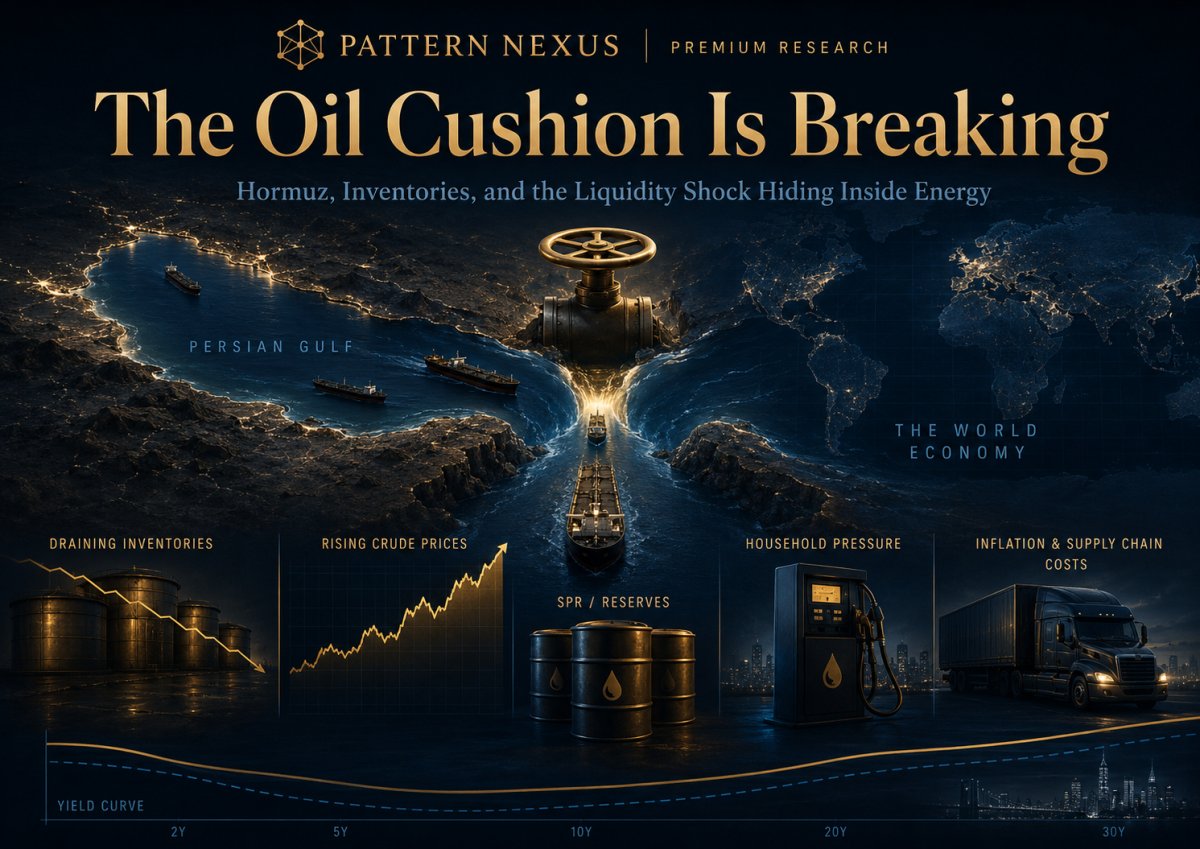
The oil market is no longer trading only barrels. It is trading time.
A normal oil article asks where Brent or WTI trades next. That is the wrong first question. The deeper question is how much buffer remains between the physical oil system and forced repricing. That buffer is not one thing. It is commercial storage, floating storage, strategic reserves, spare tanker capacity, refinery flexibility, pipeline bypass capacity, insurance tolerance, household demand elasticity, and the political willingness to let prices rise instead of draining emergency stockpiles.
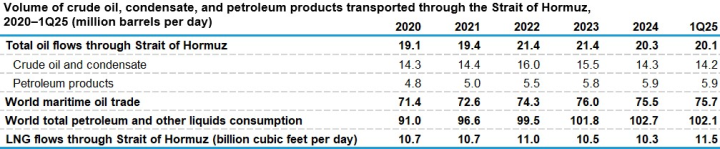
The Strait of Hormuz matters because it is not just a route. It is a global allocation valve. The U.S. Energy Information Administration has described Hormuz as one of the world’s most important oil chokepoints and estimated that 2024 oil flow through the strait averaged about 20 million barrels per day, equal to roughly 20% of global petroleum liquids consumption. EIA also says very few alternative options exist if the strait is closed, with only partial pipeline bypass capacity available through Saudi Arabia and the UAE.
When a corridor that important gets restricted, the first damage is not always a straight vertical oil-price spike. The first damage is inventory consumption. The system eats its cushion. That can make the market look more stable than it really is because the price is being suppressed by stored barrels. The danger begins when everyone realizes the cushion is not being replaced fast enough.
This is not an oil-price story. It is a buffer-stack failure story.
Most coverage treats the oil shock like a commodity headline: war happens, crude rises, gasoline rises, the Fed gets nervous, consumers complain. That is surface-layer analysis. Pattern Nexus looks at the operating system underneath it.
The real structure is layered. A military conflict or maritime restriction hits a chokepoint. The chokepoint delays physical flow. Delayed flow forces inventory drawdowns. Inventory drawdowns pull forward future scarcity. Future scarcity widens spot premiums. Spot premiums raise crude and product prices. Product prices hit diesel and gasoline. Diesel hits freight, food, construction, farming, and distribution. Gasoline hits household psychology. Both hit inflation expectations. Inflation expectations hit the Federal Reserve. The Fed’s limited room hits liquidity. Liquidity hits markets, credit, and recession risk.
That is why this is not just a Middle East article. This is the energy layer of the liquidity cycle revealing itself through a physical chokepoint.
The world is not running out of oil. It is running out of cheap, flexible, immediately deliverable oil in the right place, through the right corridor, at the right time.
That distinction matters. “Running out of oil” is the cartoon version. The real economy does not need every barrel to disappear before it breaks. It only needs enough barrels to become geographically trapped, delayed, uninsurable, politically redirected, or too expensive to move without forcing every buyer into the same narrow bidding channel.
Oil shocks become dangerous when the price stops being a clean signal of supply and demand and becomes a signal of time-to-buffer exhaustion. That is the regime we are entering. Every SPR release buys time but reduces future emergency capacity. Every export surge helps allies but drains domestic flexibility. Every tanker reroute solves one delivery while creating another delay. Every gallon of gasoline absorbs household cash flow. Every dollar of diesel becomes embedded in the cost of freight, food, parts, and services.
The oil cushion is breaking because the world built a just-in-time physical economy on top of chokepoints it does not control, inventories it does not want to rebuild, and policy tools that become harder to use when the shock itself raises inflation.
The numbers that define the pressure system
Normal Hormuz oil flow
EIA’s 2024 estimate for oil flow through the Strait of Hormuz, about one-fifth of global petroleum liquids consumption.
Available bypass capacity
EIA estimate for Saudi and UAE pipeline capacity that could bypass Hormuz in a disruption. Useful, but nowhere near full replacement.
Gulf output loss
IEA’s May 2026 estimate of output from Gulf countries affected by the closure below pre-war levels.
2Q inventory draw
EIA May STEO expected global oil inventories to fall by an average of 8.5 million barrels per day in 2Q26.
The world is not running out of oil. It is running out of immediately usable oil in the right place, at the right time, through the right corridor.
This is the context that has to be understood before the price chart makes sense. The world still has enormous proven crude oil reserves. OPEC’s Annual Statistical Bulletin places world proven crude oil reserves around 1.567 trillion barrels, and broader proved-oil estimates often run higher depending on whether the category includes crude, condensate, natural gas liquids, and other liquids. At a global consumption rate a little above 100 million barrels per day, that is not a story of the planet literally running out of oil this year or next year. That framing is too simple, and it misses the danger.
The problem is not total oil-in-the-ground. The problem is deliverable oil. Markets do not price some abstract barrel sitting inside the earth. Markets price barrels that can be produced, lifted, loaded, insured, financed, shipped, refined, and delivered into the correct demand center at the correct moment. When the Strait of Hormuz is restricted, the world still has oil. But a large share of the oil that normally clears the system through that corridor becomes delayed, trapped, rerouted, repriced, or temporarily unavailable.
That is why this crisis looks more like a liquidity crisis than a simple commodity shortage. In finance, a market can have plenty of assets on paper and still break if no one can access cash at the moment they need it. Oil works the same way. The world can have decades of reserves on paper and still suffer an immediate price shock if the flexible, tradable, correctly located barrels disappear from the current market.
| Layer | Approximate scale | What it really means | Why it matters now |
|---|---|---|---|
| World proven crude oil reserves | ~1.567 trillion barrels | Oil that is commercially recoverable under current economics and technology. | This proves the crisis is not total geological exhaustion. |
| Static reserve life | Roughly 40+ years depending on demand and reserve definition | A rough reserve-to-consumption ratio, not a countdown clock. | The market can break long before reserves run out because location and timing dominate price. |
| Normal Hormuz flow | ~20 million barrels per day | A major share of the world’s daily petroleum liquids flow passing through one narrow maritime corridor. | This is the immediate chokepoint that turns long-term reserves into a short-term delivery crisis. |
| Available bypass capacity | ~2.6 million barrels per day | Saudi and UAE pipeline capacity that can bypass Hormuz. | Useful, but nowhere near enough to replace normal Hormuz flow. |
This is why the article cannot be framed as “the world is almost out of oil.” That would be wrong. The more accurate and more dangerous frame is this: the world has oil, but the flexible buffer that lets oil move cheaply through the system is being consumed. Once that buffer thins out, the market stops pricing abundance and starts pricing access.
The important part is not one warning. It is that multiple institutions are now warning about the same pressure point from different angles.
One oil executive warning about price risk can be dismissed as talking his book. One bank warning about inflation can be dismissed as macro positioning. One central banker warning about energy inflation can be dismissed as policy messaging. The reason this moment matters is that the warnings are converging. Oil producers, banks, central bankers, inventory analysts, export data, gasoline-stock data, and shipping data are all pointing toward the same structure: the market is using reserves and inventories to bridge a supply shock, but the bridge has a time limit.
| Institution / voice | Warning | Pattern Nexus read |
|---|---|---|
| ExxonMobil / Neil Chapman | Global inventories are approaching unusually low levels, with $150–$160 oil cited as a risk if operational floors are breached. | This is the physical-market warning: once storage stops absorbing the shock, spot price has to ration demand. |
| Chevron / Mike Wirth | Market buffers are being drawn down, making June and July more exposed to physical price pressure. | This is the timing warning: summer demand arrives while shock absorbers are already thinner. |
| Goldman Sachs | Global oil stocks are approaching an eight-year low, with concern focused on depletion speed and product buffers. | This is the inventory-velocity warning: the market is losing runway faster than price alone shows. |
| JPMorgan / Jamie Dimon | The Iran war could produce ongoing commodity shocks, sticky inflation, and higher rates than markets expect. | This is the macro-financial warning: energy scarcity can push the rate path higher even while growth weakens. |
| Kansas City Fed / Jeffrey Schmid | The energy shock should not automatically be treated as transitory because inflation has remained above target too long. | This is the policy-credibility warning: the Fed has less room to look through gasoline and diesel inflation. |
| Dallas Fed / Lorie Logan | If Hormuz remains closed, the global economy may need to reduce oil and natural gas use because inventories are finite. | This is the demand-destruction warning: if supply cannot clear, consumption has to be forced lower. |
Taken together, the warning tape says the market is not debating whether oil exists. It is debating how long current inventories, reserves, reroutes, and demand flexibility can keep the system from having to ration physical barrels through price.
Pick the version that matches how deep you want to go.
Each version explains the same oil shock through a different lens. The first version is for households and normal readers. The second is for investors, business owners, and operators. The third is for readers who want the full system mechanics: inventory velocity, product cracks, inflation transmission, and liquidity constraints.
The simple version: the world built a just-in-time oil system, and now the emergency cushion is shrinking.
Oil is not just gasoline. Oil is the movement layer of modern life.
When most people hear “oil crisis,” they think gasoline. That makes sense because gasoline is the price they see every day. It is posted on big signs. It hits the debit card. It makes the commute feel more expensive before any government inflation report catches up.
But gasoline is only the visible part. Oil is the movement layer underneath the economy. Diesel moves trucks. Trucks move food, packages, tools, building materials, medicine, and replacement parts. Jet fuel moves people and high-value cargo. Petrochemical feedstocks become plastics, packaging, insulation, synthetic materials, medical supplies, consumer goods, and industrial inputs. Heating oil still matters in parts of the country. Asphalt matters for roads. Lubricants matter for machinery. Oil is built into more of the world than people realize.
That means an oil shock does not stop at the gas pump. It spreads through receipts. It hits grocery stores through freight. It hits contractors through materials and equipment. It hits farmers through diesel and chemicals. It hits airlines through fuel. It hits small businesses through delivery costs. It hits families through commuting, vacations, school driving, and every product that has to be moved before it can be bought.
Hormuz is the narrow door the world pretends is a hallway.
The Strait of Hormuz is a narrow maritime corridor between Iran and Oman. It connects the Persian Gulf to the Gulf of Oman and the Arabian Sea. That sounds like geography, but it is really an operating system. It is a door that some of the world’s most important oil and LNG flows have to pass through.
The key point is scale. EIA estimated that oil flow through Hormuz averaged about 20 million barrels per day in 2024, roughly 20% of global petroleum liquids consumption. EIA also estimated that flows through Hormuz made up more than one-quarter of global seaborne oil trade and about one-fifth of global LNG trade in 2024. That means Hormuz is not a regional problem. It is a global timing problem.
Yes, there are some bypass options. Saudi Arabia has its East-West pipeline to the Red Sea. The UAE has a pipeline to Fujairah outside the strait. But EIA estimates only about 2.6 million barrels per day of available Saudi and UAE bypass capacity in a disruption. That helps. It does not replace a normal 20 million barrel-per-day corridor.
The scary part is not only the disruption. It is the shrinking cushion.
When a major supply route gets disrupted, the world does not instantly run dry. The system has cushions. Companies pull from commercial inventories. Governments release strategic reserves. Tankers get redirected. Buyers switch suppliers. Refineries adjust crude slates. Some people drive less. Some companies slow production. Some airlines cut routes. Some demand gets destroyed because the price rises enough to force behavior to change.
That is why the first phase of an oil crisis can look weird. The news can be terrible, but the price may not immediately go vertical. People assume that means the system is fine. It may not be fine. It may just be eating the cushion.
This is the main point from the transcript: the price has not exploded as much as it could because the world has been drawing from reserves and inventories. The warning is that the cushion is not infinite. Once buyers start to believe the cushion is nearly gone, the price does not wait until the last barrel disappears. The price moves when the market sees the path toward scarcity.
So how much oil is actually left?
This is where people get confused because there are two different questions that sound the same but are not the same.
Question one is: how much oil does the world still have underground that can likely be recovered under current technology and economics? The answer is still a massive amount. Proven reserve estimates are measured in the trillions of barrels globally. Depending on the reserve definition used, the world has something like four decades or more of oil at today’s rough consumption rate. That does not mean the world should be careless with oil. It means this is not a simple “we are out of oil” story.
Question two is the one that matters right now: how much oil can reach the market at the right time, through the right route, in the right form, without prices breaking the economy? That answer is much tighter. A barrel trapped behind a chokepoint does not help a refinery that needs crude next week. A barrel in a strategic reserve helps only until it is released. A barrel that exists underground but cannot be produced for years does not solve a summer gasoline and diesel shock.
That is why the phrase “oil cushion” matters. The cushion is the difference between total oil and usable oil. Total oil is geology. Usable oil is logistics. The price crisis lives in logistics.
The timing window: why June and July matter
The danger is not only that oil is expensive today. The danger is where the system is in the calendar. Summer driving demand rises. Airlines move into heavier travel season. Refineries are asked to run hard. Gasoline stocks are already stressed. Diesel remains the hidden cost layer underneath freight and distribution. At the same time, strategic reserves are lower than the public is used to, and global buyers are competing for replacement barrels.
That means the market is entering the part of the year when energy gets politically visible. Families see gasoline prices. Truckers see diesel. Airlines see jet fuel. Retailers see freight. Central banks see inflation expectations. Politicians see voters getting angry. Every layer starts reacting at once.
Inventories and reserves absorb the shock, keeping the price below what a full panic would look like.
The market watches whether Hormuz flow improves faster than inventories fall.
If buffer confidence fails, oil does not need to wait for empty tanks. The price begins rationing demand in advance.
This is why the article is about timing. The system may still have oil, but the question is whether it has enough time.
What households feel first: gasoline, diesel, groceries, and the feeling that money is disappearing faster.
For households, the crisis does not arrive as a clean academic model. It arrives as a series of annoyances that stack up. Filling the car costs more. Grocery runs cost more. Delivery fees rise. Contractors quote higher. Flights get expensive. Summer trips get reconsidered. Repair parts take longer and cost more. Small businesses quietly raise prices because fuel is now buried in everything they buy.
Gasoline is the emotional signal. Diesel is the hidden signal. Gasoline tells the public that inflation is back. Diesel tells the supply chain that movement is more expensive. That is why diesel matters so much. It touches freight, farming, construction, mining, distribution, and emergency services. If diesel stays high long enough, it does not just raise trucking costs. It raises the cost of being an economy.
EIA explains that retail gasoline prices are made from several layers: crude oil, taxes, refining costs and profits, and distribution and marketing. Crude is usually the largest component, but refining and distribution can also matter a lot during shocks. That means a crude spike is only the first part. If refinery margins widen at the same time, the pump can move faster than crude alone would suggest.
| Shock layer | What moves | Who feels it | Why it matters |
|---|---|---|---|
| Crude oil | Brent, WTI, Dubai, spot cargoes | Refiners, producers, importers | Sets the base cost of the liquid-fuel system. |
| Refined products | Gasoline, diesel, jet fuel | Households, truckers, airlines, farmers | This is where crude scarcity becomes daily-life inflation. |
| Freight | Trucking, shipping, delivery, logistics | Retailers, grocers, manufacturers | Embeds energy cost into nearly every physical product. |
| Household budget | Commuting, groceries, repairs, travel | Families and workers | Turns energy inflation into reduced discretionary spending. |
A household example makes the point. If a family uses 800 gallons of gasoline per year, every extra dollar per gallon is roughly $800 per year before counting food, delivery, insurance, repairs, and the diesel cost hidden in everything that moves by truck. If gasoline rises by $1.50 per gallon, that is about $1,200 per year on fuel alone. For a higher-income household, that is annoying. For a stretched household, that is the difference between staying current and falling behind.
History says oil shocks expose what was already weak.
The 1973–1974 oil shock is the classic example. OAPEC instituted an embargo against the United States after U.S. support for Israel during the Yom Kippur War. The embargo cut off imports from participating OAPEC nations and production cuts changed the world oil price structure. The U.S. State Department’s history notes that the price of oil first doubled, then quadrupled, creating global implications and serious structural pressure.
But the lesson is not “1973 repeats exactly.” It never does. The lesson is that oil shocks become broader crises when they collide with fragile systems. In the 1970s, that fragile system included monetary instability, inflation pressure, and changing global power. In 2008, the oil spike collided with household leverage, housing stress, and credit fragility. In 2022, energy shocks collided with post-pandemic supply-chain damage and inflation expectations.
The 2026 version is different again. The U.S. produces far more oil than it did during earlier crises. But the world economy is more financially leveraged, more globally synchronized, more inventory-sensitive, and more dependent on just-in-time logistics. The system has more data than ever, but less patience for physical delay.
Three household scenarios
Hormuz traffic gradually normalizes, inventory draws slow, and oil stays elevated but stops spiraling. Households deal with expensive fuel, but the shock does not become a full recession trigger.
Traffic resumes unevenly. Insurance costs remain high. Tankers reroute. Inventories keep falling. Gasoline and diesel stay painful through summer. Consumers cut discretionary spending.
The market realizes the cushion is too thin. Buyers bid for physical barrels. Oil spikes. Gasoline and diesel jump. Inflation expectations rise. Recession risk accelerates.
The point is not that the worst case must happen. The point is that the system’s margin for error is smaller than the headline price suggests. When buffers are thick, bad news gets absorbed. When buffers are thin, bad news gets repriced.
The real oil shock is a buffer-stack failure that turns physical scarcity into inflation, rate pressure, and liquidity risk.
1. The buffer stack is why the market can look stable right before it becomes unstable.
Oil markets do not move only because current supply is above or below current demand. They move because the market changes its belief about future availability. That belief is shaped by inventories, spare production, shipping routes, refinery flexibility, and the credibility of emergency reserves.
The transcript’s core point is correct as a structural frame: oil prices can stay below panic levels while inventories and reserves absorb the first wave of the shock. That does not mean the shock is solved. It means the shock has been transferred into the buffer layer. If the buffer layer is consumed too quickly, the price response can become nonlinear.
This is why “where is oil today?” is less important than “how fast are inventories drawing?” and “how much longer can the system absorb this without forcing demand destruction?” A market can tolerate a deficit for a while if storage is comfortable. It cannot tolerate the same deficit when storage is already near minimum operating comfort and governments are draining strategic reserves.
2. Inventories are not just barrels. They are stored optionality.
The IEA’s May 2026 Oil Market Report described a market under severe inventory pressure. It said global oil supply fell again in April to 95.1 million barrels per day, bringing total losses since February to 12.8 million barrels per day. It also said output from Gulf countries affected by the Hormuz closure was 14.4 million barrels per day below pre-war levels.
EIA’s May STEO adds the timing layer: global inventories were expected to fall by an average of 8.5 million barrels per day in the second quarter of 2026. That is not a normal draw. That is a countdown. At that speed, even large storage buffers become short-duration assets.
This is where the market can go from calm to disorderly. If traders believe the drawdown will be solved soon, prices can stay elevated but contained. If traders believe the drawdown will continue into minimum operating levels, the front of the curve becomes a physical bidding war. The market stops valuing future barrels and starts paying up for immediate barrels.
2A. The CEO and bank warnings are not noise. They are a map of the pressure points.
The recent warning tape matters because each institution is describing the same crisis from a different angle. Exxon is describing inventory floors. Chevron is describing depleted shock absorbers. Goldman is describing days-of-demand coverage. JPMorgan is describing inflation and rate risk. The Fed is describing the policy credibility problem. Reuters export and gasoline-stock data show how those warnings are already moving through actual barrels.
This is not one clean recession call or one clean commodity call. It is a convergence call. The oil market is telling us the physical cushion is shrinking. The product market is telling us gasoline and diesel are the household and freight transmission channels. The bond market is telling us energy inflation changes the rate path. The equity market is telling us investors still want to believe in de-escalation. That split is exactly why the move can become violent if the physical market proves less forgiving than the financial market assumes.
2B. The timing window: the market is moving from inventory comfort to inventory anxiety.
Oil crises do not become systemic only because price rises. They become systemic when the market realizes the current balancing method cannot continue. Right now, the balancing method is a mix of inventory draws, strategic reserve releases, export redirection, refinery adjustments, rerouted cargoes, and early demand destruction.
That combination can work for days or weeks. It can even work long enough to create false calm. But it cannot work forever. Every reserve release lowers future protection. Every commercial inventory draw lowers future flexibility. Every export cargo sent to plug an overseas shortage tightens the domestic argument over why fuel is expensive at home. Every refinery running hard into low product stocks raises the risk of a product-price spike if anything else goes wrong.
This is why June and July are the pressure window. The market is entering summer driving season while gasoline inventories are already stressed, distillate buffers are thin, Hormuz flows are restricted, and central banks are worried about energy inflation feeding broader price expectations. The timing is bad because the oil system is being asked to absorb a geopolitical shock exactly when household fuel demand and political sensitivity rise.
2C. How much oil is left is the wrong market question.
The reserve question matters politically because people hear “oil crisis” and think depletion. But the market question is not how much oil exists in the ground. It is how much oil exists in the active system: produced, movable, insurable, financeable, compatible with refinery needs, and available before buyers start bidding against each other.
A trillion-barrel reserve base does not stop a price spike if a refinery needs a cargo now and the route is restricted. A strategic reserve does not stop a price spike if the market believes the reserve is being depleted faster than the conflict is being solved. A pipeline bypass does not stop a price spike if the bypass capacity covers only a fraction of the disrupted flow.
This is the same logic that applies to liquidity markets. Solvency over decades does not prevent a panic if cash cannot clear this week. Oil reserves over decades do not prevent a shock if physical barrels cannot clear this month.
3. U.S. exports are a pressure-release valve, but they also reveal the global scramble.
Reuters reported that U.S. crude exports climbed to a record 5.6 million barrels per day in May 2026 as Asian and European refiners sought alternatives to Middle Eastern supply. That tells you something important: the U.S. is not isolated from the shock just because it produces a lot of oil. It becomes part of the global reallocation machine.
This is where the household layer and geopolitical layer collide. If U.S. crude is exported to help allies and satisfy global buyers, that can be strategically useful. But if domestic inventories are already low and the SPR is being drawn, exports also become politically controversial. The public sees high gasoline prices and asks why barrels are leaving. The market sees global price spreads and moves barrels to where they clear.
That tension is not a bug. It is the system. Oil does not obey national emotional preference once it is inside a global price network. It follows arbitrage, contracts, grade compatibility, shipping economics, refinery needs, and diplomatic pressure.
4. Crude gets the headline, but refined products carry the economic pain.
The public tracks crude because crude is the headline. But households and businesses pay for products. Gasoline is one product. Diesel is another. Jet fuel is another. Petrochemical feedstock is another. The shock can intensify when crude scarcity becomes refined-product scarcity.
Reuters reported that U.S. gasoline prices were already around $4.33 per gallon, close to four-year highs, and that U.S. gasoline inventories had fallen for 15 straight weeks to the lowest seasonal level since 2014. That is exactly the kind of setup where a new disruption can create an outsized price move. Inventories are not just low. They are low going into peak driving season.
This matters because gasoline is a political signal. Diesel is an economic signal. If gasoline keeps rising, voters get angry. If diesel keeps rising, the supply chain gets expensive. If both rise together, the economy gets squeezed from the consumer side and the production side at the same time.
| Market layer | Stress signal | What it means | Pattern Nexus interpretation |
|---|---|---|---|
| Crude | Brent/WTI spot and curve structure | Prompt barrels command premium if physical availability tightens. | The market is paying for immediacy. |
| Gasoline | Pump prices and stock draws | Households see inflation every time they fill up. | The shock becomes politically visible. |
| Diesel | Distillate stocks and diesel cracks | Freight, farming, construction, and logistics costs rise. | The shock becomes embedded inflation. |
| Refining | Crack spreads, utilization, crude slate mismatch | Product prices can rise faster than crude alone. | The bottleneck shifts downstream. |
5. The Federal Reserve trap: inflation blocks rescue until recession forces it.
Oil shocks create the ugliest kind of central-bank problem because they can raise inflation and weaken growth at the same time. If the Fed cuts into an oil-driven inflation surge, it risks looking like it is adding liquidity into a supply shock. If it stays tight while households and businesses get squeezed, it risks turning an energy shock into a credit and employment shock.
Kansas City Fed President Jeffrey Schmid warned against assuming the current energy shock is simply transitory, saying inflation has been too hot and above target too long. That matters because central banks can “look through” temporary energy shocks when inflation expectations are anchored and the broader system is calm. It is much harder to look through energy shocks when inflation credibility is already strained.
The IMF’s rule of thumb is useful here. It estimates that each persistent 10% oil-price increase can add about 40 basis points to global headline inflation and reduce global output by about 0.1%–0.2%. That sounds manageable until you stack multiple shocks: higher fuel, higher freight, higher food, higher rates, tighter credit, weaker spending, and political pressure to “do something.”
6. Market map: who wins, who loses, and who gets squeezed first?
Can benefit from higher prices, but only if they can produce, transport, hedge, and sell into favorable differentials without political backlash.
Can benefit from strong product margins, but crude availability, crude quality, export pressure, and political scrutiny all matter.
Get hit through diesel, delivery, parts, logistics, and customer demand weakness. Margins compress unless costs can be passed through.
Feel the shock through commuting, groceries, travel, repairs, and the emotional signal of rising pump prices.
The market sequence to watch is not just oil up, stocks down. It is oil up, product cracks up, inflation expectations up, rate-cut expectations down, credit spreads wider, household spending weaker, recession odds higher, then liquidity-response expectations returning after growth breaks.
The technical frame: physical flow loss, inventory velocity, product-market amplification, inflation impulse, and policy convexity.
1. Flow balance: a 100M b/d system does not tolerate a large corridor disruption cleanly.
The global oil system is a flow network, not a warehouse. Production, shipping, refining, storage, and demand have to line up continuously. The system can absorb shocks through inventories, but only temporarily. It can reroute flows, but not without time, freight, insurance, grade mismatch, and destination constraints.
IEA’s May 2026 report puts the scale of the disruption in institutional terms: global oil supply fell to 95.1M b/d in April, total losses since February reached 12.8M b/d, and output from Gulf countries affected by the Hormuz closure stood 14.4M b/d below pre-war levels. EIA’s May STEO separately states that Brent reached $138/b on April 7 and averaged $117/b in April as the de facto closure of Hormuz tightened global oil supplies.
The technical problem is not simply the size of the loss. It is the mismatch between loss magnitude, available bypass capacity, inventory runway, and demand elasticity. If a large share of the lost flow cannot be replaced immediately, the balancing mechanism becomes inventory draw plus price-induced demand destruction.
| Variable | Reported / referenced value | Source | System meaning |
|---|---|---|---|
| Normal Hormuz flow | ~20M b/d | EIA | One corridor touches roughly one-fifth of global petroleum liquids consumption. |
| Available Saudi/UAE bypass | ~2.6M b/d | EIA | Partial relief, not replacement. |
| Gulf output below pre-war | 14.4M b/d | IEA May 2026 | A large physical-flow shock, not a marginal outage. |
| 2Q26 global inventory draw | 8.5M b/d average | EIA May STEO | Inventory is functioning as the balancing item. |
1A. Reserve life versus inventory runway: the technical distinction that controls the article.
Reserve life is a long-cycle geological and economic concept. Inventory runway is a short-cycle market-clearing concept. Confusing those two produces bad analysis. World proven crude reserves can be measured in the trillions of barrels while the prompt physical market can still break because the marginal barrel is in the wrong place, behind the wrong corridor, or unavailable in the right crude grade.
A static reserve-to-production ratio divides proven reserves by annual consumption. It is useful as a broad background estimate, but it is not a crisis timer. The crisis timer is the drawdown rate of commercial inventories, strategic reserves, refined product stocks, and oil on water relative to disrupted flow and demand elasticity.
| Metric | What it measures | Useful for | Not useful for |
|---|---|---|---|
| Proven reserves | Recoverable oil under current technology and economics. | Long-cycle energy security and investment context. | Predicting whether gasoline spikes next month. |
| Commercial inventories | Barrels already in the system and available for market balancing. | Prompt market risk, spot premiums, and refining continuity. | Long-term geological depletion. |
| Strategic reserves | Government emergency barrels released to buy time. | Temporary bridge during disruption. | Permanent replacement for production and free trade flow. |
| Product stocks | Gasoline, distillate, jet fuel, and other refined product buffers. | Household, freight, aviation, and industrial price pressure. | Explaining crude-only reserve adequacy. |
The working rule is simple: reserves tell you whether the world has oil over decades; inventories tell you whether the economy has breathing room over weeks.
1B. Price paths: $100, $130, $160, and $200 are not magic numbers. They are stress thresholds.
The transcript frames the risk range around $130, $150, $160, and $200 oil. The right way to use those numbers is not as certainty. They are scenario thresholds. Each threshold changes which part of the economy starts rationing first.
| Oil price zone | Market meaning | Household effect | Macro effect |
|---|---|---|---|
| $90–$110 | Elevated risk premium, still bridgeable if flow improves. | Painful gasoline, but many households absorb it temporarily. | Inflation anxiety rises, but recession is not automatic. |
| $120–$140 | Demand destruction begins moving from theory to behavior. | Trips are canceled, discretionary spending gets cut, credit-card stress rises. | Rate-cut expectations get pushed out while real growth weakens. |
| $150–$160 | Inventory-floor breach scenario; price rations physical barrels. | Fuel becomes a household balance-sheet shock. | Recession probability rises sharply, but inflation blocks easy rescue. |
| $180–$200+ | Disorderly energy regime; only severe demand destruction or policy intervention clears the market. | Low- and middle-income households get forced into spending triage. | The system moves toward recession/rescue dynamics. |
This is why $160 oil is not just “more expensive oil.” It is a regime marker. It implies the market no longer trusts inventory buffers and is using price as the balancing tool.
2. Curve structure: prompt scarcity is the market paying for immediacy.
In a comfortable market, storage and time have value. Futures curves can sit in contango because future barrels trade above prompt barrels after accounting for storage, financing, and carry. In a physically tight market, prompt barrels can become more valuable than future barrels. That is backwardation. The front of the curve becomes a scarcity gauge.
This is why crude price alone is not enough. A $100 flat price in a well-supplied market is different from a $100 flat price in a market where the front-month contract is screaming for immediate delivery. The latter tells you buyers are paying for location and time, not just oil in the abstract.
The Pattern Nexus read is straightforward: when the curve tightens at the front, the system is saying stored optionality has been depleted. Physical availability is now more valuable than future promise.
3. Refining layer: the crude shock becomes a product shock through cracks, slates, and utilization.
A barrel of crude is not gasoline. It is not diesel. It is not jet fuel. It has to pass through a refinery, and not every refinery can process every crude grade equally. Gulf barrels, Atlantic Basin barrels, shale barrels, heavy sour barrels, and light sweet barrels do not map perfectly onto every refinery configuration. This creates grade mismatch risk.
If refiners lose access to preferred crude slates, they may have to buy substitutes at different prices, run less efficiently, alter yields, or compete for cargoes that other refiners also need. If product inventories are low at the same time, product cracks can widen. The public sees gasoline. The industrial economy feels diesel. The airline system feels jet fuel. The chemical sector feels feedstocks.
This is why product-market stress can outlast the crude headline. Even if crude prices pull back on ceasefire optimism, it can take weeks for cargoes to normalize, refinery slates to rebalance, inventories to refill, and product margins to compress. The physical system has lag.
4. Inflation impulse: gasoline visibility plus diesel embeddedness is the dangerous combination.
Energy shocks matter to inflation in two ways. First, there is direct inflation: gasoline, diesel, heating oil, jet fuel, electricity pass-through, and fuel surcharges. Second, there is indirect inflation: freight, food distribution, manufacturing, packaging, services, travel, and replacement costs. The second channel is slower, but it can be more persistent because it embeds inside supply chains.
There is also an expectations channel. Households do not experience inflation through CPI methodology. They experience it through repeated transactions. Gasoline is one of the highest-frequency price signals in normal life. When people see pump prices rise fast, they update their inflation psychology before they read an economic report.
The IMF rule of thumb gives a macro calibration: a persistent 10% rise in oil prices adds about 40 basis points to global headline inflation and subtracts about 0.1%–0.2% from global output. The key word is persistent. A short spike can be absorbed. A persistent shock starts rewriting wage demands, business pricing, central-bank expectations, and fiscal politics.
5. Liquidity trap: oil can delay the easing cycle, then force the rescue cycle.
This is the part most oil analysis misses. A major oil shock is not only bearish or bullish. It changes the timing of liquidity. While oil is lifting headline inflation, central banks have less room to ease. Rate-cut expectations get pushed out. Real incomes weaken. Credit conditions tighten. Equity multiples compress. Risk assets lose the policy-put support they wanted.
But if the shock persists long enough, it can break growth. Once layoffs rise, credit spreads widen, consumer demand weakens, and recession risk becomes visible, policymakers face the other side of the trap. They may have to respond to financial stress even while inflation remains uncomfortable. That is how the system moves from inflation restraint to rescue pressure.
This is why Pattern Nexus keeps returning to the idea that liquidity needs a cover. Policymakers cannot openly flood the system while oil-driven inflation is hot without risking credibility. But if the energy shock causes enough damage, recession itself becomes the cover. The sequence matters: oil shock first, inflation fear second, rate pressure third, growth break fourth, liquidity response fifth.
6. Technical dashboard: what to watch from here
| Dashboard category | Signals | Bullish stabilization read | Bearish systemic read |
|---|---|---|---|
| Physical flow | Hormuz crossings, tanker traffic, port delays, insurance | Traffic normalizes and insurance costs fall. | Traffic remains sporadic and freight/insurance stay elevated. |
| Inventory | OECD stocks, SPR, Cushing, gasoline, distillates | Draws slow or flip to builds. | Draws continue into peak demand and minimum comfort levels. |
| Product markets | Gasoline stocks, diesel cracks, 3:2:1 cracks, refinery runs | Product stocks rebuild and cracks compress. | Cracks stay high even if crude stabilizes. |
| Macro | Inflation expectations, yields, credit spreads, consumer spending | Inflation expectations stay anchored and credit remains orderly. | Inflation and credit stress rise together. |
| Policy | Fed language, SPR releases, export politics, fiscal relief | Policy remains calm and targeted. | Emergency measures expand while inflation remains elevated. |
The technical conclusion is not that oil must go to $160 or $200. The technical conclusion is that the distribution has fattened. The market is no longer priced only around normal supply/demand elasticity. It is pricing a corridor shock, inventory velocity, product-market amplification, and policy reaction uncertainty at the same time.
Oil is the permission layer of physical movement.
The modern economy talks like everything is digital, but the world still moves through physical corridors. Data centers need electricity. Groceries need trucks. Armies need fuel. Factories need feedstock. Airlines need jet fuel. Farms need diesel. Cities need asphalt, plastics, lubricants, chemicals, and logistics. The digital economy did not escape the physical world. It abstracted it until the physical world broke through the interface.
That is what Hormuz represents. It is not only a chokepoint on a map. It is a reminder that the global economy is built on narrow passages, assumed continuity, and hidden buffers. When those buffers thin out, the price of movement changes. When the price of movement changes, inflation changes. When inflation changes, central-bank freedom changes. When central-bank freedom changes, liquidity changes. When liquidity changes, markets reprice the entire future.
The oil cushion is breaking because the world spent years treating energy security as an accounting line instead of a civilizational operating layer. Now the system is being forced to remember that every abstract economy still has to pass through ports, pipes, tankers, refineries, roads, and fuel tanks.
Research source map
- U.S. Energy Information Administration — “Amid regional conflict, the Strait of Hormuz remains critical oil chokepoint,” June 16, 2025.
- International Energy Agency — Oil Market Report, May 2026.
- U.S. Energy Information Administration — Short-Term Energy Outlook, May 2026.
- U.S. Energy Information Administration — Weekly Petroleum Status Report, data for week ending May 22, 2026.
- U.S. Energy Information Administration — Factors Affecting Gasoline Prices.
- Reuters — U.S. crude exports hit record high in May as Iran war tightens global oil supplies, June 1, 2026.
- Reuters — U.S. gasoline market set for fresh test after near-record stock draws, June 1, 2026.
- Reuters — Fed’s Schmid warns against viewing oil shock as transitory, May 29, 2026.
- International Monetary Fund — “Coping and Thriving in a Fluid World,” March 9, 2026.
- Federal Reserve History — Oil Shock of 1973–74.
- U.S. Department of State, Office of the Historian — Oil Embargo, 1973–1974.
- OPEC — Annual Statistical Bulletin 2025, world proven crude oil reserves.
- Reuters — Goldman says global oil stocks approaching eight-year low, May 2026.
- Reuters — U.S. crude exports hit record high in May as Iran war tightens global oil supplies, June 1, 2026.
- Reuters — U.S. gasoline market set for fresh test after near-record stock draws, June 1, 2026.
- Chron / Houston Chronicle — Exxon executive warns oil inventories are nearing “unheard of” lows, May 2026.
- Financial Times — Chevron CEO warns oil prices to jump over summer as supplies dwindle, May 2026.
- Reuters — Fed’s Schmid warns against viewing oil shock as transitory, May 29, 2026.
- Reuters — Fed’s Goolsbee says oil shock could exacerbate inflationary impulse, May 28, 2026.
Pattern Nexus Note: Oil does not have to disappear for the economy to break. The system only needs the remaining flexible barrels to become expensive, delayed, politicized, or trapped behind a corridor. That is what this crisis is exposing. The modern world still talks like energy is a commodity. The real economy treats it like permission to move.
Frequently Asked Questions
What's Your Reaction?
 Like
0
Like
0
 Dislike
0
Dislike
0
 Love
0
Love
0
 Funny
0
Funny
0
 Wow
0
Wow
0
 Sad
0
Sad
0
 Angry
0
Angry
0

Founder of Pattern Nexus. I research markets, macro, geopolitics, AI, history, ancient systems, and the patterns most people overlook. I’m also building Market Radar, a trading scanner designed to read pressure, risk, confirmation, and setup quality before chasing a move. Pattern Nexus is where I connect the dots between data, history, technology, and the bigger system playing out around us.













Comments (0)