
Market Wrap – November 19, 2025: Nvidia Crushes Earnings, AI Flywheel Accelerates, and the 10-Year Tightens Again
Nvidia crushed earnings and boosted guidance, but stocks barely moved as the 10-year pushed toward 4.15% and Fed minutes signaled caution. Full Pattern Nexus analysis.
Market Wrap – November 19, 2025: Nvidia Smashes the “AI Bubble” Story While the 10-Year Tightens the Screws
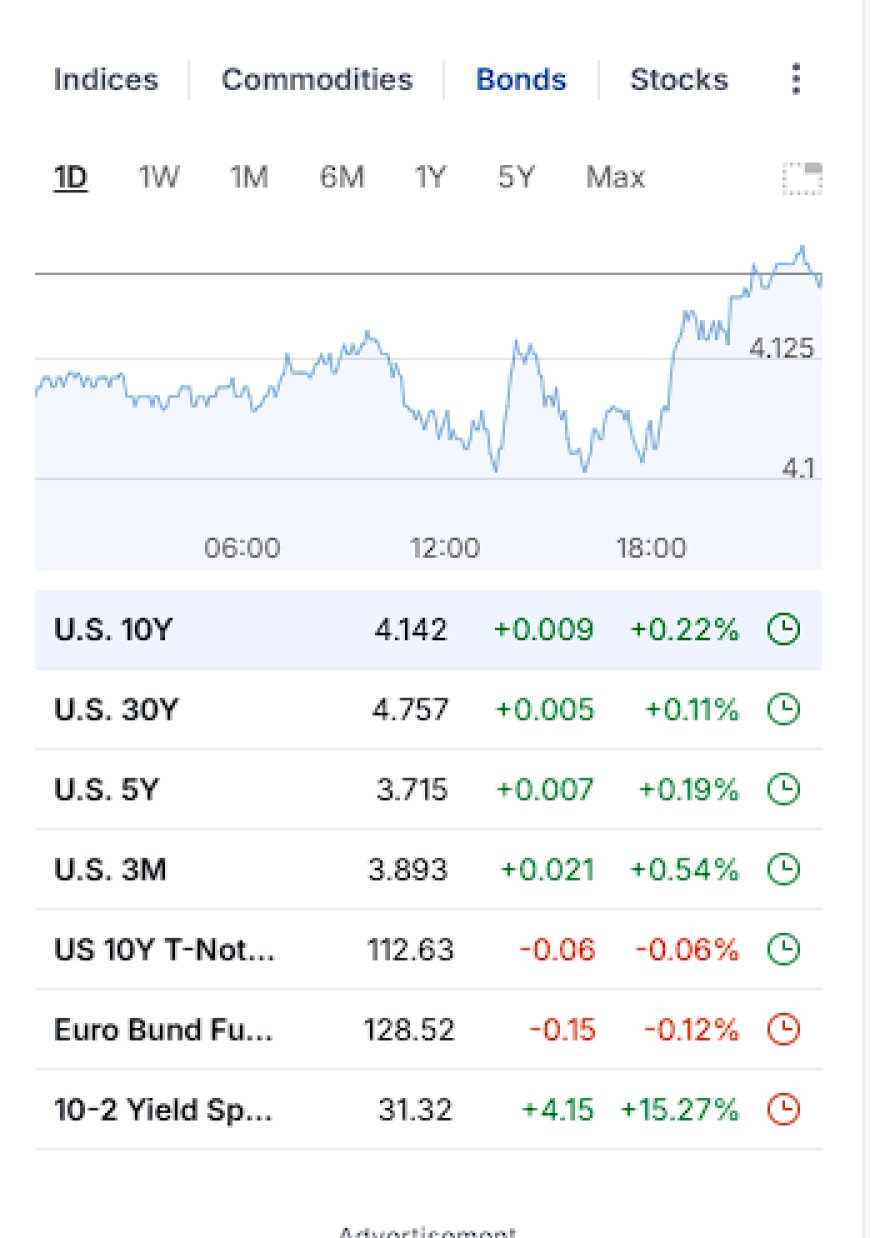
Nvidia blew past earnings expectations and raised guidance into 2026, directly pushing back on the “AI bubble” narrative. Fed minutes and new balance-sheet talk hinted at caution on cuts. And yet, despite all that “good” news, stocks only managed small gains as the 10-year Treasury yield pressed back toward the 4.10–4.15% band, tightening financial conditions and making sure nobody parties too hard.
Cross-Market Snapshot – Green, but Reluctantly
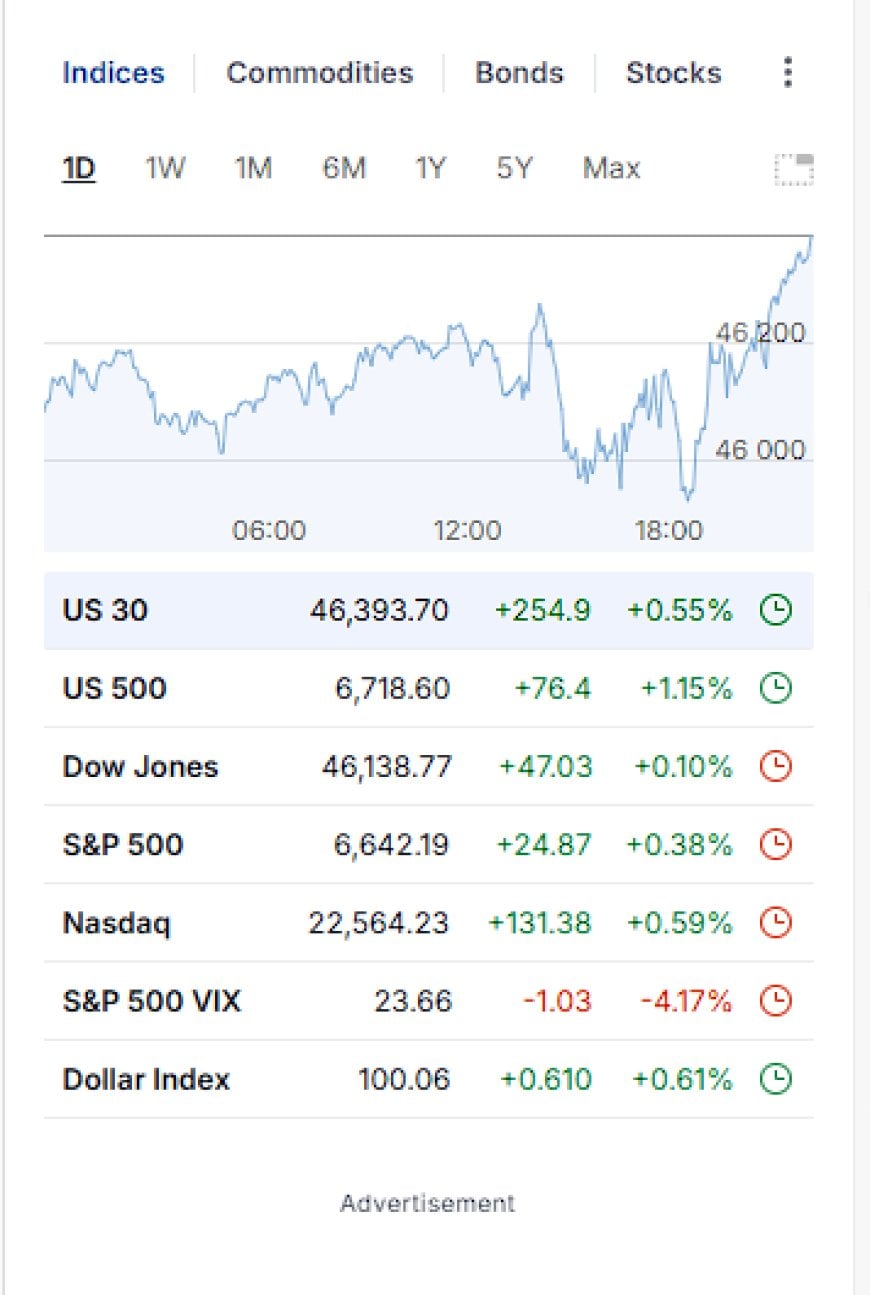
On the surface, today will go down as a “green” day for U.S. equities, but the tone underneath the headlines was more cautious than celebratory. The S&P 500 added roughly half a percent, the Nasdaq gained a touch more, and the Dow only managed a marginal uptick. That is not how markets normally behave when one of the most important companies in the world just crushed earnings and raised forward guidance into an already hyped AI cycle.
Instead of a clean risk-on surge, what we actually saw was a market that was willing to reward good news selectively while still respecting higher yields and a Federal Reserve that is clearly not in a rush to re-open the liquidity firehose. Breadth tells the real story. Even as the Nasdaq printed a respectable gain, decliners still outnumbered advancers. Under the hood, there were plenty of single-name blowups and intraday reversals, especially in smaller and more speculative tech. That is classic late-cycle behavior: capital concentrates in the clearest structural winners, while everything else trades like a liquidity experiment.
The dollar index spent the session firming up near the high-90s to 100 zone, and the VIX compressed back into the low-to-mid-20s. That combination—slightly stronger dollar, softer volatility, and only modest equity gains—looks less like a melt-up and more like a market trying to normalize after a rough stretch, without truly letting its guard down.
If you zoom out over the last week, this fits neatly into the pattern we have been tracking in recent wraps. Equities are no longer trading like they are desperate for a Fed rescue next month; instead, they are trying to price an economy that is not falling apart, an AI buildout that is very real, and a rate structure that refuses to drift back to the pre-2022 fantasy world.
Today’s tape sat right at the intersection of those forces.
Nvidia – Earnings, Guidance, and the “AI Bubble” Debate

The main macro event of the day was not a data release, a Fed speaker, or a political headline—it was Nvidia reporting another monster quarter from the center of the AI buildout. Revenue once again came in ahead of already elevated expectations, and the company raised guidance for the coming quarter into 2026.
The core of the story has not changed: almost all of the incremental growth is coming from the data-center segment, which now dominates the company’s revenue mix. A huge share of each new dollar is ultimately tied to AI training and inference capacity, whether for cloud hyperscalers, enterprise buildouts, or government and sovereign AI projects.
The guidance line matters more than the historical numbers. Management essentially told the market that they see demand for AI compute staying strong enough to support another big step-up in revenue, not just a plateau at current levels. That is the opposite of what a classic late-stage bubble looks like. In a bubble, you typically see explosive past growth, overly optimistic expectations, and then a guide that comes in cautious or flat because the easy gains are gone and the incremental buyer is exhausted. What Nvidia just printed looks much more like an early-to-mid-cycle industrial buildout: huge capex needs, big orders booked ahead of time, and a supplier base racing to keep up.
This is where the Pattern Nexus “AI-industrial flywheel” framework comes in. Nvidia is no longer just a chip designer. It is one of the central toll booths of an emerging industrial system built on dense compute, high-voltage power, cooling, and networked data.
Each successive quarter of strong data-center growth does more than justify Nvidia’s valuation; it reinforces the idea that we are building a new layer of economic infrastructure, similar in importance to the highway system or the early internet backbone. The earnings beat today is not just a story about one company; it is confirmation that entire balance sheets—corporate, sovereign, and financial—are being reorganized around compute and power.
Importantly, the company and the market are both aware of the “AI bubble” narrative. Management spent time arguing that we are still at the early stages of adoption, not the end, and options markets heading into the print were pricing a major swing in market cap either way. The fact that the result landed on the bullish side of that binary while the broader indices only moved modestly tells you something crucial: investors believe the AI thesis, but they also understand that the cost of money and the price of time have fundamentally changed.
Equities – Mega-Cap AI vs the Rest of the Tape
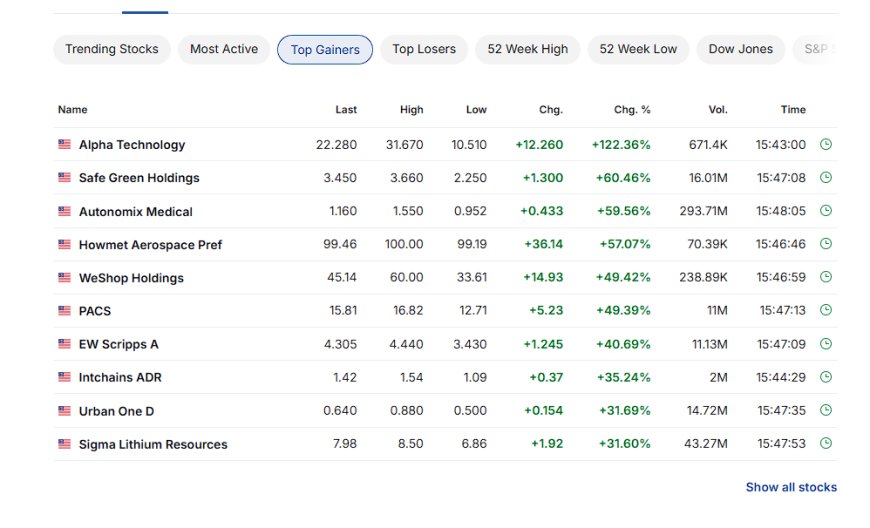
Nvidia’s stock responded the way you would expect to a clean earnings beat: it traded higher into the close and saw additional upside in post-market trading as investors processed the new guidance and the scale of data-center demand.
Other AI-linked mega-caps—Microsoft, Alphabet, Amazon, Meta, Tesla, AMD, and Palantir—also participated, but the action was choppy. Several names opened strong, faded through the middle of the session, and then clawed back modest gains. That intraday pattern is what you get when there is real demand to own the structural winners, but every uptick runs into systematic selling, options hedging, and investors using strength to de-risk.
The rest of the tape did not enjoy the same treatment. Small caps and highly leveraged companies continued to show wide intraday ranges. There were individual names that moved hundreds of percent on idiosyncratic news, while others were punished with double-digit declines on guidance cuts, margin pressure, or balance-sheet concerns. Outside of the top layer of mega-cap AI and a handful of defensive sectors, you would not look at today and call it a healthy, broad-based advance.
The market still looks like it is putting every company into one of two buckets: those that directly benefit from the AI-industrial buildout, and those that will struggle to outrun higher funding costs, slower growth, or both. Sector-wise, you can see that divide clearly. Tech and communication services were supported by the Nvidia halo and by continuing belief in the earnings power of software tied to AI. Energy and some industrials held their own, supported by the idea that power infrastructure, grid upgrades, and logistics will remain in high demand as the AI buildout continues. More rate-sensitive segments—traditional real estate, some consumer discretionary, and pockets of financials—were again more muted.
The equity market is increasingly organizing itself into an AI-and-power complex on one side and a leveraged, rate-sensitive legacy economy on the other.
Commodities – Oil Stabilizes, Gold and Silver Keep Grinding
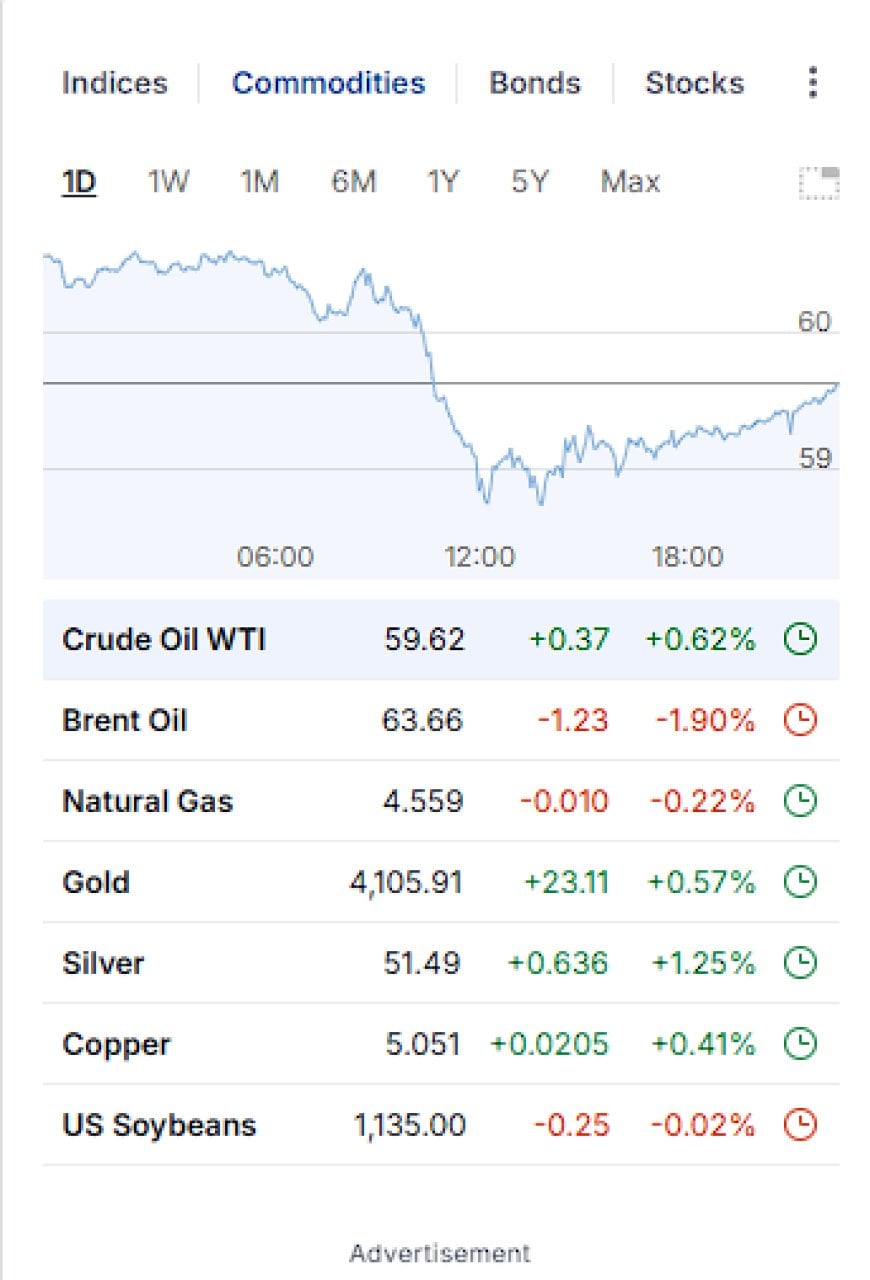
Crude oil spent the first part of the session under pressure before buyers stepped back in near the high-50s. West Texas Intermediate finished close to 60 dollars a barrel, with Brent holding in the low-to-mid-60s.
We are now firmly in a range where the oil market is trying to reconcile two competing realities. On one side, you have ongoing geopolitical risk, underinvestment in new supply, and a structural re-wiring of global trade routes. On the other, you have softer global manufacturing indicators, consumer stress in a number of economies, and the lingering fear that higher rates will eventually squeeze demand harder than expected. Today’s modest bounce is less about a new bullish thesis and more about the market acknowledging that oil at sub-60 levels is not compatible with the risk profile we actually live in.
Precious metals continue to send their own message. Gold extended its rebound, trading well above the four-thousand-dollar mark, while silver added more than a percent. This is not happening in a vacuum. Real yields remain elevated, the 10-year is pressing above 4.1%, and central banks are not exactly promising imminent, aggressive easing. Historically, that combination would be a headwind for gold. Yet the metal remains firm, and dips are being bought.
That is consistent with what we have laid out in earlier work on the gold–10-year relationship: when investors start to question the long-term sustainability of the fiscal path and the credibility of future policy, gold trades less like a simple inverse of real yields and more like an insurance policy on the entire monetary operating system.
Silver, as usual, is playing the leveraged cousin. It tends to respond both to monetary concerns and to expectations about future industrial demand, especially for energy and technology infrastructure. The fact that silver is participating here, rather than lagging badly, suggests that markets believe the AI-and-energy buildout has legs, even if global growth is uneven. In other words, commodities are not pricing a deflationary collapse; they are pricing a messy, high-capex, high-volatility transition.
Bonds & Yields – The 10-Year Tightens the Screws
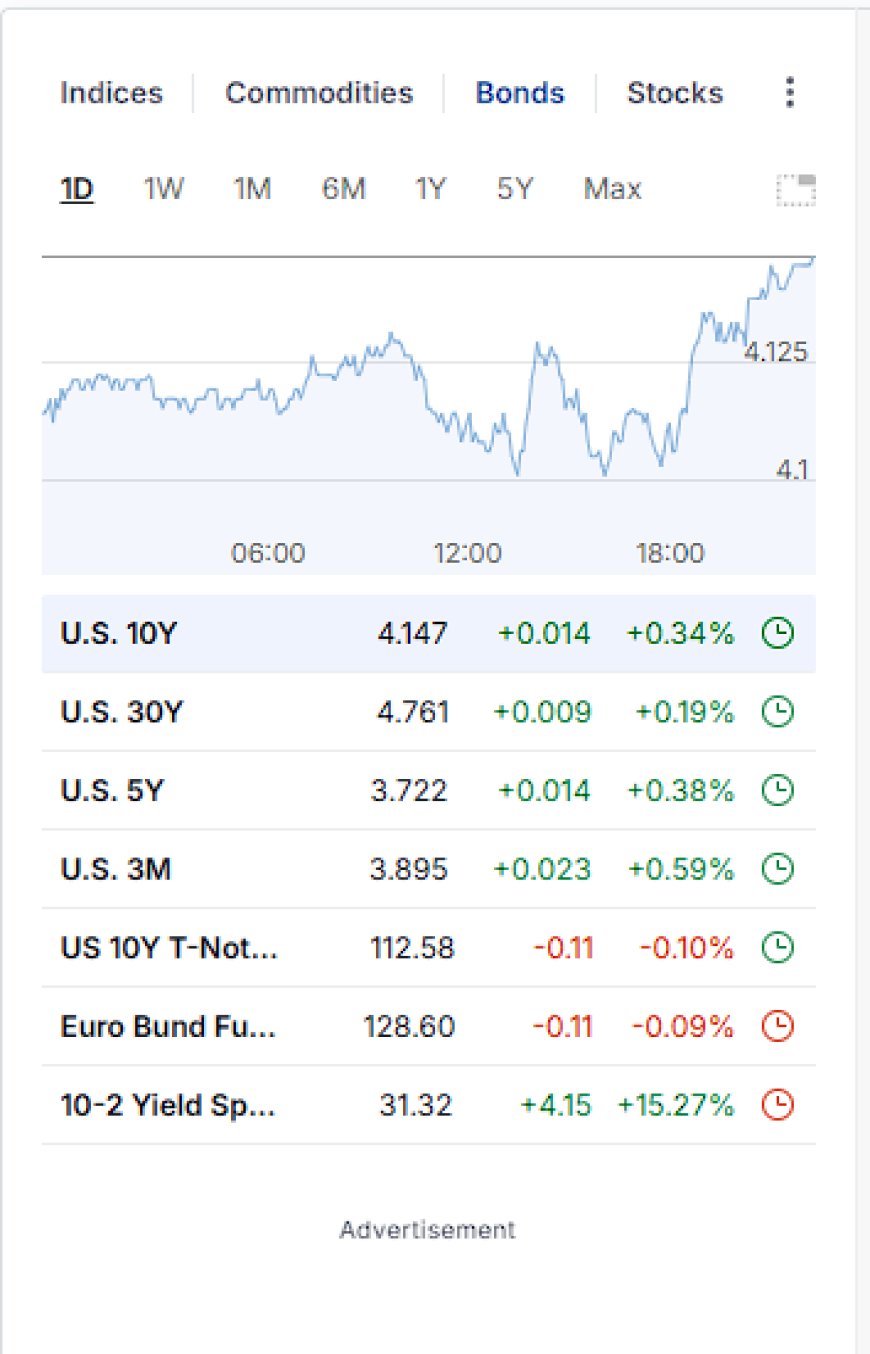
While everyone was arguing about whether Nvidia has disproved the “AI bubble” narrative, the 10-year Treasury Note quietly reminded the system that the price of time still matters.
Yields marched back toward the 4.10–4.15% zone, putting them above last week’s closes and roughly in line with the averages we have been tracking through November. That may sound like a small move in basis-point terms, but it is coming off a period where investors were hoping that the first Fed cuts would pull the entire curve lower in a straight line. What we are getting instead is a market that accepts the direction of travel—easier policy over time—but refuses to pretend the structural forces have gone away.
This is where yesterday’s discussion of the neutral rate and the “gravity zone” comes back into play. If the true neutral real rate has drifted higher, and if the market believes that neither the Fed nor the Treasury can permanently suppress that rate without creating bigger problems elsewhere, then the 10-year trading in a 3.8–4.3% range is not an anomaly; it is the new baseline.
Each time the yield dips meaningfully below that zone, fiscal reality, issuance needs, and regulatory constraints drag it back up. Every time it tries to break too far above, growth concerns and risk-off flows temporarily cap it. Today’s move toward the upper half of that band is the bond market reminding everyone that the cost of long-term capital is not going back to the 2010s.
Higher yields are not just an abstract macro input; they feed directly into valuation math, mortgage rates, and corporate funding. A 10-year that is grinding higher while equities are trying to price in explosive AI earnings is like tightening the bolts on the entire financial system.
Cash-flow streams far out in the future get discounted harder. Balance sheets that looked fine at 3% yields start to feel the pressure at 4.2% and beyond. And crucially, the government’s own interest bill scales faster, reinforcing the very fiscal dynamics that help keep the term premium elevated in the first place.
That feedback loop is why the 10-year has become the central character in almost every Pattern Nexus piece this month, and today’s tape only strengthens that role.
Fed Language – Minutes, Balance Sheets, and Plumbing
The Federal Reserve added another layer of complexity today through its official communications. The latest FOMC minutes and related reporting painted a picture of a committee that is divided on timing but broadly aligned on one key idea: this is not a moment for aggressive easing.
Many policymakers expressed discomfort with cutting too quickly, worried that inflation progress could stall or reverse if financial conditions loosen too much. At the same time, there is little appetite for renewed hikes unless the data genuinely re-accelerate. The result is a familiar but important message—higher for longer in practice, even if the exact path of policy rates contains a few cuts over the next year or two.
Beyond the headlines, there is a growing emphasis on the Fed’s balance sheet and the regulatory environment that governs how banks and dealers interact with the Treasury market. Officials are talking more about reserves, leverage rules, and the role of the central bank as a backstop to collateral markets. That is the language of plumbing, not just policy.
When the Fed worries about how its own portfolio, bank balance-sheet constraints, and regulatory capital frameworks intersect with record Treasury issuance, it is implicitly acknowledging that the term premium and the 10-year yield are being shaped as much by institutional design as by simple growth and inflation expectations.
Practically, this means that investors cannot simply look at the fed funds futures curve, plug it into a model, and assume that long-end yields will obediently follow. The Fed can signal cuts and still preside over an environment in which the 10-year refuses to break lower because the system needs to attract real buyers for massive government borrowing.
That is exactly what we saw today: soft talk about future easing coexisting with a 10-year that is moving higher, not lower. The minutes and speeches are confirming what the bond market has been hinting at for weeks—that policy rates and balance-sheet policy are now inseparable from the mechanics of funding the state.
Crypto – Still Just High-Beta Macro in Disguise
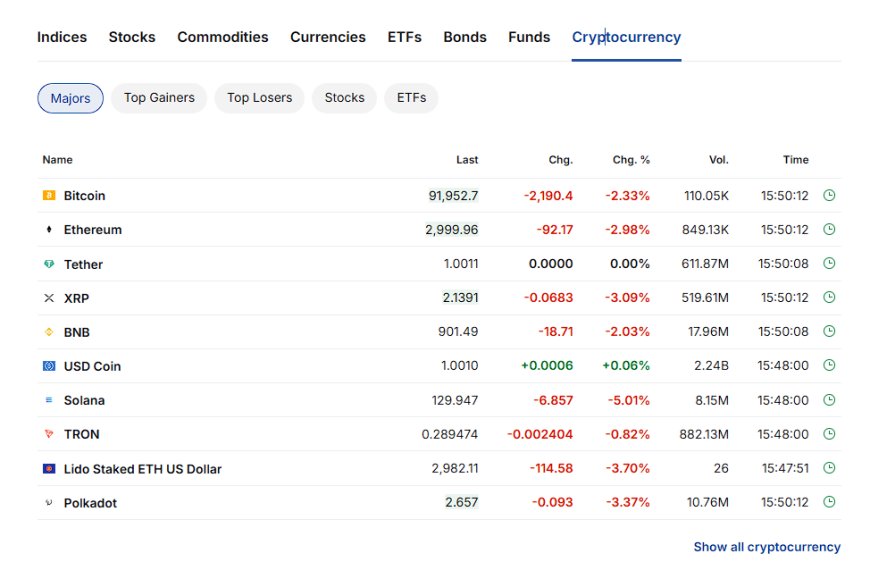
Bitcoin spent the day pinned in the low-90-thousand range, with intraday prints slipping below ninety-two thousand and a tone that felt more defensive than opportunistic.
Ethereum underperformed slightly, giving back a couple of percent, and the broader alt-coin complex followed the same script: weakness on days when yields rise and the dollar firms, modest relief when those pressures ease. In other words, crypto continues to behave like a leveraged expression of global risk appetite rather than a clean, idiosyncratic asset class.
The narrative backdrop is also familiar. You can find plenty of commentary framing the current drawdown as just another cyclical reset in a long bull market, and just as many voices arguing that high prices have already priced in the halving cycle, ETF flows, and much of the institutional adoption story. What matters for our purposes is simpler: as long as the 10-year is pressing higher and liquidity conditions are tightening at the margin, every speculative asset that depends on abundant collateral and cheap leverage is going to feel heavier. Bitcoin is no exception.
The fact that price action is still closely synchronized with tech and growth stocks tells you that, in practice, crypto is trading inside the same macro regime as everything else. Longer term, there is a plausible argument that the tokenized-collateral world and the AI-industrial world are going to intersect in a much deeper way than markets currently realize. But today’s tape is not that future. Today’s tape is about traders de-risking when yields rise, rotating back in when they get a little relief, and using crypto as just another vehicle for that trade.
Structural Pattern – AI-Industrial Flywheel vs the Price of Time
Put all of this together and you get a very clean snapshot of the regime we have been mapping since the launch of the AI-Industrial Flywheel framework.
On one side, you have Nvidia and the broader AI complex proving, quarter after quarter, that demand for compute, data, and power is not a meme; it is a re-wiring of the real economy. Data-center revenues grow at eye-watering rates, capex plans from hyperscalers keep ratcheting higher, and the physical footprint of AI—servers, substations, nuclear approvals, transmission lines—expands into a genuine industrial base. That is the growth engine.
On the other side, you have a sovereign balance sheet that is already stretched, a Treasury market that needs to digest enormous issuance, and a central bank that is trying to normalize policy without destabilizing the entire scaffolding. That is the constraint. The result is a tug-of-war between exponential-looking growth stories and a structural increase in the cost of capital.
The 10-year yield is where that tension gets priced. Every time the AI story gets stronger, the implied earnings and cash-flow streams far into the future get larger, but so does the need for funding, infrastructure, and policy support. That pushes up the term premium and keeps the long end from collapsing, even if policy rates edge lower.
Today was almost a textbook illustration of this dynamic. The system effectively threw a party for Nvidia’s earnings—it bid up the stock, validated the AI thesis, and rewarded the companies most plugged into that buildout. But at the exact same time, the 10-year quietly moved higher, tightening financial conditions at the margin and reminding everyone that there is a hard limit to how much multiple expansion you can squeeze out of long-duration assets when time itself is more expensive.
The equity market ended green, but not euphoric. The bond market ended firmer, but not panicked. That is exactly what a regime of AI-driven growth colliding with fiscal and monetary gravity should look like.
The broader Pattern Nexus storyline here is that we are not choosing between “AI boom” and “bond market revolt.” We are living in the overlap. AI is driving a new industrial super-cycle at the same time that the sovereign balance sheet and the term structure of interest rates are re-pricing upwards. The task for investors—and really, for policymakers—is not to bet on one side or the other, but to understand how those forces interact over years, not weeks.
Today’s little slice of tape was one more data point in that bigger, messier transition.
Key Levels I’m Watching
Against that backdrop, a few levels remain front and center on my screen:
- 10-Year Treasury: The 4.0–4.25% band is the core “gravity zone” for now. Repeated closes above roughly 4.15% are a signal that the market is leaning toward a stickier term premium and a slower path to easier financial conditions. Sharp moves toward 4.25% and beyond will hit valuations quickly and force a repricing in anything that lives off cheap duration.
- S&P 500: As long as the index can hold above the mid-6,000s, the story is still “orderly consolidation after a strong run.” A decisive break below that region would be the first real technical confirmation that the market is no longer willing to look through higher yields in exchange for the AI growth story.
- Nasdaq: The recent lows in the 22,300–22,500 neighborhood line up with key short-term support. Holding that band keeps the narrative of a healthy, if choppy, AI-led bull phase intact. Losing it opens the door to a deeper de-rating of high-multiple growth.
- Nvidia and the AI Complex: As long as Nvidia holds post-earnings gains and other AI infrastructure names do not immediately roll over, the AI-industrial thesis keeps its momentum. A post-earnings fade across the complex would send a very different signal about investor tolerance for valuation risk in a higher-rate world.
- Bitcoin: The ninety-thousand area remains a psychological pivot. Trading comfortably above that level is consistent with “controlled deleveraging” in a still-bullish long-term story. A clean break below, especially if it coincides with another grind higher in yields, would signal that the latest leg of the crypto cycle is undergoing a more serious reset.
What Comes Next
Over the next few sessions, the question is not whether Nvidia proved that AI is real. The numbers have already answered that.
The real question is whether equities as an asset class can outrun a 10-year yield that keeps drifting higher while the Fed moves cautiously and the fiscal math gets harder. If the long end backs off a bit and settles closer to 4.0%, today’s earnings print becomes rocket fuel for the AI trade and for risk assets more broadly.
If, instead, we see the 10-year grind toward 4.25% and stay there, the system is going to re-test how much investors are willing to pay for long-duration growth stories in a world where every year of time is simply more expensive.
In that sense, today was not an endpoint; it was a checkpoint. The AI-industrial flywheel is still spinning faster. The fiscal-monetary scaffolding around it is still under strain. The 10-year remains the balancing mechanism between those forces.
My playbook remains the same: watch the 10-year first, AI capex and data-center signals second, everything else after that. The next big move in this regime will not come from a single headline; it will come from the way those pieces line up over weeks and months.
Today’s tape just gave us a clearer view of the battlefield.
Pattern Nexus Lens – How I’m Reading Today’s Tape
If you strip away the noise and look at today through the Pattern Nexus lens, three big signals stand out: the durability of the AI-industrial flywheel, the refusal of the 10-year to “behave,” and a market that is trying to reconcile those two realities without breaking.
First: Nvidia’s quarter is not just an earnings beat; it is a balance-sheet reset for the AI era. When data-center revenues explode and forward guidance steps higher again, it tells you that the capex machine behind AI is still accelerating. That’s not what the top of a speculative bubble usually looks like. It is what the middle of an industrial buildout looks like.
In the Pattern Nexus framework, that matters because it confirms that “AI” is not just a theme or a sector. It is becoming the organizing principle for how capital gets allocated, how grids get expanded, how regulatory fights get framed, and how sovereigns think about competitiveness. Days like today are the market’s way of acknowledging that the AI-industrial spine is real, even when it refuses to give you a straight-line melt-up.
Second: the 10-year grinding back into the 4.10–4.15% band is the system flashing a quiet warning. It’s not screaming “crisis,” but it is saying: “Do not confuse a handful of future cuts with a return to 2015 money.”
From this lens, the 10-year is not misbehaving—it is doing exactly what you would expect in a world of structural deficits, heavy issuance, regulatory bottlenecks, and a gigantic capex cycle that needs funding. Every uptick in AI and infrastructure ambition bleeds back into the term structure. The tape is telling you that you can have AI, or you can have permanently cheap duration, but you probably cannot have both at the same scale forever.
Third: the market’s “green but reluctant” close is exactly what an overlapping regime change looks like. AI wants to pull valuation and capex forward. The bond market wants to push discount rates and risk premia higher. The result is not immediate collapse or euphoric escape velocity—it is this kind of grinding, conflicted tape where mega-cap winners levitate while everything else fights gravity.
This is why I keep coming back to the idea that we are living in the overlap, not choosing between binary futures. You can see the outlines of an AI-driven industrial super-cycle. You can see the outlines of a sovereign and monetary architecture that is creaking under its own promises. Instead of picking sides, the Pattern Nexus lens says: map the feedback loops. When AI capex ramps, what happens to issuance? When issuance ramps, what happens to the 10-year? When the 10-year drifts higher, what survives on the equity side and what quietly dies?
Today’s answer was simple but important. AI and power names got more runway. Long-duration speculative assets without clear cash-flow paths continued to feel heavy. The 10-year dictated the outer boundary of how excited anyone was allowed to get. If that dynamic continues, the big trades over the next few years won’t be about guessing the next Fed meeting—they’ll be about positioning on the fault line between the AI-industrial buildout and the price of time.
References & Further Reading
Pattern Nexus articles
- Market Wrap – November 18, 2025: Tech Cracks, Oil Holds, and the 10-Year Drifts But Doesn’t Break
- The Gravity Zone: How the 10-Year Treasury Revealed the Real Neutral Rate
- Gold vs. the 10-Year Yield: Why Rate Cuts and Real Yields Point to the Next Inflation Wave
- When the 10-Year Won’t Behave: Why Markets and Gold Slipped Even With a Cut Looming
- The Pivot Is Here: Rate Cuts, QT Ending, and the Setup for QE 2026
- AI Isn’t a Bubble — It’s a Monetary-Industrial Engine (AI-Industrial Flywheel)
- The Next Recession: What Outperforms and Why (2026–2030 Playbook)
External data & reporting
- Reuters – Wall Street indexes end rocky session higher; Nvidia gains after earnings
- Nvidia beats earnings expectations, even as bubble questions linger
- Reuters – Fed minutes highlight divisions and caution on future rate cuts
- Federal Reserve (FRED) – 10-Year Treasury Constant Maturity Yield (DGS10)
- Trading Economics – United States 10-Year Government Bond Yield
- CryptoRank / Bitcoin World – Bitcoin Price Plummets: BTC Drops Below $92,000 in Market Shakeup
- Morningstar / MarketWatch – Bitcoin just wiped out all of its 2025 gains: what a crypto winter could look like
Ano ang Iyong Reaksyon?
 Gusto
0
Gusto
0
 Hindi Gusto
0
Hindi Gusto
0
 Pag-ibig
0
Pag-ibig
0
 Nakakatawa
0
Nakakatawa
0
 Wow
0
Wow
0
 Malungkot
0
Malungkot
0
 Galit
0
Galit
0

Founder of Pattern Nexus. I research markets, macro, geopolitics, AI, history, ancient systems, and the patterns most people overlook. I’m also building Market Radar, a trading scanner designed to read pressure, risk, confirmation, and setup quality before chasing a move. Pattern Nexus is where I connect the dots between data, history, technology, and the bigger system playing out around us.














Mga Komento (0)