
The Wall Street Single-Family Ban: The Action, the Housing Math, and Where the Ownership Actually Sits
Trump says he will ban large institutional investors from buying single-family homes. Here’s the real housing inventory math, what share institutions actually control, where the concentration sits, and what would need to change for affordability to move.
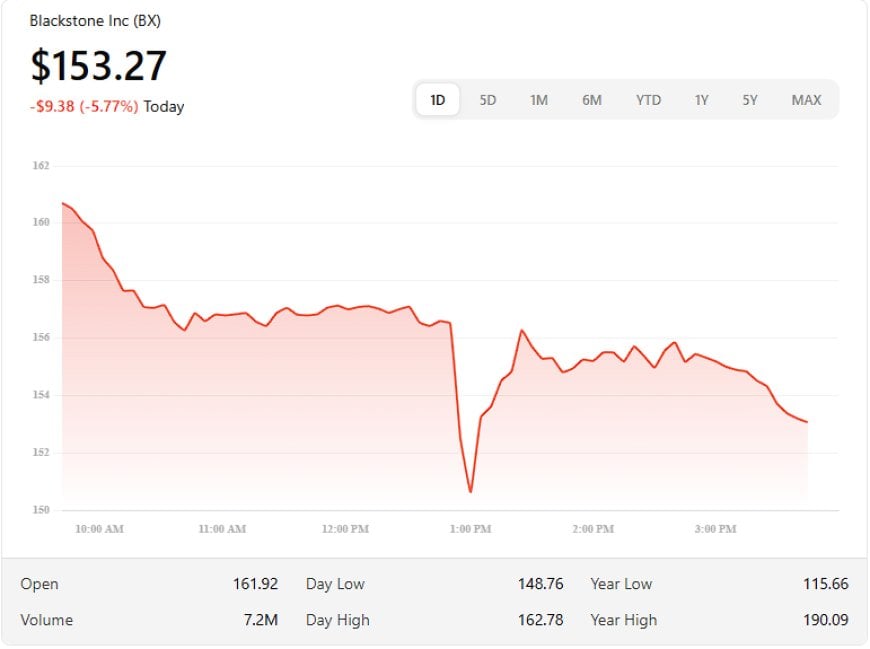

The narrative is “Wall Street vs the American Dream.” The operational reality is “which pipes can the federal layer actually turn off: agency financing, securitization access, and acquisition structures.”
Risk: if the “ban” is not tightly defined (who counts, what structures count, what about LLCs, what about build-to-rent, what about bulk trades), capital will route around it. Markets always do.
The “where” matters more than the “how many.” Institutions can be a rounding error nationally and still be a price-setter in specific SFR-heavy metros where they hold meaningful share.
What the action is (and what it isn’t)
The action being signaled is straightforward: a federal push to stop large institutions (“Wall Street”) from expanding their footprint in single-family homes. The intent is also straightforward: reduce competition against owner-occupants, cool rent inflation pressure tied to scaled SFR portfolios, and reframe housing affordability as a policy priority rather than a market inevitability.
What it is not: an instant inventory unlock. Even if acquisitions were halted tomorrow, that does not automatically create homes for sale at affordable prices. Why? Because the affordability problem is mostly a function of (1) underbuilt supply, (2) mortgage-rate lock-in suppressing turnover, and (3) local zoning constraints that restrict what can be built and where.
A “ban” is only as real as the definitions and the chokepoints behind it. Watch for: (a) how “institutional investor” is defined, (b) whether the restriction targets purchases, financing, or securitization, and (c) whether build-to-rent is treated as a carve-out or a target.
The housing inventory math: total SFH, detached, and why that matters
If you want real numbers, start here — because “Wall Street owns all the homes” is not a data statement. It’s a sentiment statement.
- Total U.S. housing units (2023): 145,333,462
- Single-unit, detached houses (2023): 88,842,258
- Single-unit, attached houses (2023): 9,125,711
- Total single-unit houses (detached + attached) (2023): ~97,967,969 (commonly summarized as “98.0 million”)
That means “single-family” (as a structure type) is the bulk of the U.S. housing stock by count. It is also the housing type most politically sensitive because it sits at the intersection of family formation, school districts, commuting access, and the wealth effect. You can’t talk about housing stability in America without talking about detached inventory.
“Single-unit structures” (Census) are a structure count (detached + attached). “Single-family rentals” (SFR) are a tenure/use category (one-unit homes used as rentals). A ban targeting institutional buying affects the flow of acquisitions into SFR portfolios — not the entire 98 million single-unit structure stock.
Institutional ownership: national share vs local control
The housing debate gets sloppy because it mixes three different categories:
- “Any investor” buying homes (includes small landlords, local LLCs, flippers, iBuyers, regional builders, etc.)
- “Large investors” (bigger regional operators)
- “Institutional” (scaled portfolios, often REIT/private equity-backed, frequently financed via securitization)
At the national level, the institutional slice of the SFR inventory is widely described as small compared to the long tail of “mom-and-pop” ownership. One congressional summary cites an estimate that small-scale investors own about 97% of the single-family rental inventory — implying about 3% institutional — while noting that definitions vary across studies.
But “small nationally” does not mean “irrelevant.” Institutional ownership changes market behavior because it is:
- More price-insensitive on acquisition (capital allocation mandates, deployment deadlines)
- More systematic on underwriting (model-driven bidding, portfolio-level optimization)
- More concentrated geographically (they cluster where the SFR model scales)
- More powerful operationally (maintenance systems, standardized fees, renewals, and eviction process machinery)
One federal review found that the five largest investors owned about 300,000 homes — roughly ~2% of single-family rental homes nationally (end of 2022). That number is not “most homes.” It is enough homes to matter in specific markets where those holdings are concentrated and where local inventory is thin.
Where the concentration sits: the Sunbelt SFR cluster
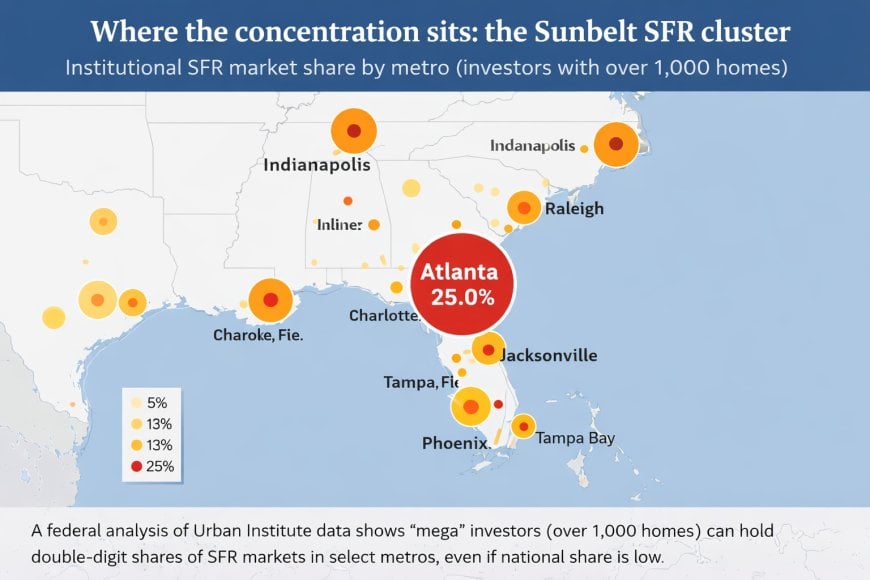
Here is the part most people miss: institutions do not need to “own America” to change outcomes. They only need to dominate the marginal buyer position in specific metros where (a) household growth is strong, (b) SFR demand is structurally high, (c) building is constrained or slowed, and (d) inventory is thin.
In the 20 largest SFR metros, one federal dataset shows investors with over 1,000 homes holding about 10.7% of the SFR market in aggregate — with major spikes in specific cities.
| Metro (MSA) | SFR market share held by investors > 1,000 homes | Estimated SFR properties owned (same group) |
|---|---|---|
| Atlanta-Sandy Springs-Alpharetta, GA | 25.0% | 71,832 |
| Jacksonville, FL | 20.5% | 17,147 |
| Charlotte-Concord-Gastonia, NC-SC | 18.3% | 24,322 |
| Tampa-St. Petersburg-Clearwater, FL | 15.3% | 22,588 |
| Phoenix-Mesa-Chandler, AZ | 13.6% | 33,406 |
| Orlando-Kissimmee-Sanford, FL | 13.2% | 17,000 |
| Raleigh-Cary, NC | 12.8% | 8,074 |
| Indianapolis-Carmel-Anderson, IN | 12.3% | 13,906 |
| Total, 20 largest MSAs for SFR | 10.7% | 354,120 |
That table is the “where.” If you’re trying to understand political pressure for a ban, look at metros where scaled buyers can be the marginal bidder — and where first-time buyers are already squeezed by rates, insurance, taxes, and maintenance inflation.
Institutional capital doesn’t have to be “most homes” to become politically unacceptable. It just has to be perceived as competing with families in the same starter-home bands — and be concentrated enough to show up in rents, renewals, and listings.
Pattern Nexus Lens
This is a control-systems fight disguised as a morality play.
The U.S. housing market is not one market. It’s a stack of markets connected by rules, financing channels, securitization pipes, and local build permissions. When a leader says “ban Wall Street,” the only way that becomes real is if you clamp the acquisition channels that feed scaled portfolios:
- Capital deployment: who can raise cash fast and keep buying through cycles
- Financing access: agency rules, bank lending posture, warehouse lines, and credit terms
- Securitization: whether scaled SFR funding remains cheap and repeatable
- Entity routing: whether the definition catches LLC shells and affiliated structures
- Local constraints: zoning and permitting that keep supply inelastic
If you don’t change supply and turnover, you can restrict institutional buying and still have unaffordable housing. But if you restrict institutional buying in the metros where they hold meaningful SFR share, you can change the marginal bid — and that’s where price behavior starts to bend.
FAQ
How many single-family houses are there in the U.S.?
Using Census structure-type inventory, the U.S. had about 98.0 million single-unit houses in 2023 (detached + attached). Of that, about 88.8 million were detached and about 9.1 million were attached.
Do institutions own “most” single-family homes?
No. Nationally, institutions are generally described as a minority share of the single-family rental inventory (not the full single-unit housing stock). The bigger issue is local concentration in select SFR-heavy metros.
Where is institutional concentration highest?
Concentration is repeatedly observed in Sunbelt SFR metros. In federal data cited for the 20 largest SFR metros, investors with over 1,000 homes show the highest SFR market shares in places like Atlanta, Jacksonville, Charlotte, Tampa, Phoenix, and Orlando.
Sources
These sources support the policy announcement context, U.S. housing inventory counts, and the institutional ownership / metro concentration data referenced above.
- Reuters (Jan 7, 2026) — Trump says U.S. will ban large institutional investors from buying single-family homes
- U.S. Census Bureau (ACS-61, Sept 2025) — Housing Availability and Affordability: 2023 (housing unit structure type totals)
- GAO-24-106643 (Accessible PDF) — Rental Housing: Information on Institutional Investment in Single-Family Homes
- CRS IF12225 (Oct 3, 2022) — Single-Family Market Rents and Institutional Investors
Disclosure: This is analysis, not financial advice.
What's Your Reaction?
 Like
0
Like
0
 Dislike
0
Dislike
0
 Love
0
Love
0
 Funny
0
Funny
0
 Wow
0
Wow
0
 Sad
0
Sad
0
 Angry
0
Angry
0

Founder of Pattern Nexus. I research markets, macro, geopolitics, AI, history, ancient systems, and the patterns most people overlook. I’m also building Market Radar, a trading scanner designed to read pressure, risk, confirmation, and setup quality before chasing a move. Pattern Nexus is where I connect the dots between data, history, technology, and the bigger system playing out around us.

















Comments (0)