
America’s New Map of Power: Mega-Regions, AI Data Centers, and the Re-Industrialization of the Midwest
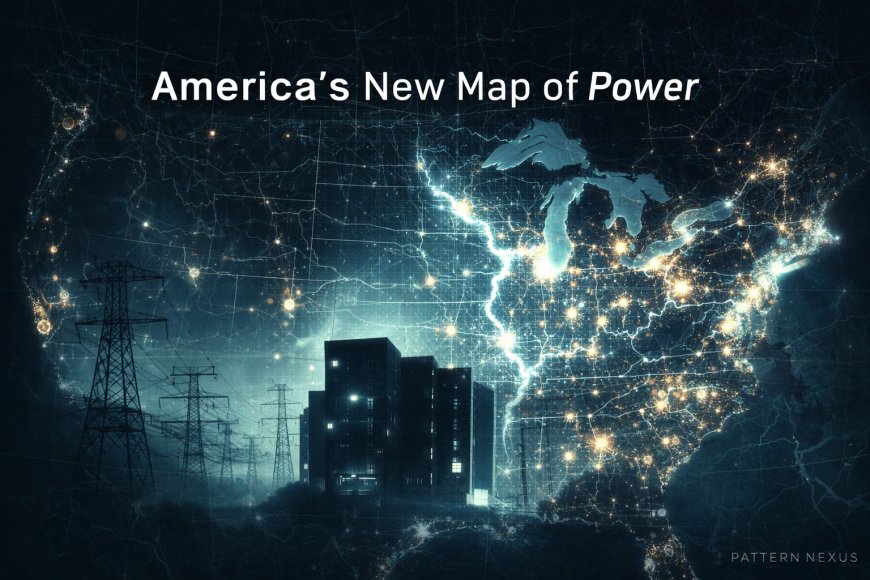
America’s New Map of Power
The AI build-out is forcing the United States to confront physical reality again: power generation, transmission, cooling water, logistics throughput, and survivability. Once you map those constraints, the outcome is not subtle. Mega-regions are being re-ranked, industrial corridors are being repriced, and the Midwest is moving from “flyover” to strategic core.
Executive Summary
Core thesis: AI is reindustrialization by another name. It converts electricity into cognition at scale, and that forces a repricing of the regions that can reliably supply power + water + land + connectivity + security.
For decades, America’s “map of opportunity” looked like a cultural map: coastal metros, finance hubs, and the consumer narrative of growth. The AI build-out flips that. It is not choosing locations based on prestige, marketing, or “innovation districts.” It is choosing locations based on constraints that cannot be negotiated away: grid capacity, cooling water, rights-of-way, latency corridors, risk surface, and physical defendability.
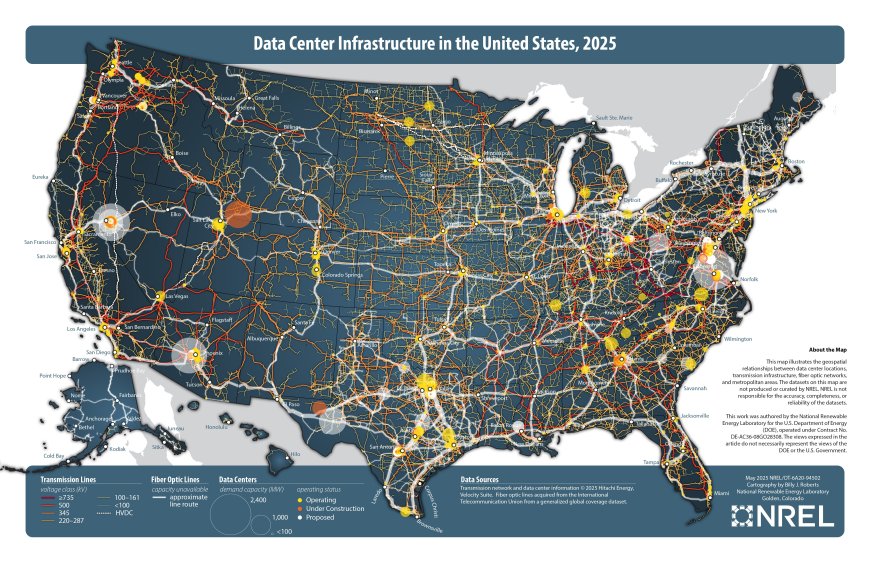
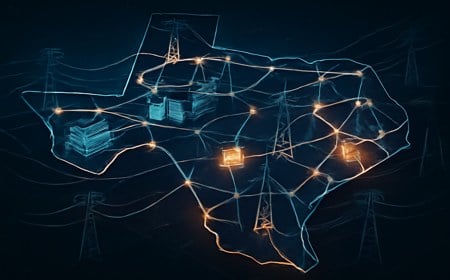
That selection process is already visible in the clustering of data centers and the accelerating competition for interconnection approvals, long-duration power contracts, and transmission upgrades. When you overlay those patterns on the U.S. mega-region map, a new hierarchy emerges: not a hierarchy of vibes, but a hierarchy of throughput.
What this piece does: It builds a first-principles model of why the Midwest is positioned for disproportionate gains in the AI era, and why the Pacific Northwest and Upper Midwest function as “fortress” regions for resilient compute.
The Midwest’s advantage is not a single factor. It is a stack: freshwater scale, inland logistics dominance, industrial zoning, energy adjacency, infrastructure depth, and geopolitical geometry. When the economy is “light,” those advantages are underpriced. When the economy becomes heavy again, they become decisive.
Bottom line: AI does not erase geography. AI punishes bad geography.
How to Read This Article
This is not a list of “best states” or “hot markets.” This is a constraint map. If you want to forecast where AI infrastructure will concentrate, you don’t start with where people want to live. You start with where the system can physically scale without snapping. Then you work outward from the constraint layer to the demographic and capital outcomes.
Signal hierarchy (PN): Power and interconnect come first. Water and land come second. Logistics and supply chain come third. Security and redundancy sit across all layers. Narrative follows last.
The Frame: Mega-Regions as Control Surfaces
Mega-regions are usually presented as urban-planning curiosities: clusters of metros linked by commuting patterns and economic spillover. That’s true, but incomplete. Under a Pattern Nexus control-systems lens, mega-regions are control surfaces that translate inputs (energy, capital, labor, logistics, information) into outputs (GDP, industrial capacity, political influence, military sustainment).
Definition (PN): A mega-region is an integrated organism whose growth is constrained and enabled by shared infrastructure and shared risk.
Not all mega-regions are the same type. Some are optimized for services and finance. Some are optimized for consumer density and port logistics. Some are optimized for energy and heavy production. The AI era increases the premium on the last category because compute is not “light.” Compute is physically anchored: it wants cheap, reliable energy; predictable operations; and resilience.
The key mistake is assuming the mega-region map is static. It is not. The map is a snapshot of a particular era’s constraints. When constraints change, the hierarchy changes. AI is changing constraints. A region can be culturally dominant yet physically constrained. Another region can be culturally ignored yet physically advantaged. In this cycle, physical advantage wins.
AI-era constraint shift: From “Where do people want to live?” to “Where can we put 500 MW to multiple GW of load, reliably, for decades, with cooling and security?”
Mega-Region vs Constraint-Region
A mega-region is a demographic and economic adjacency map. A constraint-region is a physical feasibility map. In the AI era, the constraint-region is the primary map. The mega-region map becomes a downstream effect. The winners are not the places with the most headlines; they are the places with the fewest bottlenecks.
[ PN DIAGRAM: MEGA-REGION vs CONSTRAINT-REGION ]

Mega-Region (Demand Map)
  • population density
  • metro adjacency
  • commuting patterns
  • consumer/services GDP
  → strong for “where demand is”

Constraint-Region (Supply Map)
  • MW→GW power availability
  • interconnect queue feasibility
  • cooling reliability (water / climate)
  • industrial land + zoning capacity
  • transmission rights-of-way
  • resilience + security depth
  → strong for “where supply can scale”

[ PN TAKEAWAY ]
In the AI era, supply constraints write the map.
Why U.S. Geography Made a Superpower
The United States is not a superpower because it is morally superior or historically lucky. It is a superpower because it has a world-class physical template: two ocean buffers, deep-water port capacity, an inland freshwater sea, and a navigable river spine that penetrates the continent.
Geography summary: The U.S. can move bulk commodities, energy inputs, and industrial outputs across an internal network at scale with relatively low exposure to external chokepoints.
The Great Lakes are not a scenic feature. They are an industrial moat. The Mississippi system is not a tourist attraction. It is a logistics weapon. The interior rail convergence is not a legacy artifact. It is a throughput machine. If you’re trying to understand why the Midwest was the industrial heart of the 20th century, it’s not sentiment. It’s geometry.
In a world where heavy industry was being offshored and financial returns came from paper claims, these advantages looked like “old economy.” In a world where AI forces a rebuild of physical infrastructure, these advantages become the center of gravity again. AI doesn’t replace the physical world. AI intensifies it.
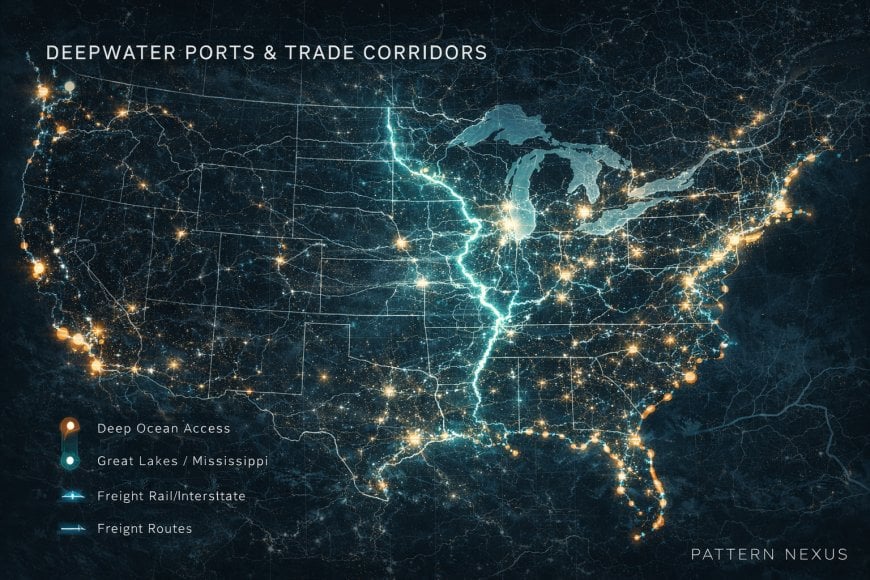
Important: AI infrastructure scales faster than housing, faster than policy, and faster than public comprehension. The regions that can absorb that scale without breaking become strategic assets.
Deep-Water Ports and the U.S. “Two-Ocean Engine”
Deep-water ports are not just trade nodes. They are power projection nodes, supply chain gateways, and economic accelerators. The U.S. is unusual because it has deep ocean access on both sides plus an internal routing machine that can push freight inland. That inland penetration matters because it allows industry to locate away from the coast while still maintaining global trade connectivity.
AI-era twist: When security and resilience premiums rise, you want more of the economy inland. But you still want ocean access. The U.S. is built for that.

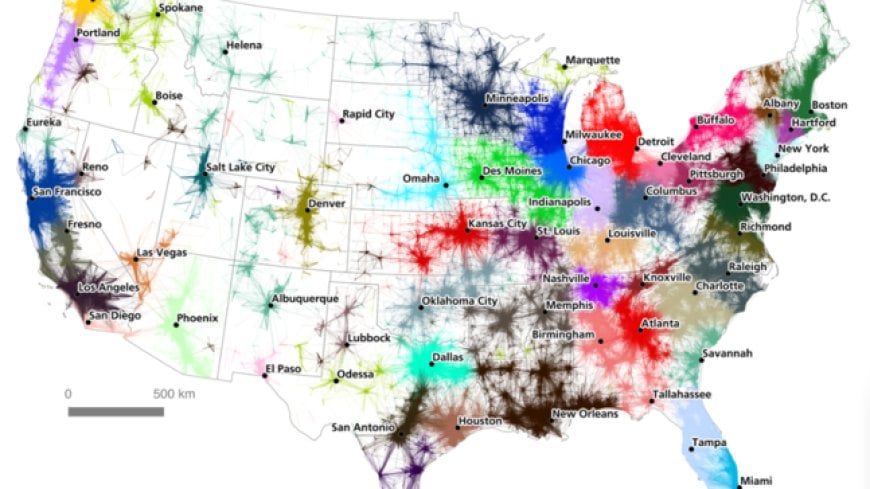
The Mega-Regions Map and What It Misses
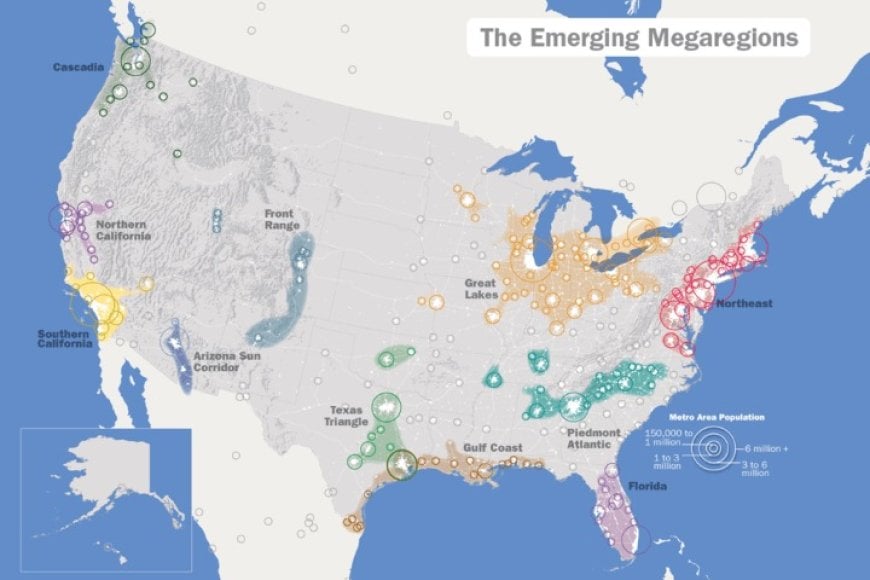
The mega-regions map is good at showing population clustering and metro adjacency. But it typically underweights: energy density, water reliability, industrial zoning, grid topology, and security depth. Those variables mattered less in a service-dominant era. They matter more now.
Reframe: The mega-region is not just “where people live.” It is “where the system can scale without snapping.”
Under this frame, the Great Lakes mega-region is not simply a set of cities. It is a continental industrial platform with freshwater, freight, and power adjacency. It is the backbone behind the backbone. If the U.S. is an operating system, the Great Lakes–Midwest corridor is a core library. You can pretend it’s optional until the workload spikes. AI is the workload spike.
Why the “Great Lakes” Mega-Region Is Underrated on Standard Maps
Standard mega-region framing often treats “Great Lakes” as a legacy manufacturing belt with mature demographics. That reads the past into the future. The AI era doesn’t ask: “Where was growth last decade?” It asks: “Where can the next decade’s constraints be satisfied at scale?” Freshwater, land, industrial corridors, and internal logistics are not a legacy story. They are a scarcity story. Scarcity stories reprice fast when the market recognizes them.
PN warning: People will keep arguing this like a cultural debate. It’s not a cultural debate. It’s a siting problem with hard constraints.
AI Is Heavy Industry Wearing a Software Costume
The public still thinks of AI as cloud apps and chat interfaces. That view is a decade behind reality. AI is a conversion machine: it converts electricity into trained models and then converts more electricity into inference at scale. The limiting factors are not “ideas.” The limiting factors are MW, cooling, transformers, substations, fiber, and permits.
Translation: AI is an industrial load growth story that happens to output software.
A modern hyperscale data center campus is comparable to a refinery, a steel mill, or a large chemical plant in terms of siting logic. That siting logic is not cultural. It is physical: where can you get uninterrupted power, massive cooling capacity, land, and redundant connectivity without fighting the entire metro area for it?
That question alone eliminates large portions of the coastal U.S. from being dominant compute destinations, even if those coasts remain important for finance, media, and executive coordination. The AI economy splits into two layers: the visible layer (apps, narratives, valuations) and the invisible layer (physical infrastructure and operational reality). Invisible-layer dominance is what creates durable power.
Key point: The “AI economy” splits into two layers: the visible layer (apps, narratives, capital markets) and the invisible layer (power plants, grid corridors, data halls, industrial supply chains). The invisible layer determines the real winners.
[ PN DIAGRAM: THE AI INFRASTRUCTURE STACK ]

          (Visible Layer: "Software")
     ┌─────────────────────────────────┐
     │  Apps • Interfaces • Services   │
     │  Media narratives • Valuations  │
     └─────────────────────────────────┘
                    │
                    ▼
          (Compute Layer: "Factories")
     ┌─────────────────────────────────┐
     │  Data halls • GPUs • Networks   │
     │  Cooling plants • Redundancy    │
     └─────────────────────────────────┘
                    │
                    ▼
     (Constraint Layer: "Non-Negotiables")
     ┌─────────────────────────────────────────────┐
     │  Power (MW→GW) • Transformers • Substations  │
     │  Transmission rights-of-way • Grid topology  │
     │  Water • Heat rejection • Permits            │
     │  Land • Security depth • Fiber redundancy    │
     └─────────────────────────────────────────────┘

[ PN TAKEAWAY ]
If you want to predict where AI goes, stop staring at the visible layer.
Map the constraint layer. The constraint layer chooses the winners.
What this implies: The AI build-out is also a grid build-out, a generation build-out, a transformer build-out, a workforce build-out, and an industrial supply-chain build-out.
Why “Latency” Doesn’t Override “Power”
You will hear a simplified argument: “Data centers need to be near users for latency.” That is true for some workloads. But AI training, batch inference, and large internal pipelines care more about reliable throughput than micro-latency. Even when latency matters, fiber routes and edge nodes can solve much of it without forcing the entire compute stack into the most constrained metros.
Rule: You can often buy latency with network design. You cannot buy 800 MW in a constrained metro without years of conflict.
AI as a Reindustrialization Trigger
When compute becomes the bottleneck, everything upstream becomes valuable again: turbines, transformers, switchgear, concrete, steel, cooling systems, industrial electricians, fiber crews, right-of-way specialists, and the bureaucratic machinery that processes permits and interconnect agreements. This is why AI is not simply “tech growth.” It is industrial growth that spills into everything. It wakes up dormant regions because the constraints force dispersion.
Power: Generation, Transmission, and the AI Load Problem
Data centers do not “use electricity.” They shape the grid. A cluster of large AI campuses is not incremental demand. It is a structural demand shock that forces: new generation, new transmission, new substations, and new redundancy.
Why the Midwest matters: It sits closer to a diversified mix of generation types and has more physical and regulatory room to build transmission upgrades than dense coastal metros.
The coastal grid problem is not a moral failure. It is geometry and congestion. Dense coastal metros have: limited land, expensive upgrades, heavy friction, complex permitting, and high legacy load. The Midwest has: more space, existing industrial corridors, and historically “overbuilt” grid and freight infrastructure relative to current narratives. That “overbuilt” legacy becomes an advantage when the workload surges.
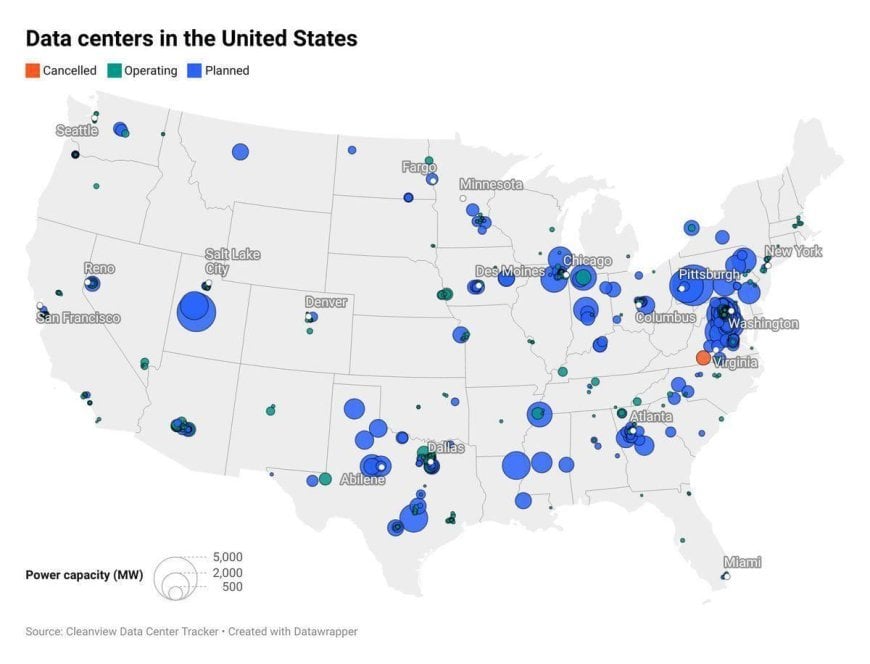
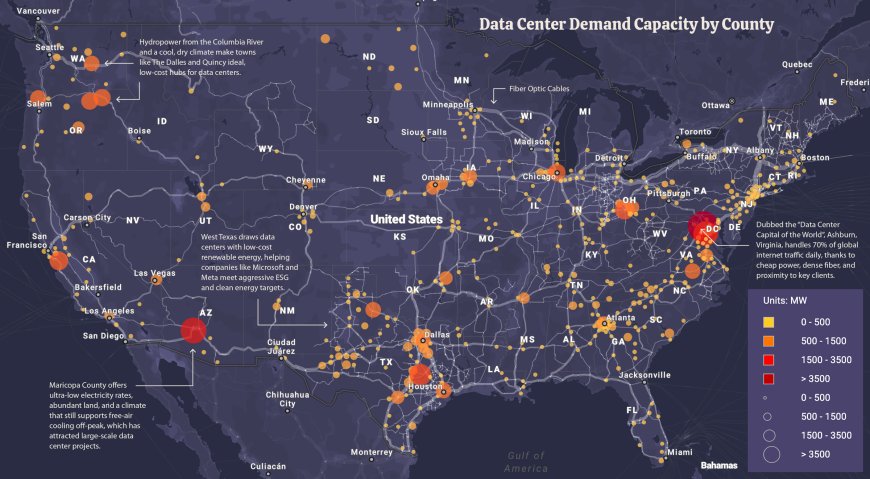
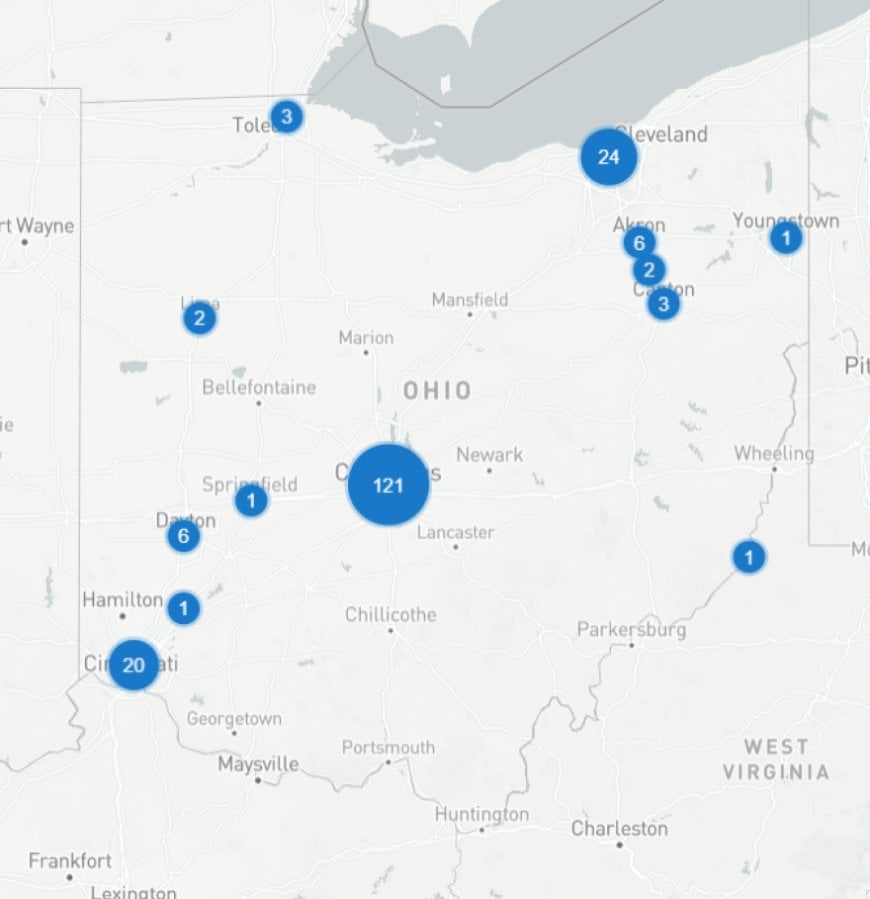
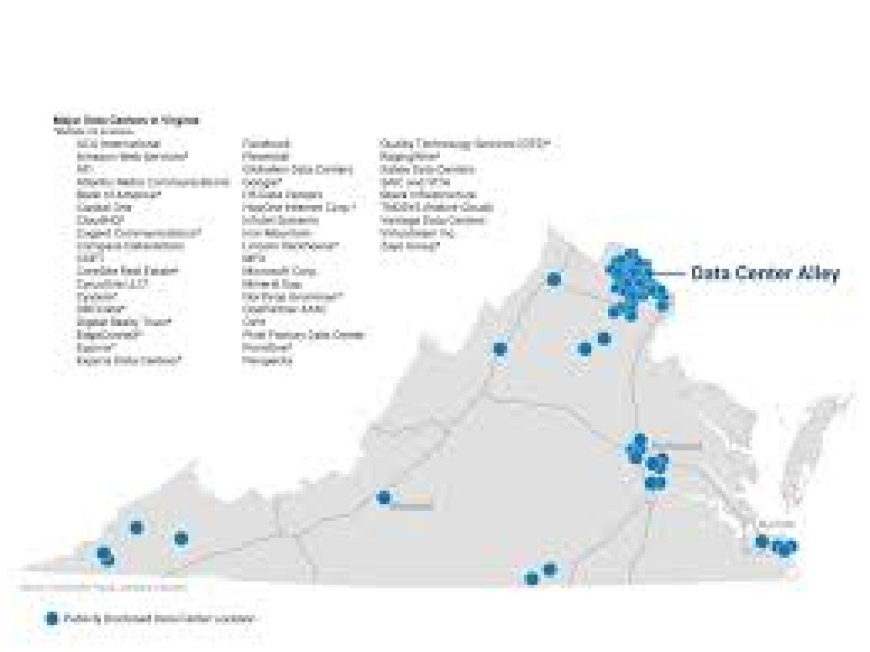
The clustering you see is not accidental. It is the physical world selecting for: access to transmission, proximity to generation, industrial land availability, and network topology. When AI load grows, these selection pressures intensify because the interconnect queue becomes the real gatekeeper. Interconnect is where “plans” meet physics.
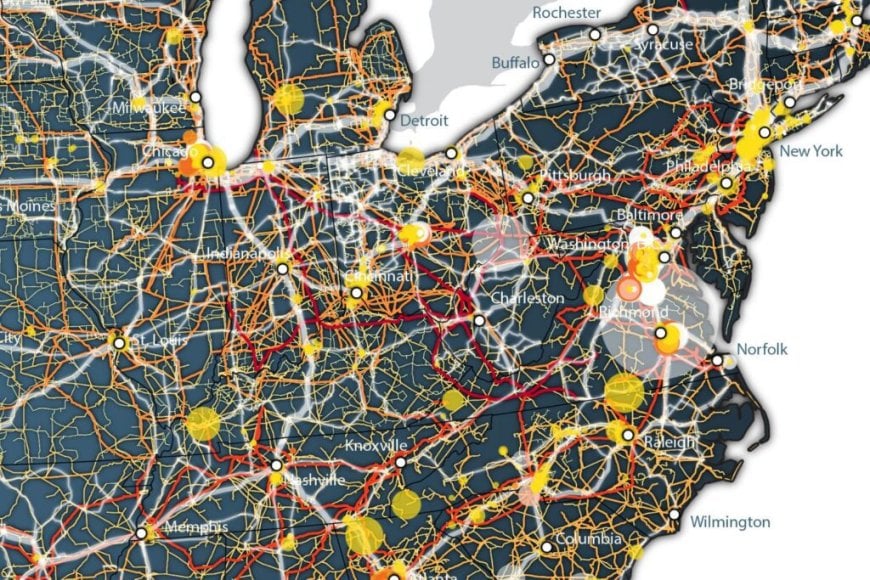
AI grid math (conceptual): If a region adds multiple 300–800 MW campuses, you are not “adding buildings.” You are adding a new class of industrial load that competes with every other user for transformers, interconnect, and reliability services.
[ PN DIAGRAM: WHY DATA CENTER LOAD IS A GRID EVENT ]

Legacy Era Demand Growth (slow, distributed)
  Homes + offices + retail + normal industry
  ─────────────────────────────────────────►

AI Era Demand Growth (fast, concentrated)
  1 campus = 200–800 MW (and scaling)
  5 campuses = "new city" load
  10 campuses = "regional grid redesign"

Where the load lands determines:
  • which substations get rebuilt
  • which transmission corridors get upgraded
  • which generators get contracted
  • which regions become strategic compute basins

[ PN TAKEAWAY ]
AI changes the grid. The grid then changes the economy around it.
The Transformer Constraint: The Quiet Bottleneck
Many people assume “power” is just generation. It isn’t. Power is a chain. The chain includes transformers, switchgear, substations, interties, and rights-of-way. Generation without delivery is stranded. Delivery without equipment is imaginary. When AI campuses scale, demand for high-voltage equipment spikes and lead times become the real throttle. This favors regions with mature utility systems and the political capacity to approve upgrades.
PN framing: The interconnect queue is the new “land scarcity.” It is where the future is rationed.
Second-Order Effects: How Grid Upgrades Rebuild Regions
Once transmission upgrades begin, you get cascading second-order effects: manufacturers want to locate near reliable power, logistics suppliers cluster, skilled labor returns, housing demand rises, tax bases improve, political influence follows. The point is not that every Midwest town becomes a boomtown. The point is that selected corridors become durable platforms for decades of build-out.
This is the flywheel: Compute build-out is the ignition. The Midwest upside is the multi-decade industrial re-clustering around the new energy reality.
Water: Cooling, Reliability, and the Great Lakes Moat
Most mainstream AI commentary avoids water because it forces the conversation back to physical scarcity. Cooling is not optional. Heat rejection is the tax you pay for computation. Regions with abundant, reliable water supplies have a structural advantage, especially as compute density rises. Even “air-cooled” strategies still collide with climate and reliability constraints at large scale.
Midwest advantage: Freshwater at continental scale, combined with industrial zoning and established utility frameworks.
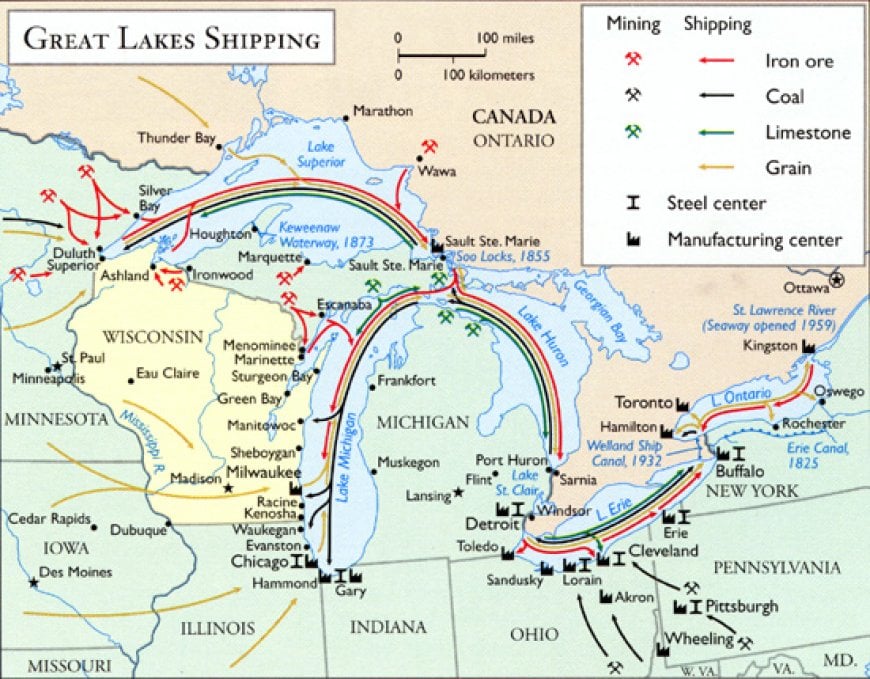
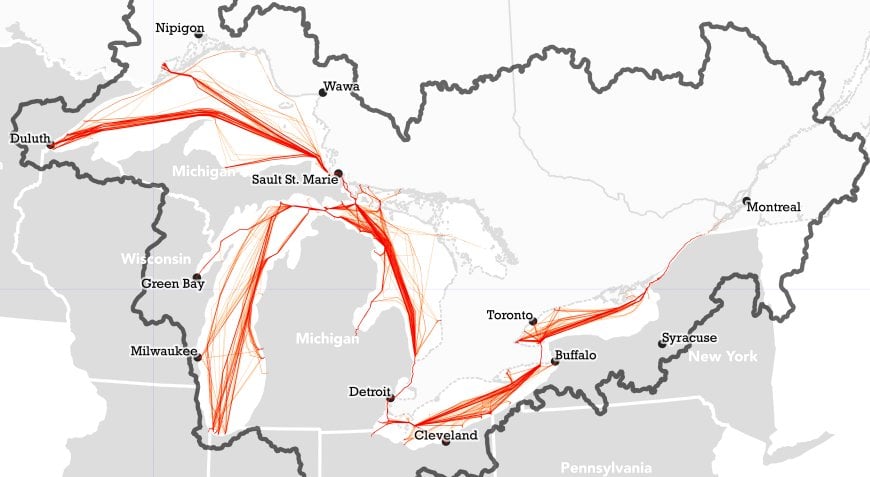
The Great Lakes region also benefits from “infrastructure familiarity.” This is not a place learning how to do heavy industry. It is a place that built heavy industry, scaled it, and understands the operational discipline that comes with it. That matters because data centers are operational infrastructure, not consumer tech. They require a culture that respects reliability.
Quiet truth: The AI future belongs to regions that can run boring, reliable, physical systems at scale.
[ PN DIAGRAM: THE COMPUTE TRIANGLE ]

          ┌─────────────────────────┐
          │         POWER           │
          │  MW→GW • Reliability    │
          └───────────┬─────────────┘
                      │
                      ▼
┌───────────────────────────────┐        ┌───────────────────────────────┐
│             WATER              │        │             LAND              │
│ Cooling • Heat rejection       │        │ Zoning • Setbacks • Security  │
│ Rights • Reliability           │        │ Expansion room                │
└───────────────────────────────┘        └───────────────────────────────┘

           [ CENTER NODE: COMPUTE ]
           Data halls • Networks • Redundancy

[ PN TAKEAWAY ]
Coastal metros often have compute demand but lack triangle balance.
The Great Lakes + Midwest corridor can balance the triangle at scale.
Cooling as a Reliability Strategy
Cooling is not only about efficiency. Cooling is about uptime. The moment a region’s cooling strategy becomes fragile under heat waves, water restrictions, or regulatory intervention, the risk premium rises. Large capital stacks do not like fragile operations. They prefer predictable basins where cooling can be engineered with margin. That is one more reason Great Lakes adjacency matters in the AI era.
Logistics: Great Lakes, Tributaries, Mississippi Spine
The Midwest is the U.S. industrial base because it sits on the most powerful inland logistics system on the planet. The Great Lakes act as an inland sea with enormous freight capacity. The Mississippi basin acts as a continental conveyor belt. Tributaries and rail networks bind it together.
Why this matters for AI: The AI build-out is also a materials and equipment build-out: steel, concrete, switchgear, transformers, backup systems, cooling equipment, and the industrial supply chain that supports them.
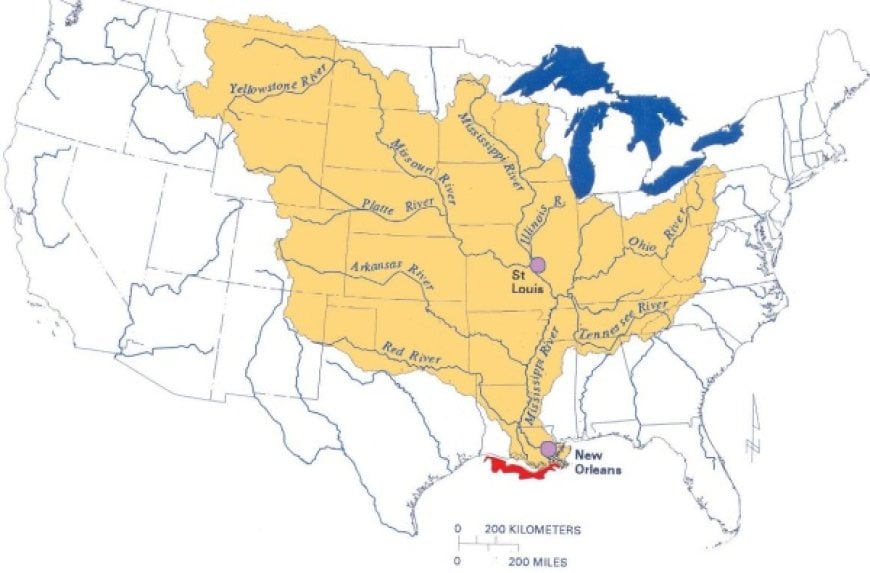
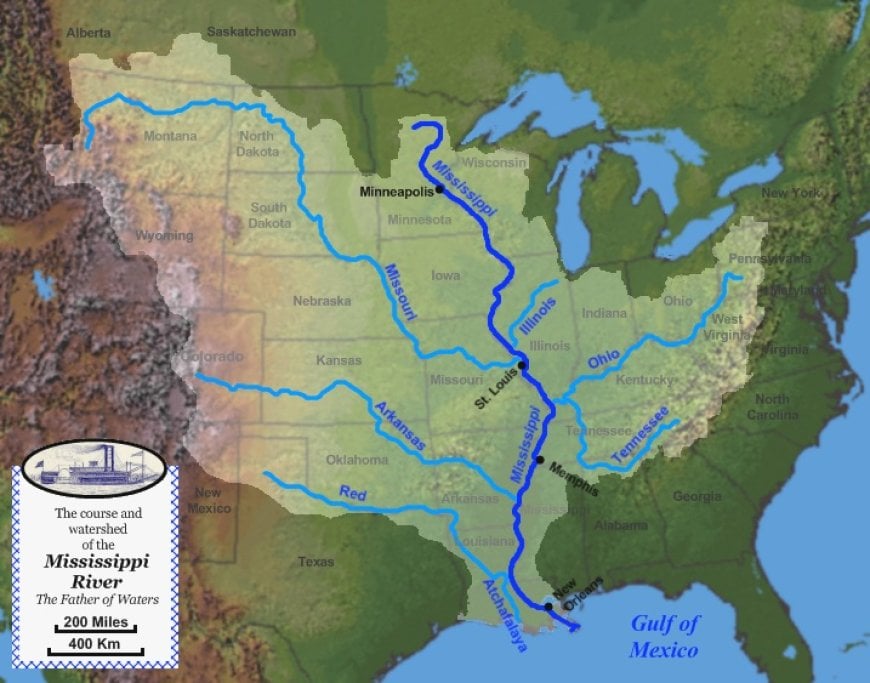
Coastal dominance depends on port throughput and global maritime stability. Inland dominance depends on internal stability and domestic routing. In an era where national security is reasserting itself and supply chains are being de-risked, the inland system becomes more valuable because it reduces exposure to external disruption while maintaining high throughput.
Reindustrialization signal: When the system wants resilience, it pays for redundancy. The Midwest is redundancy.
[ PN DIAGRAM: THE MIDWEST LOGISTICS WEAPON ]

  Great Lakes (inland sea)
      │
      │  bulk freight + industrial ports
      ▼
  Rail convergence (Chicago hub logic + regional corridors)
      │
      │  high-throughput inland routing
      ▼
  Mississippi River spine
      │
      │  barge economics + north-south conveyor
      ▼
  Gulf outlet + domestic distribution

[ PN TAKEAWAY ]
This is a continent-scale machine that lowers costs and increases resilience.
AI build-out is heavy. Heavy follows machines like this.
Industrial Clustering Is a Logistics Phenomenon
Industry clusters where inputs and outputs can move cheaply, reliably, and predictably. That’s why the Midwest became the industrial base in the first place. AI campuses add a new anchor demand that pulls suppliers and specialized labor into proximity, especially in corridors where logistics and power upgrades are already being deployed. This is how a compute build-out turns into a manufacturing and services build-out.
National Security: Defendability, Depth, and Redundancy
If you are still thinking of data centers as neutral commercial real estate, you are behind. Modern compute is a strategic asset. It hosts the models that shape economic output, security tooling, intelligence processing, and continuity capability. That shifts siting logic from “cheap land” to survivability planning.
Security frame: The most important infrastructure is increasingly the least visible. Resilient compute becomes part of the national posture.
Defendability is geometry: distance from maritime approaches, depth from borders, reduced exposure to coastal risk surfaces, redundancy across inland fiber routes, multiple power inputs and generation options, and the ability to disperse critical assets across a wider area. This is not alarmism. It is the logic of resilience.
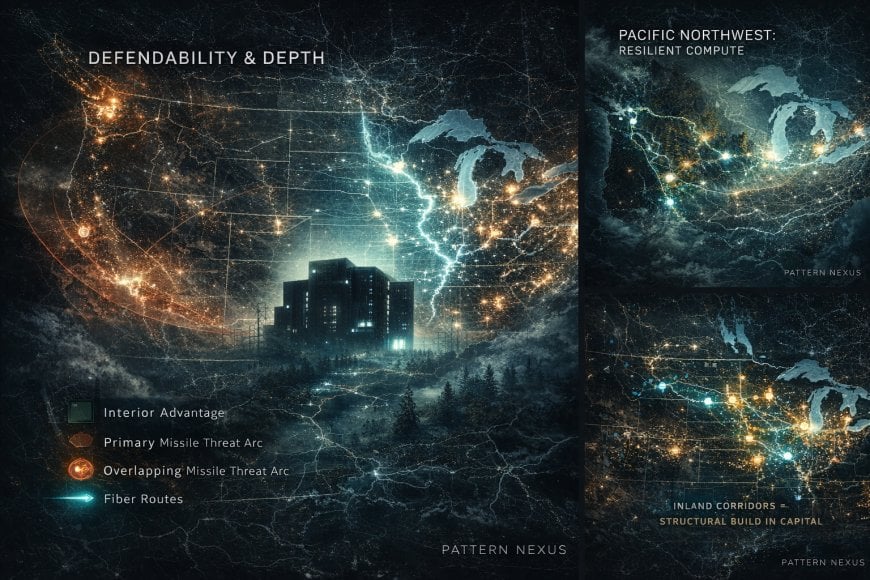
None of this requires paranoia. It requires realism. The modern economy is increasingly an information-and-control economy built on physical infrastructure. If you were designing a resilient national system, you would not put every critical node on the edges. You would put a meaningful portion of it in the interior, on redundant networks, fed by redundant power, in regions that can be secured.
Translation: The Midwest is not just an economic region. It is strategic depth.
[ PN DIAGRAM: RESILIENCE IS A STACK ]

Resilience is not "one big facility."
Resilience is dispersion + redundancy across layers.

Layer 1: Power
  • multiple feeds • multiple substations • generation adjacency

Layer 2: Network
  • diverse fiber routes • diverse peering • inland routing options

Layer 3: Geography
  • depth • reduced coastal exposure • lower congestion risk

Layer 4: Operations
  • workforce • maintenance supply chain • industrial culture

[ PN TAKEAWAY ]
Interior mega-regions score higher across the resilience stack.
Resilient Compute vs Prestige Compute
Some compute is built for brand optics and talent density. Other compute is built for uptime, continuity, and strategic durability. As AI becomes integrated into production systems and security tooling, the demand for resilient compute increases. Resilient compute wants depth, redundancy, and operational control. That is a structural tailwind for interior basins.
The Midwest Thesis: Why This Time Is Different
The Midwest has been predicted to “come back” before. Many of those predictions were nostalgia plays. This one is different because it is constraint-driven. The AI era forces build-out of systems the Midwest is already structurally designed to host.
Midwest advantage stack: Freshwater scale, inland logistics dominance, industrial zoning capacity, power adjacency, workforce lineage, and strategic depth.
For decades, the Midwest was under-allocated capital relative to its physical advantages because the dominant returns were financial rather than industrial. Capital chased liquidity, not throughput. Now throughput is back. AI is throughput. And throughput demands real-world substrate: power, water, land, logistics, and reliability.
The Midwest also benefits from a simple reality: it has room to scale. Coastal mega-regions are often mature systems with high friction for new rights-of-way, new substations, new industrial campuses, and new large-load interconnections. The Midwest contains corridors where that scaling is politically and physically easier because the region was built to host industry.
Important distinction: The Midwest doesn’t need to “become Silicon Valley.” It needs to become the energy-and-compute basin the next economy is built on.
Once you accept that, the second-order consequences are not mysterious: labor demand shifts, housing demand rises in selected metros, local service economies revive, industrial suppliers follow, regional universities and trade systems gain relevance, political attention returns. The Midwest doesn’t need the old story. It needs the new constraints.
[ PN DIAGRAM: THE MIDWEST AI-INDUSTRIAL FLYWHEEL ]

(1) Large-load interconnect approvals
        ▼
(2) Data center campuses + grid upgrades
        ▼
(3) Generation build-out + transmission corridors
        ▼
(4) Industrial suppliers cluster (transformers, switchgear, metals, concrete)
        ▼
(5) Workforce returns and trains (skilled trades + engineering)
        ▼
(6) Housing + local services repriced upward in targeted metros
        ▼
(7) Tax base improves → infrastructure upgrades accelerate
        ▼
(8) Region becomes a durable national platform, not a cycle trade

[ PN TAKEAWAY ]
The first campus is a project.
The fifth campus is a regional transformation.
The Dormant-Value Mechanism
The Midwest’s “underperformance” over prior decades is often described as decline. Under a constraint lens, much of it was a mispricing: the region’s physical advantages remained, but capital preferences shifted toward financial assets and coastal concentration. AI reverses that preference because it forces capital to buy the substrate again. Dormant substrate becomes valuable when demand returns to physical reality.
PN phrasing: This is not a “comeback.” This is a repricing of ignored advantages once the constraint regime changes.
Pacific Northwest + Upper Midwest: The Fortress Zones
The Pacific Northwest is not a copy of California. It is a different machine. It has a unique combination of energy availability in certain corridors, cooler climates that reduce cooling penalties, and geographic depth that supports resilience. Pair that with the Upper Midwest and Great Lakes region and you get a continental resilience band: water is abundant, industrial land exists, grid topology can be upgraded, and risk is distributed across interior depth.
Fortress logic: When compute becomes strategic, regions that can host resilient infrastructure quietly accumulate power.
Key distinction: Coastal consumer dominance is not the same as strategic infrastructure dominance. The fortress zones win on the invisible layer.
Why “Resilient Compute” Concentrates Differently than “Tech Culture”
Tech culture concentrates around talent density, capital, and social networks. Resilient compute concentrates around constraints: interconnect feasibility, operational stability, climate/cooling margin, security depth, and redundancy. Those two maps overlap sometimes, but they do not have to. In the AI era, the resilient compute map becomes more important than the culture map.
Capital Positioning: Why Institutions Are Rotating Inland
Institutional investors do not need a cultural narrative to move. They need: interconnect pipelines, zoning signals, utility partnerships, long-duration contracts, and predictable political conditions. That is how you position ahead of a build-out that takes years to permit and decades to amortize.
What they’re buying: Not just buildings. They’re buying future constraint relief: land with power adjacency, industrial corridors with rights-of-way potential, and water-reliable basins.
You can think of this as a new kind of land grab. In the 1800s, control was rail and river access. In the 1900s, control was oil and highways. In the AI era, control is grid interconnect + generation contracts + cooling capacity + security depth. Whoever controls the constraint relief controls the next layer of growth.
Midwest upside profile: Lower baseline valuations + high strategic relevance = non-linear repricing when the cycle shifts to infrastructure dominance.
What Institutions Track That Retail Misses
Retail tends to track price and narrative. Institutions track permits, interconnect, utility memorandums, rights-of-way, and workforce pipelines. The reason the Midwest and select interior corridors look “sudden” to most people is because the public sees the final result, not the years of infrastructure positioning that preceded it.
[ PN DIAGRAM: WHAT THE SERIOUS MONEY TRACKS ]

Retail tracks:
  • headlines • stock charts • “where people are moving”
  • hype cycles • celebrity CEOs • culture narratives

Institutions track:
  • interconnect queue position
  • power purchase agreements (duration + price + reliability)
  • transmission corridor build-out
  • industrial land entitlement + zoning
  • water reliability and regulatory risk
  • tax and permitting stability
  • redundancy (power + fiber + geography)

[ PN TAKEAWAY ]
If you want to see the next map, watch the constraint paperwork.
Scenarios: 2025–2045 Outcomes
No serious model pretends the future is singular. What matters is the scenario set and the constraints common to all of them. Here are three scenarios that bound the likely outcomes, with shared structural conclusions.
Shared constraint across scenarios: AI load growth forces grid and generation build-out. Regions that can absorb it become the new basins of economic gravity.
Scenario A: Managed Expansion (Most Likely)
The grid expands unevenly, with intense build-out corridors where utilities and regulators move fastest. Data centers cluster, manufacturing suppliers follow, and selected Midwest metros experience sustained wage and housing repricing. Coastal regions remain culturally dominant but become increasingly constrained by power friction and cost structure. This scenario produces a “barbell economy”: visible-layer dominance remains coastal, invisible-layer growth shifts inland.
Scenario B: Security-Driven Localization (Higher Geopolitical Stress)
National security priorities accelerate interior compute basins. Supply chains localize more aggressively, and resilient infrastructure is treated as a strategic asset. The Midwest and Pacific Northwest gain even more relative advantage because the selection function shifts toward depth, redundancy, and controllable internal routing. In this scenario, resilience becomes a formal procurement preference, not just a private-sector optimization.
Scenario C: Grid Bottleneck (Growth Slows, Advantage Concentrates)
Transformer constraints, permitting delays, and transmission bottlenecks slow the total pace of build-out. That does not reduce the Midwest advantage. It concentrates it. The regions that can actually deliver interconnect and reliability win a larger share of a smaller total build-out. Scarcity increases the premium on feasible corridors and creates “winner zones.”
Implication: Even in the “bad” scenario, the Midwest’s relative positioning improves because scarcity increases the value of the regions that can still scale.
[ PN DIAGRAM: 2025–2045 SCENARIO TREE (CONSTRAINT COMMONALITY) ]

Start: AI load growth continues
   │
   ├─► Managed Expansion
   │      Outcome: corridor build-out, Midwest repricing, selective metro booms
   │
   ├─► Security Localization
   │      Outcome: interior compute basins prioritized, resilience premium explodes
   │
   └─► Grid Bottleneck
          Outcome: fewer winners, bigger wins for the winners that can interconnect

[ PN COMMON NODE ]
In every branch, scaling ability becomes power.
What Changes Politically When the Map Changes Economically
When the invisible layer moves, political attention follows. Infrastructure budgets follow. Workforce programs follow. The Midwest’s resurgence, if it holds, is not just economic. It is institutional. It changes who has bargaining power, who gets federal emphasis, and which regions become “must-protect” corridors. That is the deeper meaning of a constraint-driven repricing: it rewires the priority stack of the nation.
PN Lens: Control Systems, Not Headlines
Pattern Nexus Lens: The economy is a control system. AI is a new actuator that increases the value of hard constraints. Hard constraints reorder the map.
Most commentary is trapped in surface narratives: which company is up, which CEO is loud, which metro is trendy. Those narratives matter in the visible layer. But the invisible layer is where the system is being rebuilt. If you only track the visible layer, you will constantly be surprised by outcomes that were structurally inevitable.
In the invisible layer, the U.S. is reasserting its original superpower template: internal waterways, internal freight routing, internal energy build-out, interior resilience. The Midwest is not an “alternative bet.” It is the physical base layer being repriced back to its strategic value. The future is going to look like “new technology,” but it will be carried by old geometry.
Most people will miss this: because they still think the future is “apps.” The future is infrastructure that makes apps possible.
[ PN DIAGRAM: THE REPRICING MECHANISM ]

Step 1: New workload emerges (AI)
Step 2: Workload demands substrate (power, water, land, reliability)
Step 3: Substrate becomes scarce (interconnect, transformers, rights-of-way)
Step 4: Regions with constraint relief capture build-out
Step 5: Build-out triggers flywheel (suppliers, labor, housing, tax base)
Step 6: Map of power shifts (economic + political + strategic)

[ PN TAKEAWAY ]
Constraint regimes change. The hierarchy changes with them.
Glossary
Purpose: This article is constraint-heavy. These definitions keep the model readable without diluting it.
MW / GW
Megawatts and gigawatts. In this context: the scale of power draw that AI campuses require. When you see “500 MW to multiple GW,” you’re looking at industrial scale, not “normal commercial” scale.
Interconnect (Interconnection)
The process of connecting a large load (like a data center campus) to the grid. Interconnect feasibility is often the real gatekeeper because it depends on substation capacity, transmission capacity, and equipment availability.
Transmission Rights-of-Way
Legal and physical corridors needed to build or upgrade high-voltage lines. In mature dense metros, rights-of-way can be harder than generation.
Redundancy
Multiple independent pathways for power and network connectivity so that failure of one component does not take down critical operations.
Resilient Compute
Compute infrastructure designed for continuity under stress. It prioritizes uptime, redundancy, security depth, and operational control over brand optics or proximity to a prestige metro.
Constraint-Region
A region defined by physical feasibility: power delivery, cooling margin, land/zoning, network routing, and resilience. In the AI era, the constraint-region often predicts the real build-out map better than cultural narratives.
FAQ
Why not just build data centers wherever land is cheap?
Land is not the scarce input. Power interconnect, transformer availability, transmission capacity, cooling reliability, and redundancy are the scarce inputs. Cheap land without scalable power is irrelevant for AI-scale compute.
Does this mean the coasts decline?
The coasts remain important for finance, governance, media, and executive coordination. But constraint pressure increases. The biggest shift is that the invisible layer of the economy becomes more interior-heavy.
Why emphasize national security for data centers?
Because compute is increasingly tied to defense tooling, intelligence processing, economic continuity, and strategic autonomy. In that context, siting decisions favor resilience, redundancy, and depth.
What’s the strongest single Midwest advantage?
The stack matters more than any single factor, but freshwater reliability at continental scale combined with inland logistics dominance is a rare advantage set. AI-era scaling rewards rare advantage sets.
What’s the “tell” that this thesis is playing out?
Watch for accelerating transmission corridor upgrades, interconnect queue priorities, and industrial supplier clustering around targeted Midwest basins. When the fifth major campus lands in a corridor, the transformation becomes structural.
What about fiber and telecom constraints?
Fiber matters, but it is often more buildable than power delivery at the same scale. Network design can route around many issues. The grid cannot be bypassed. In most regions, power is the primary constraint; fiber is a secondary constraint.
Is this bullish for every Midwest town?
No. This concentrates into corridors with interconnect feasibility, water and land capacity, and logistics adjacency. The Midwest thesis is corridor-based, not blanket-based.
Could regulation block this?
Regulation can slow and reshape build-out, but it does not erase the constraints. If anything, bottlenecks concentrate advantage in the few corridors that can still approve and deliver upgrades.
Sources
Source policy: No in-article linking. All outbound references are collected here.
- Pattern Nexus — America’s New Map of Power: Data Centers, AI, and the Grid Shortfall
- Brilliant Maps (Facebook) — Mega-Regions map source lineage
- NERC — North American Electric Reliability Corporation (grid reliability context)
- U.S. EIA — Energy Information Administration (generation and energy system context)
- USGS — U.S. Geological Survey (water systems context)
- Great Lakes overview (geography and scale reference)
- Mississippi River System overview (basin and tributary network reference)
- St. Lawrence Seaway overview (Great Lakes ocean access reference)
- Ports / deepwater port reference (general)
What's Your Reaction?
 Like
0
Like
0
 Dislike
0
Dislike
0
 Love
0
Love
0
 Funny
0
Funny
0
 Wow
0
Wow
0
 Sad
0
Sad
0
 Angry
0
Angry
0

Founder of Pattern Nexus. I research markets, macro, geopolitics, AI, history, ancient systems, and the patterns most people overlook. I’m also building Market Radar, a trading scanner designed to read pressure, risk, confirmation, and setup quality before chasing a move. Pattern Nexus is where I connect the dots between data, history, technology, and the bigger system playing out around us.
















Comments (0)