
Gold Didn’t Moon — It Front-Ran Liquidity (Again)
Gold didn’t spike randomly — it front-ran liquidity, real-rate pivots, and QT stress exactly like we’ve been discussing. Here’s the long-term channel, why it happened, and the three paths forward as the Fed hits its next liquidity decision point.
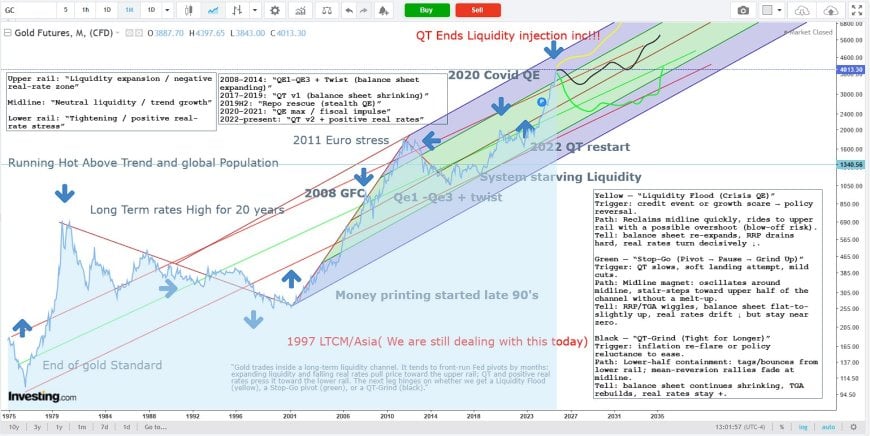
Gold Front-Runs Liquidity: Channels, Fed Cycles, and the Three Paths from Here
If you’ve been following my posts, this won’t surprise you. Gold didn’t move on CPI headlines—it front-ran liquidity and real-rate pivots, again. Same channel. Same rhythm. New phase.

What This Is (and Isn’t)
This is a short companion to the chart above and my prior notes. The chart does the heavy lifting; the text stitches together the logic and links. If you’re new here, start with the Reverse Repo Trap and then come back.
Quick Recap of Past Calls
- “Gold trades the plumbing, not the press release.” I’ve repeated this for months: gold leads liquidity and real-rates by months, not CPI headlines.
- “Range respect inside the long channel.” I mapped the upper/mid/lower rails and said price would oscillate within them, not decouple.
- “Watch QT → funding stress → policy bend.” Same rhythm we saw in 2008 (QE), 2019 (repo rescue), 2020 (QE max), and 2022-ongoing (QT v2).
Result: breakout → blow-off → pullback inside the rails we drew. Exactly the behavior we discussed in posts leading up to this move.
The Liquidity Channel (50-Year Context)
Gold has respected a long-term rising channel that lines up with liquidity regimes:
- Upper rail: liquidity expansion / negative real-rate pressure.
- Midline: neutral liquidity trend, the “magnet.”
- Lower rail: tightening / positive real-rate stress.
Overlay the big inflection points—1997 LTCM/Asia, 2008 GFC, 2019 repo stress, 2020 Covid QE, 2022 QT restart—and the rails tell on policy before the pressers do.
Why Gold Front-Runs (Not CPI—Liquidity + Real Rates)
Mechanically, the bid shows up when expected liquidity rises and expected real rates fall. That expectation moves faster than official policy or talking points. The market sniffs funding stress, balance-sheet direction, and collateral dynamics long before the statements catch up.
Quick tells I watch:
- Fed balance sheet pulse (direction & pace)
- RRP balance & TGA drawdowns (cash shuffling into risk)
- Term funding stress (collateral scarcity / basis blow-outs)
- Real yields (the “gravity” on gold’s multiples)
Three Paths From Here (same ones on the chart)
- Yellow — Liquidity Flood (Crisis QE)
Trigger: credit/funding event forces a policy reversal.
Path: quick reclaim of the midline → push to the upper rail; overshoot risk if panic QE.
What I’d watch: rapid balance-sheet expansion, RRP drain acceleration, real-rates snapping lower. - Green — Stop-Go (Pivot → Pause → Grind Up)
Trigger: QT slows; mild cuts; soft-landing attempt.
Path: price oscillates around the midline and stair-steps higher without a melt-up.
What I’d watch: flat/slightly rising balance sheet; choppy RRP/TGA; real-rates drifting toward zero. - Black — QT-Grind (Tight for Longer)
Trigger: inflation re-flare or policy reluctance to ease.
Path: lower-half containment; bounces fade near midline until something breaks.
What I’d watch: continued BS runoff; TGA rebuild; real-rates persistently positive.
How I’m Thinking About Positioning (Process, not advice)
- Respect the rails. Mean-reversion near the midline; expansion risk near the upper rail; accumulation logic near the lower rail—conditional on liquidity tells.
- Trade the regime probability. I’m weighing data that shifts odds between Yellow/Green/Black, not arguing ideology.
- Update cadence. I’ll post changes when the plumbing moves (RRP/TGA/BS pace/real yields), not when headlines get loud.
Long-time readers: this is the same playbook I used in the Reverse Repo Trap piece and my Nexus Reports threads on QT mechanics.
Sources / Data I Monitor
- FRED — Federal Reserve Balance Sheet (WALCL)
- FRED — Overnight Reverse Repo (RRPONTSYD)
- FRED — 10-Year TIPS Real Yield (DFII10)
- FOMC statements & SOMA releases (pace & composition)
- Term funding/basis spreads across UST & futures
あなたの反応は?
 いいね
0
いいね
0
 嫌い
0
嫌い
0
 愛
0
愛
0
 面白い
0
面白い
0
 ワオ
0
ワオ
0
 悲しい
0
悲しい
0
 怒っている
0
怒っている
0

Founder of Pattern Nexus. I research markets, macro, geopolitics, AI, history, ancient systems, and the patterns most people overlook. I’m also building Market Radar, a trading scanner designed to read pressure, risk, confirmation, and setup quality before chasing a move. Pattern Nexus is where I connect the dots between data, history, technology, and the bigger system playing out around us.













コメント (0)