
Polar Vortex Watch 2026–27: The Sun Quieted, the Vortex Hit a Record — Now the Real Test Begins
The early-season Arctic vortex has now crossed from unusual into a verified date-matched record at 10 hPa. At the same time, NOAA reports very low solar activity and weakening coronal-hole high-speed-stream forcing, while NASA’s forecast shows the extreme wind anomaly peaking and then fading as 100-hPa planetary-wave forcing rises. That sequence fits the Pattern Nexus solar–stratosphere hypothesis, but the wave-forcing signal means this is a test of causation, not proof.
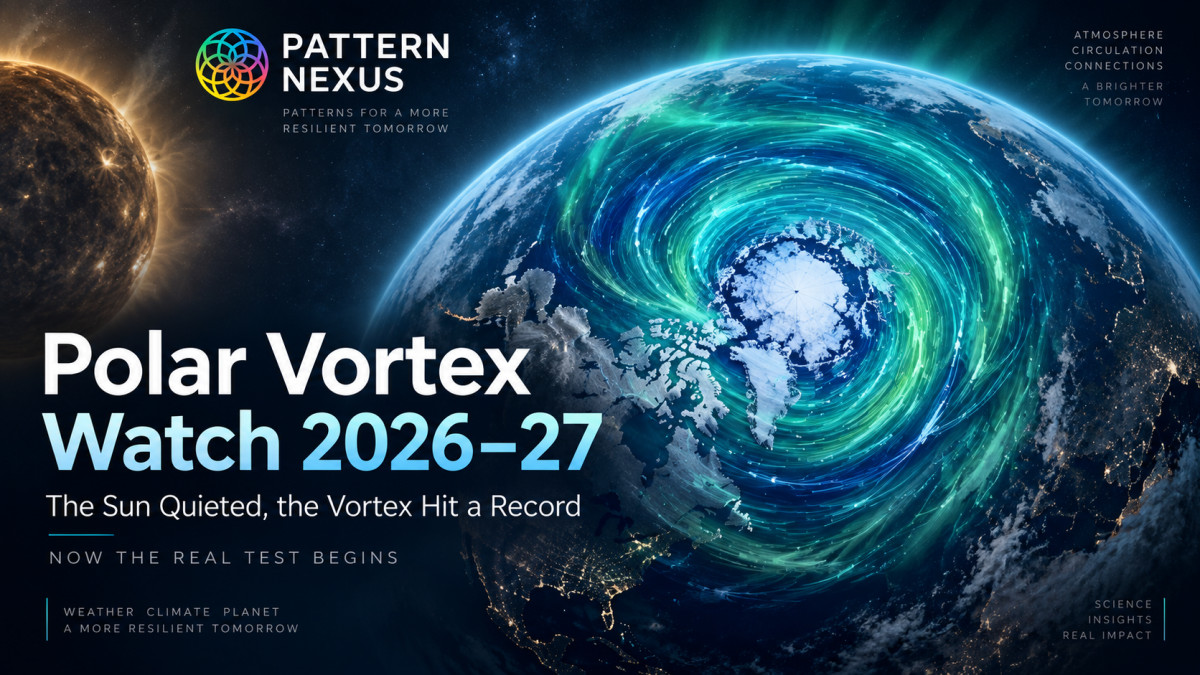
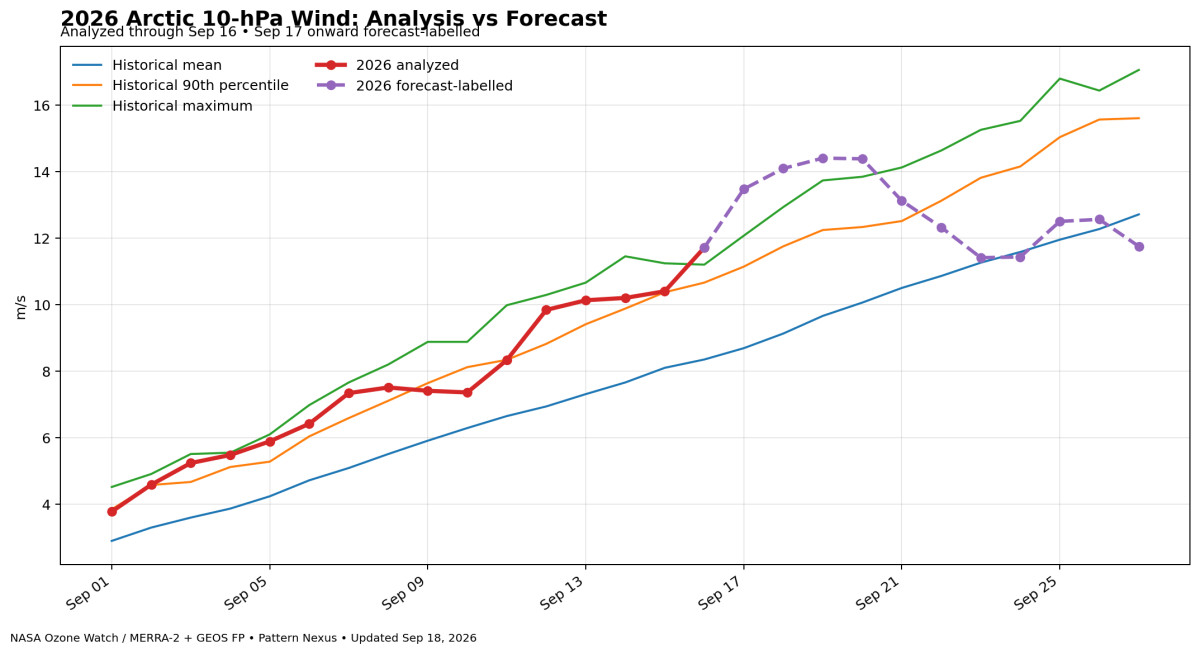
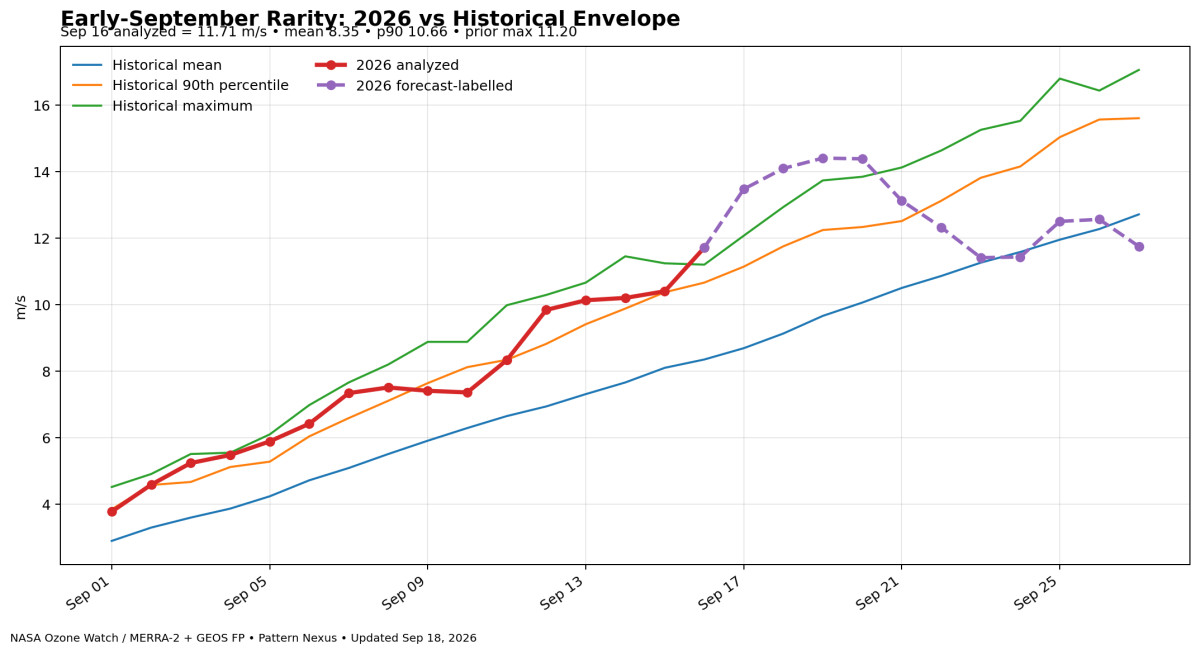
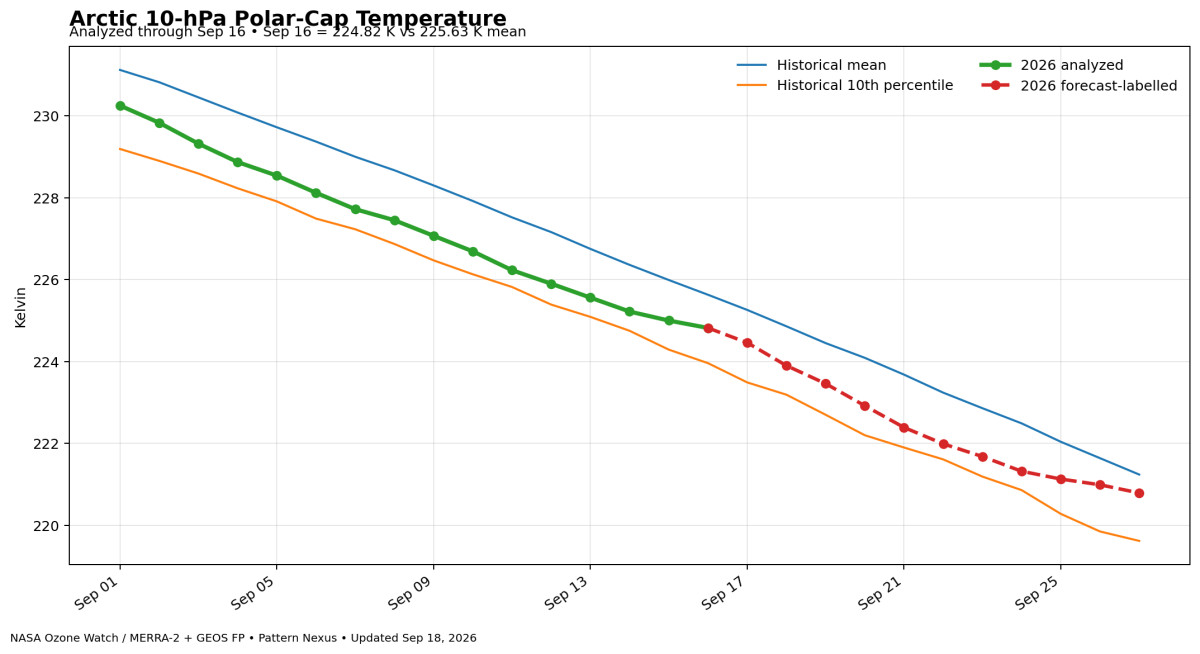
I started this watch because the geometry looked wrong for the calendar. At the beginning of September, the Arctic circulation was already unusually centered, smooth and organized before the conventional 10-hPa wind series had become extreme. Since then, the wind metric caught up, the polar cap stayed colder than average, the signal persisted down the column, and on September 16 the NASA Ozone Watch 60°N zonal-mean zonal wind at 10 hPa reached 11.71 m/s. The previous date-matched historical maximum was 11.20 m/s. We are no longer talking about a forecasted record. We have an analyzed record exceedance.[1]
Now the second half of the experiment is beginning. The solar environment I have been watching has quieted sharply. NOAA’s September 18 forecast discussion says solar activity is at very low levels, there are currently no numbered sunspot regions on the visible disk, no Earth-directed CMEs were observed, and the negative-polarity coronal-hole high-speed-stream influence is weakening. Solar-wind speed fell from roughly 485 km/s toward 400 km/s, with only weak HSS enhancement expected to linger before conditions return toward nominal background levels by September 20.[4]
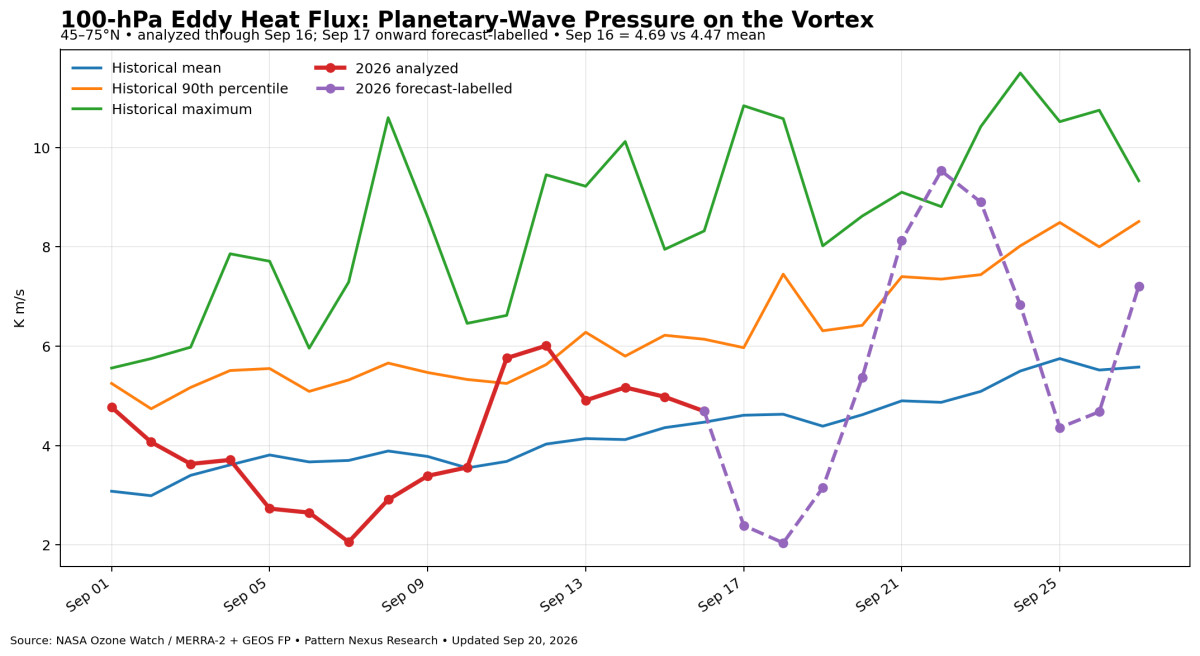
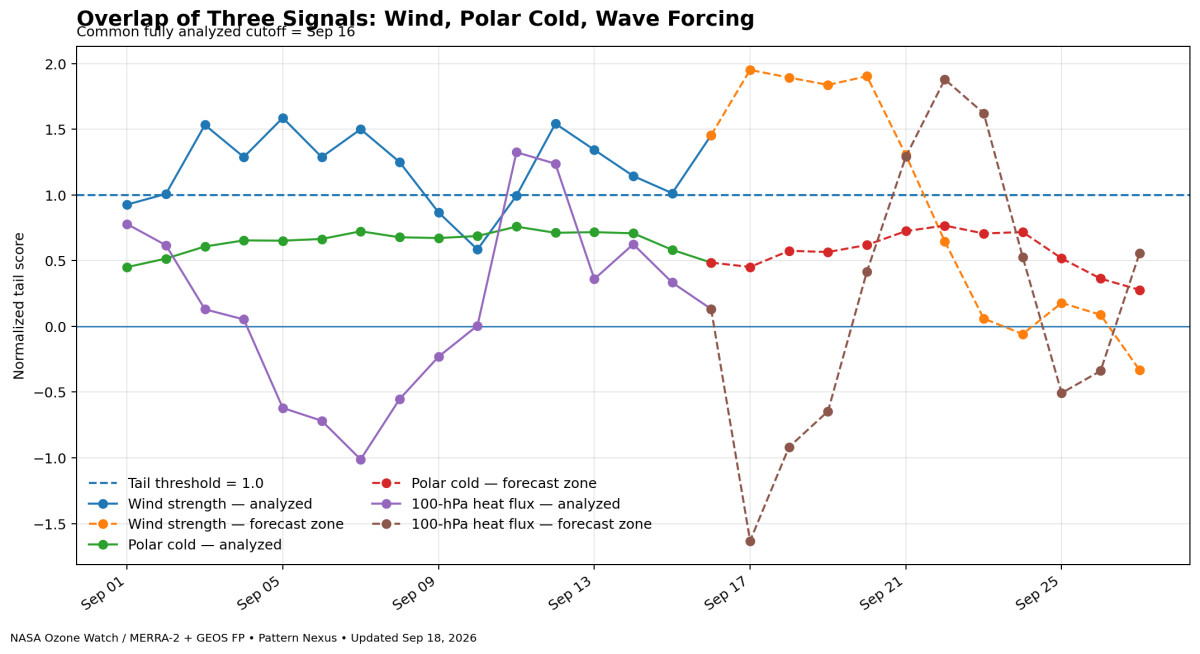
And right as that solar forcing regime fades, the NASA vortex forecast does something extremely interesting: the 10-hPa wind is projected to peak near record territory and then lose most of its positive anomaly. At the same time, the 100-hPa eddy heat-flux forecast rises sharply above its historical 90th percentile, which gives us a conventional atmospheric mechanism capable of slowing and disturbing the vortex.[1][3]
That does not prove the Sun controls the polar vortex. It does something more useful: it gives us a real-time test of the hypothesis I have been writing about. If the background forcing I was watching fades and the atmospheric anomaly fades with it, the sequence is consistent with the hypothesis. But because planetary-wave forcing is also strengthening, the causal problem is now harder, not easier. We have to track both.
Updated Polar Vortex Research Charts — September 20, 2026
The following six charts reflect the latest NASA Ozone Watch update. Analyzed observations and forecast-labelled values are separated throughout.
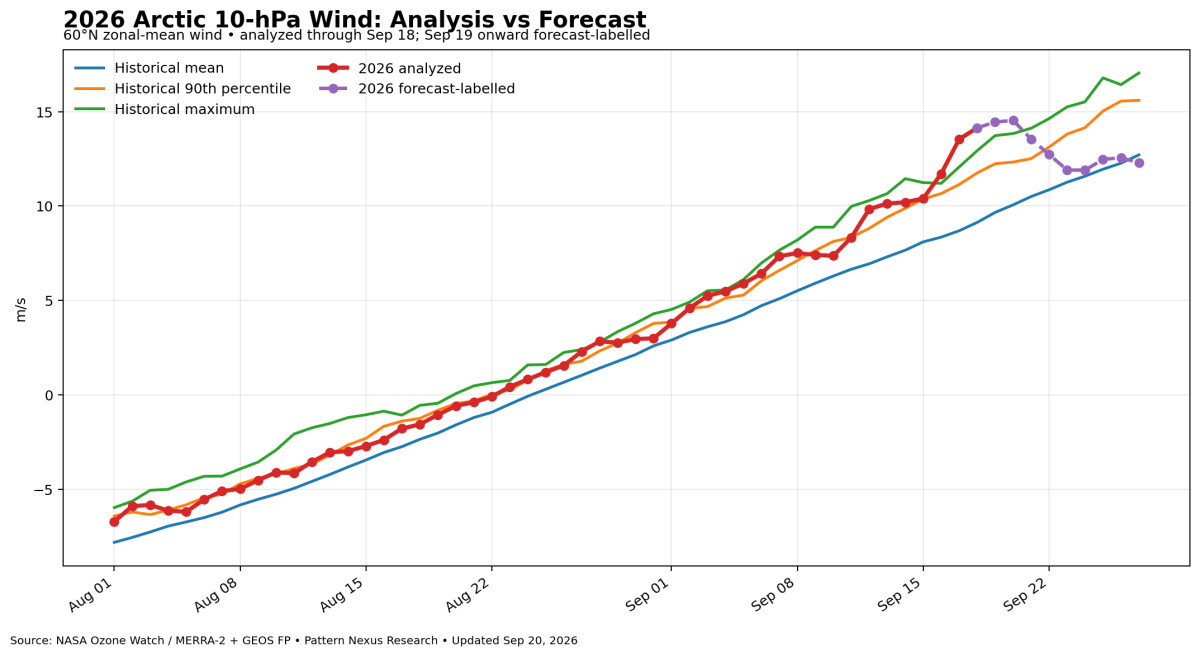
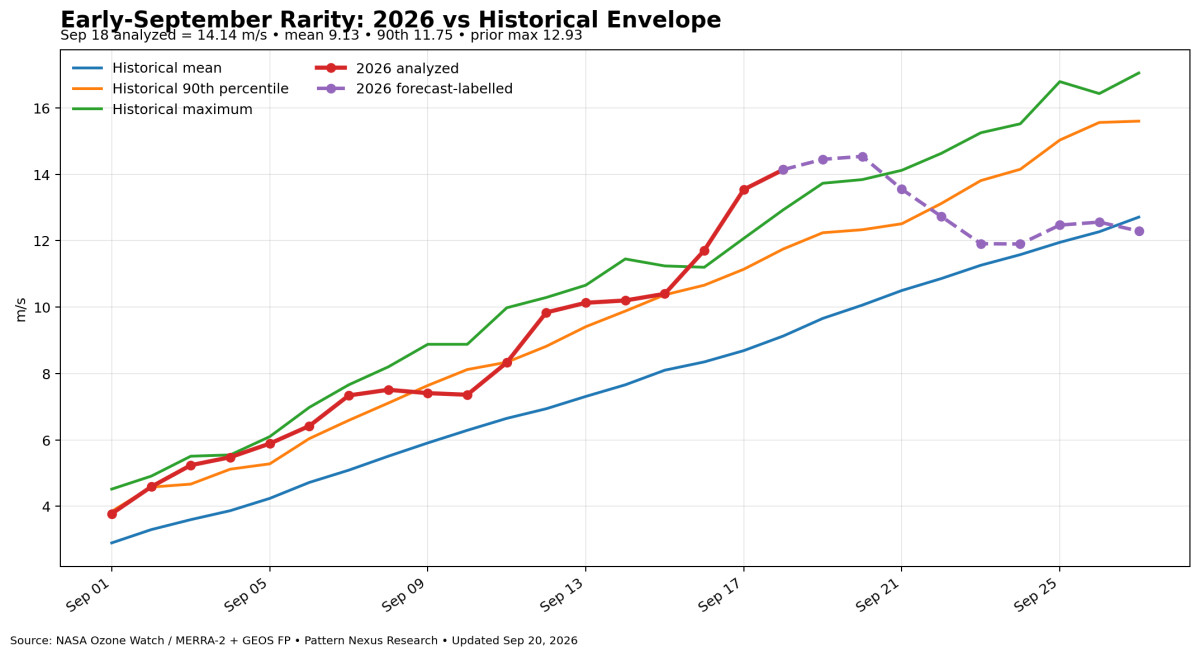
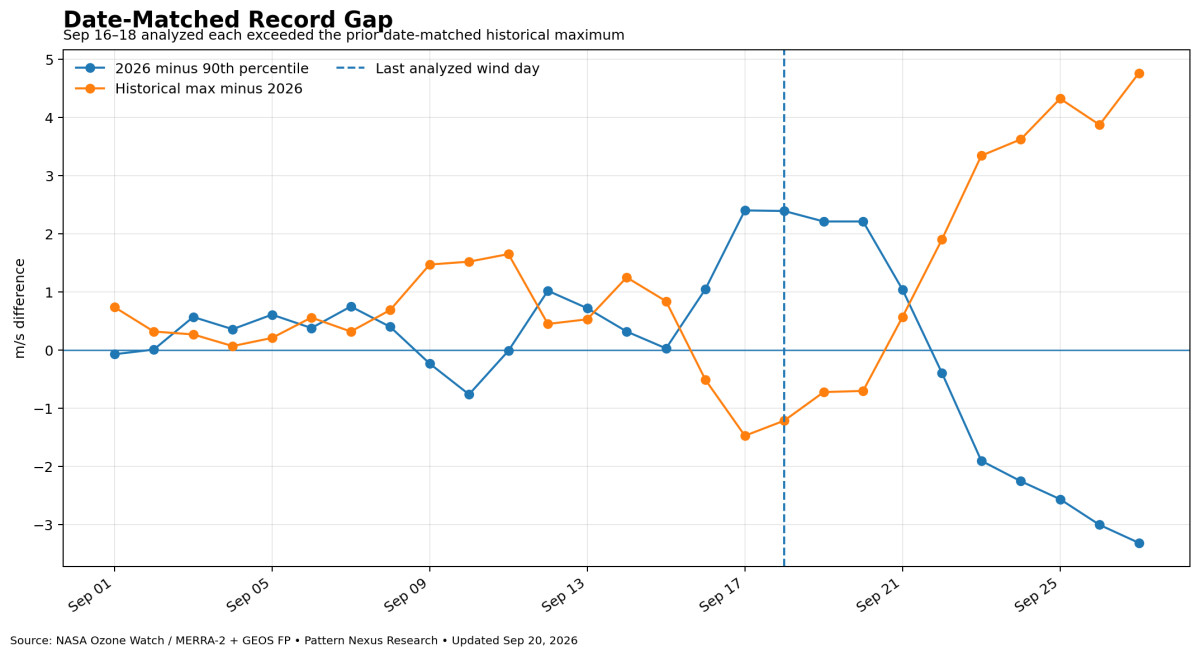
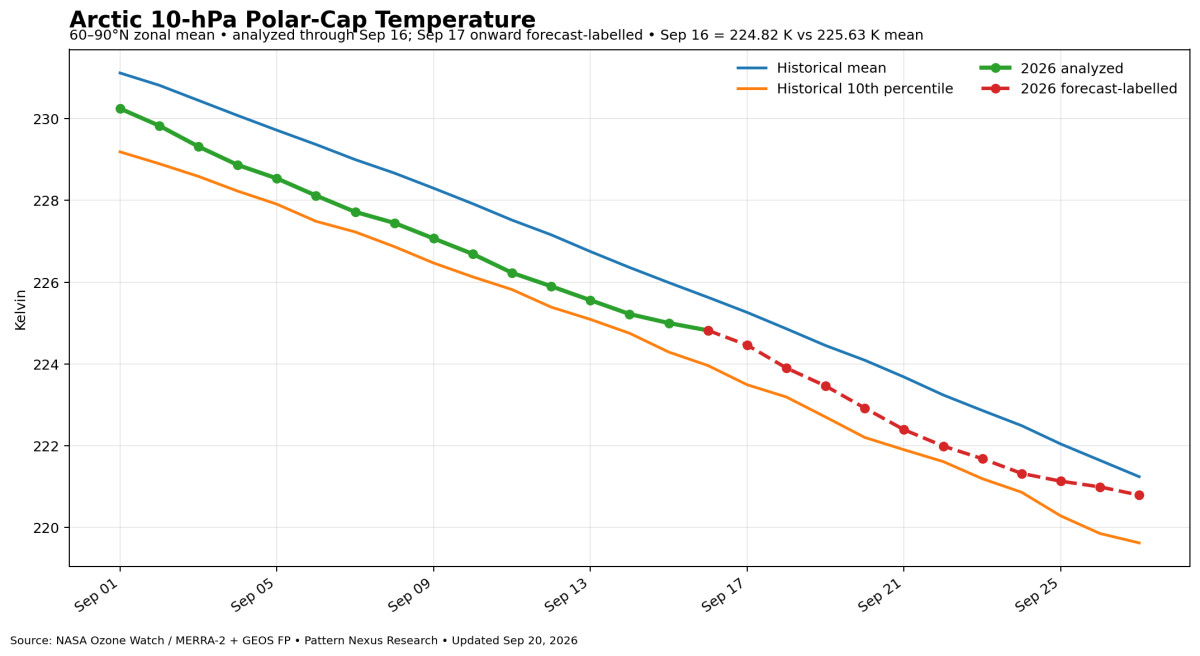
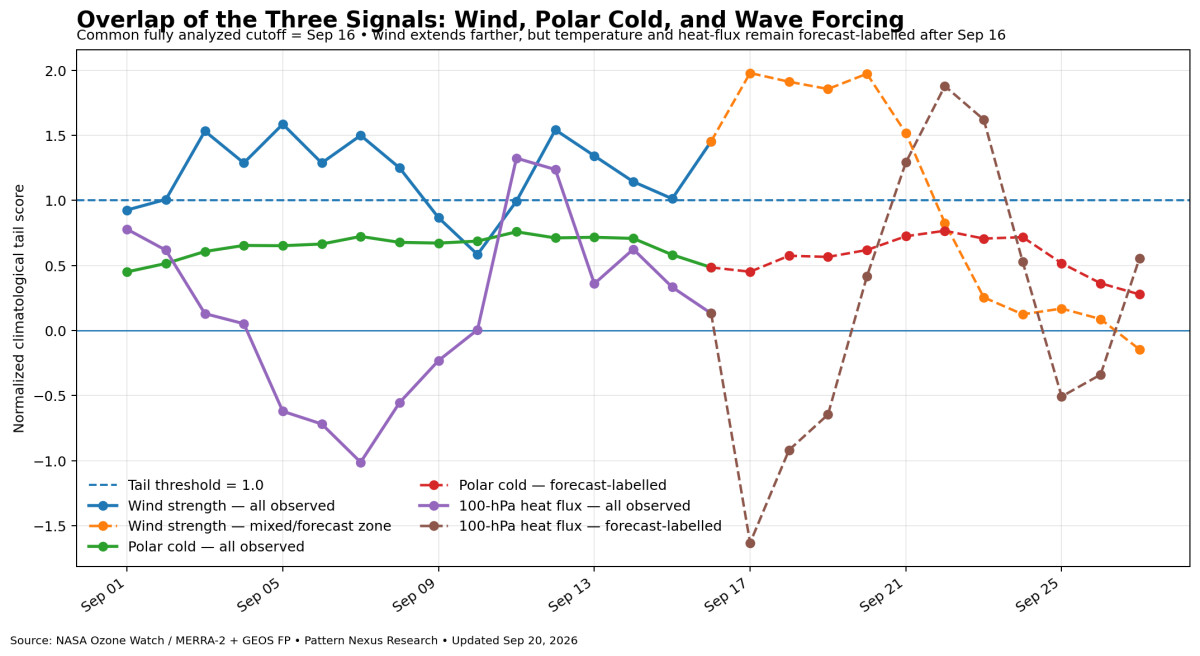
The record is no longer hypothetical. September 16 analyzed at 11.71 m/s versus a prior date-matched historical maximum of 11.20 m/s.
The solar regime has changed. NOAA now describes very low solar activity and weakening coronal-hole HSS influence, with solar-wind speed declining toward nominal conditions.
The vortex forecast changes with it. The extreme positive wind anomaly is projected to peak and then collapse toward climatology later in the forecast window.
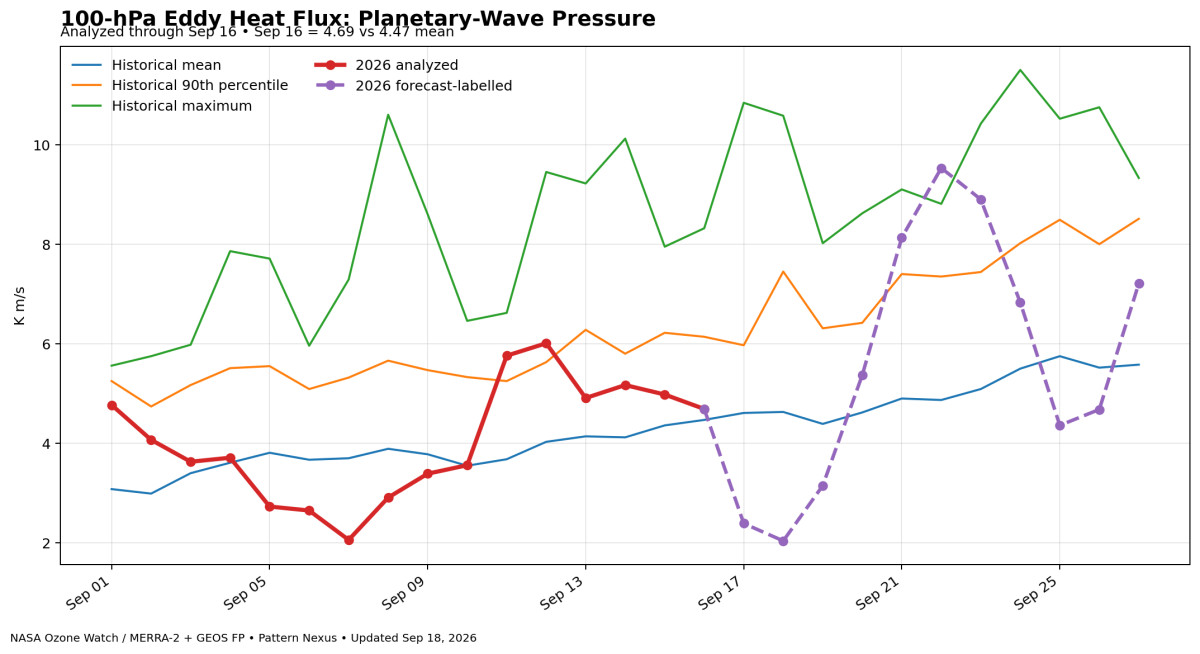
But there is a competing mechanism. The 100-hPa heat-flux forecast surges above the historical 90th percentile around September 21–23, meaning planetary-wave forcing can explain part of the projected slowdown.
01 · UPDATE
What Changed Since the Last Update
The last few updates were still about whether the early signal would survive contact with analyzed data. It has. The sequence began with geometry, not wind speed. The circulation looked unusually organized before the standard 60°N, 10-hPa metric became extreme. Then the wind accelerated through the historical envelope, the polar-cap temperature remained below its date-matched mean, and the stronger-vortex signal persisted long enough to become statistically unusual rather than a one-day spike.
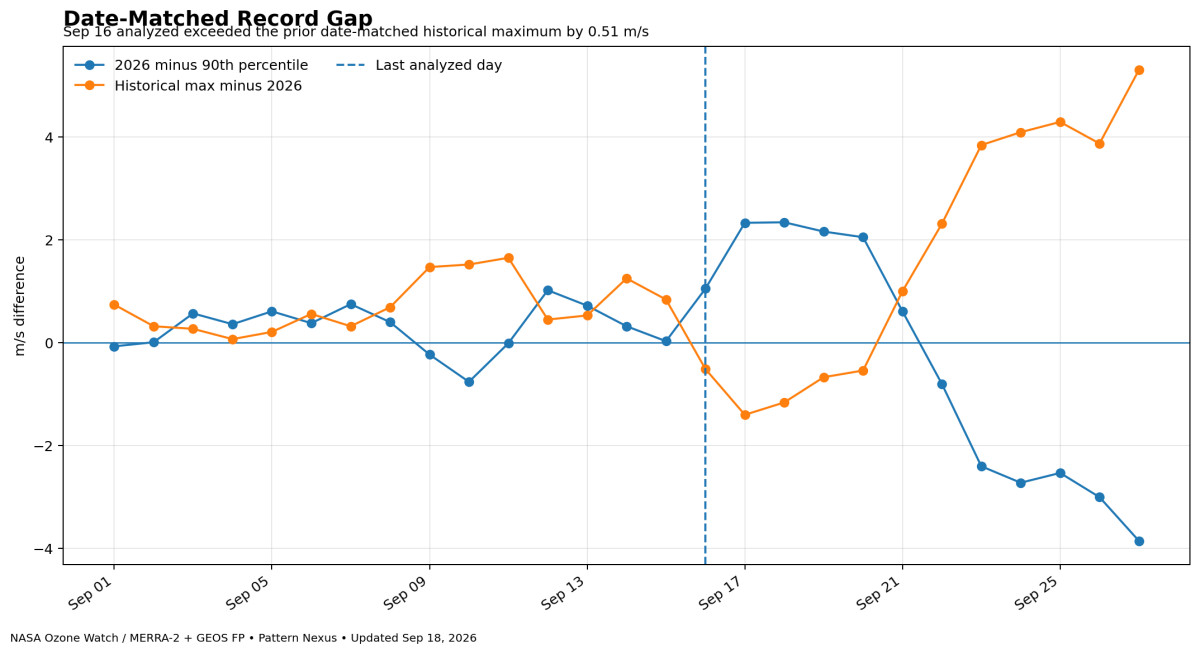
On September 15, the analyzed wind was 10.40 m/s, essentially sitting on the date-matched 90th percentile of 10.37 m/s. One day later, on September 16, the wind jumped to 11.71 m/s. NASA’s historical maximum for September 16 is 11.20 m/s. That is a 0.51 m/s analyzed exceedance of the previous date-matched maximum.[1]
That matters because we spent days being careful not to call the forecast a record. Now we do not have to. The September 16 value is analyzed, not forecast-labelled. The first threshold in this watch has been crossed.
02 · RECORD
The Record Is Now Real
The important distinction throughout this watch has been observation versus forecast. A model can place the vortex above a historical maximum five days into the future and still miss. That is why I kept separating dashed forecast values from analyzed values. September 16 changes the language because the observed series itself crossed the date-matched historical maximum.
| Date | 2026 Wind | Historical Mean | 90th Percentile | Historical Max | Status |
|---|---|---|---|---|---|
| Sep. 15 | 10.40 m/s | 8.10 | 10.37 | 11.24 | Analyzed |
| Sep. 16 | 11.71 m/s | 8.35 | 10.66 | 11.20 | Analyzed record exceedance |
| Sep. 17 | 13.47 m/s | 8.69 | 11.14 | 12.07 | Forecast-labelled |
| Sep. 18 | 14.09 m/s | 9.13 | 11.75 | 12.93 | Forecast-labelled |
| Sep. 19 | 14.40 m/s | 9.66 | 12.24 | 13.73 | Forecast-labelled |
| Sep. 20 | 14.38 m/s | 10.06 | 12.33 | 13.84 | Forecast-labelled |
| Sep. 23 | 11.41 m/s | 11.26 | 13.81 | 15.25 | Forecast-labelled |
| Sep. 27 | 11.75 m/s | 12.71 | 15.60 | 17.05 | Forecast-labelled |
The raw wind speed is only half the story. What matters more for this hypothesis is the anomaly relative to what September normally does. Around September 20, the forecast has 14.38 m/s against a historical mean of 10.06 m/s — roughly +4.32 m/s above normal. By September 23, the forecast is 11.41 m/s against an 11.26 m/s mean — only +0.15 m/s. By September 27, 11.75 m/s is actually about 0.96 m/s below the date-matched mean.[1]
That is not simply “the vortex slows.” The climatological vortex normally strengthens as we move deeper into September. What the forecast is showing is that the extraordinary positive anomaly itself is projected to disappear.
03 · SOLAR STATE
The Sun Quieted — and the Earth-Effective Forcing Is Fading
This is the part that makes the timing worth documenting. I have been watching the Sun throughout this entire setup, especially the large persistent coronal holes and the repeated high-speed solar-wind streams they were sending toward Earth. NOAA explains that persistent coronal holes are long-lived sources of high-speed solar-wind streams and that the interaction between fast and slow solar wind can form co-rotating interaction regions, or CIRs, capable of enhancing geomagnetic activity.[6]
By September 18, the operational solar picture had changed sharply. NOAA’s Space Weather Prediction Center reported that solar activity remained at very low levels, with only isolated low-level B-class flaring and no numbered sunspot regions currently visible. No Earth-directed CMEs were observed in the available coronagraph imagery.[4]
The solar-wind side is even more relevant to the hypothesis. NOAA described the negative-polarity coronal-hole high-speed-stream influence as weakening. Solar-wind speed declined from roughly 485 km/s to around 400 km/s over the reporting period. NOAA expected only lingering weak HSS enhancement into September 19 before a return toward nominal background conditions by September 20.[4]
The prior day’s joint USAF/NOAA activity summary also showed the broader quieting regime: F10.7 radio flux was 97, the sunspot number was 11, and the X-ray background was only B2.0.[5] NOAA’s earlier daily forecast put M-class flare probability at 5% and X-class at 1%, with F10.7 expected to fall from 95 to 90 through September 20.[7]
I have also been visually tracking the coronal-hole geometry itself. To my eye, the large holes that initially stood out have become less imposing. I am treating that as an observational note, not a quantified coronal-hole-area measurement. The verified part is the operational consequence: the Earth-effective HSS forcing is weakening, solar-wind speed is declining, geomagnetic conditions are quiet to unsettled, and NOAA expects the HSS influence to fade toward background.
That distinction matters. I do not need to prove that a hole is exactly X percent smaller to test the atmospheric idea. What matters for the working hypothesis is whether the sustained solar-wind and geomagnetic forcing regime that I was using as an upstream signal is actually weakening. NOAA says it is.
04 · FORECAST
The Vortex Forecast Peaks — Then the Extreme Anomaly Rolls Over
NASA’s current forecast still has the vortex becoming stronger first. September 17 through September 20 remain projected above their date-matched historical maxima. That means the lag structure matters. The solar forcing does not switch off at the Sun and instantaneously disappear from the geospace–atmosphere system. Earth was still inside the residual HSS regime while the vortex continued accelerating.
But after the projected peak, the forecast changes character. The wind drops from roughly 14.4 m/s on September 19–20 to 13.12 on September 21, 12.32 on September 22, 11.41 on September 23 and 11.43 on September 24. By then the date-matched historical mean has risen enough that the vortex is no longer extreme relative to climatology. By September 27 the forecast is below the historical mean.[1]
This is exactly why I have been arguing that we cannot just stare at the absolute wind number. September climatology is moving underneath us. A vortex at 12 m/s can be extraordinary early in the month and ordinary later. The meaningful signal is the distance from the date-matched distribution.
From a Pattern Nexus perspective, the sequence now looks like this: an unusual geometry appears first; the wind catches up and moves through the upper historical envelope; the vortex sets an analyzed date-matched record; the upstream solar-wind forcing weakens; and the modeled vortex anomaly then loses most of its excess strength. That is a very clean sequence to test.
05 · WAVE FORCING
At the Same Time, Planetary-Wave Pressure Is Rising
Here is the part that prevents me from turning this into a simplistic “Sun down, vortex down” story. The conventional dynamical mechanism is also changing.
NASA’s 100-hPa eddy heat-flux series measures upward planetary-wave activity entering the lower stratosphere. On September 16 the analyzed value was 4.69 K m/s, close to the date-matched mean of 4.47 and below the 90th percentile of 6.14. The forecast then falls below normal briefly on September 17–19 before rising hard: 8.13 K m/s on September 21, 9.53 on September 22, and 8.90 on September 23. Each of those forecast values is above the corresponding date-matched 90th percentile.[3]
That matters because planetary waves are one of the primary ways the troposphere attacks the stratospheric vortex. Strong upward wave activity can deposit momentum and heat, slow the westerly circulation, deform the vortex, displace it from the pole and, in much stronger winter events, contribute to sudden stratospheric warming. We are not looking at an SSW here. We are looking at a forecast increase in the kind of wave pressure that can push against a strong vortex.
And the timing overlaps the projected loss of the wind anomaly. That is the confounder. If the vortex weakens while the solar forcing fades and wave forcing rises, both are moving in the direction that could explain the same outcome. That means the next phase of the watch has to separate them as much as possible instead of pretending there is only one driver.
06 · HYPOTHESIS
Why This Fits the Hypothesis I Started With
My working hypothesis has never been “solar plasma powers the polar vortex.” That would be a bad description of the physics. The polar vortex is fundamentally a radiatively driven winter circulation created by the growing temperature contrast between the dark polar region and lower latitudes, then continually modified by planetary-wave dynamics.
The solar hypothesis sits upstream of that system. Large persistent coronal holes produce recurrent high-speed solar-wind streams. Those streams and their CIRs can increase geomagnetic activity and energetic-particle precipitation in the polar atmosphere. Energetic particles change ionization and middle-atmospheric chemistry, including NOx, HOx and ozone. The existence of those chemical pathways is established. The magnitude, sign and reliability of the resulting downward influence on the stratospheric circulation are the uncertain parts.[8][9]
That is why this year caught my attention. I was watching very large, persistent coronal holes and repeated high-speed streams before the conventional vortex metrics became extreme. I expected the vortex to organize strongly even though a lot of the seasonal discussion around El Niño would normally make people watch for stronger planetary-wave disturbance and a weaker or more disrupted vortex.
Then the sequence started appearing in the atmosphere: unusual geometry first, strengthening wind second, persistent cold polar-cap background, organization deeper down the column, and eventually a date-matched 10-hPa wind record. Now the solar forcing regime is weakening and the vortex anomaly is forecast to weaken after it.
That is what “fits the hypothesis” means here. It does not mean one chart proves a causal chain. It means the temporal ordering is consistent with the mechanism I proposed before the atmospheric measurements became extreme.
07 · CAUSATION TEST
Why This Still Does Not Prove Causation
If I were trying to prove myself right instead of understand the system, I could stop at the timing and declare victory. I am not doing that. There are at least three reasons the causal question remains open.
First, the strongest conventional counter-explanation is arriving at the same time: planetary-wave forcing is forecast to surge. A rise in 100-hPa eddy heat flux is directly relevant to vortex deceleration. If the vortex slows during a wave-flux surge, I cannot honestly assign the slowdown uniquely to declining solar forcing.
Second, the energetic-particle pathway itself does not have a universally simple sign. Research clearly shows that energetic particle precipitation can produce NOx and HOx and alter ozone in the polar middle atmosphere. But model studies do not support a simple rule that more particle forcing always means a stronger vortex. One idealized study found that EPP-driven ozone losses produced a small winter polar-stratospheric warming and weakening of the vortex, with limited statistically significant surface response.[8] Other observational work demonstrates strong EPP-NOx descent and ozone effects but emphasizes how much the outcome depends on background circulation and transport.[9]
Third, atmospheric coupling contains lags. Solar wind, magnetospheric response, energetic-particle precipitation, chemical change, radiative response and downward dynamical influence do not happen on one clock. If there is a usable predictive signal here, the lag structure is probably part of it.
So the claim I am comfortable making is narrower and stronger: the present sequence is consistent with the Pattern Nexus hypothesis and is worth testing quantitatively, but the current data do not isolate solar forcing from planetary-wave dynamics.
08 · CONTROL SYSTEM
The Control-System View: This Is Why I Do Not Treat Climate Like a Thermostat
This is exactly the framework I laid out in Earth’s Climate Is a Control System, Not a Thermostat. The atmosphere is not one dial called temperature. It is a coupled system with inputs, state variables, feedbacks, delays, thresholds and competing control loops.
The Sun is one upstream input. The magnetosphere and energetic-particle environment are another layer. Polar chemistry and ozone are another. The stratospheric temperature gradient and vortex are state variables. Planetary waves are a major feedback and disturbance pathway. ENSO changes the background wave field. The QBO changes the stratospheric environment. Snow cover, sea ice, tropical convection and ocean states all feed into the system.
When people ask which one “controls” the winter, the question is usually framed incorrectly. Complex control systems rarely have one master variable. The useful question is which input is dominant in the current regime, which feedback is strengthening, which one is weakening, and whether the system is approaching a transition.
Right now, the regime transition is visible enough to measure: the strong-vortex anomaly reached an analyzed date-matched record; the solar-wind forcing regime is fading; and planetary-wave pressure is projected to increase. That is the experiment.
09 · NEXT TEST
What Would Actually Strengthen — or Break — the Pattern
The next step is not another argument. It is repeated observation. The most useful test would be to track the same variables every time the solar-wind regime changes and see whether the vortex responds with a repeatable lag after controlling for planetary-wave forcing.
I want to keep tracking coronal-hole area and position, solar-wind speed, IMF strength and orientation, Kp/Ap, energetic-particle measures, F10.7, sunspot activity, 10-hPa wind, 10-hPa polar-cap temperature, 100-hPa heat flux, vortex geometry and vertical structure. Then we can ask a much harder question: does recurrent HSS/geomagnetic forcing add predictive information after the normal atmospheric drivers are already included?
The best evidence for the hypothesis would not be this one transition. It would be recurrence. If the Sun stays quiet, the HSS influence fades and the vortex anomaly continues to normalize, then later a large Earth-effective coronal hole returns, the solar-wind/geomagnetic forcing rises again, and the vortex responds after a similar lag while wave forcing is controlled for, that would be much more compelling.
The hypothesis also needs a failure condition. If the solar forcing returns strongly and repeatedly while the vortex does nothing — or if the vortex strengthens and weakens entirely in step with planetary-wave forcing regardless of the solar state — then the solar signal is either weak, conditional, incorrectly signed or not useful at the level I am proposing.
That is how I want to handle this. Not “I saw a correlation once, therefore the Sun did it.” The point is to turn a twenty-year observational pattern into something that can survive a real test.
10 · WINTER FRAME
What This Means for Winter 2026–27
This still is not a deterministic winter forecast. A strong, compact polar vortex generally reduces the opportunity for prolonged Arctic-air displacement into the mid-latitudes. A weakened, displaced or split vortex can increase the opportunity for high-latitude blocking and cold outbreaks farther south, especially if the disturbance couples downward into the troposphere. But September does not tell us where a January cold outbreak will occur.
What September can tell us is how the system is initializing. This year initialized unusually early and unusually strongly. We now know that with more confidence than we did two weeks ago because the analyzed wind actually exceeded a date-matched historical maximum.
The next question is whether the vortex remains dominant as the seasonal wave field strengthens. If the forecasted September 21–23 heat-flux surge verifies and the vortex loses its extreme anomaly, that will be the first meaningful attack on the early-season setup. If the vortex absorbs that wave forcing and rapidly re-strengthens, that tells us something else.
By late October and early November, the winter signal should be much easier to judge because the stratospheric vortex, tropospheric jet, ENSO background, snow cover and blocking tendencies will all be farther into their seasonal regimes. Until then, I am treating this as a structural watch, not a promise that any particular city is getting a cold or snowy winter.
12 · FAQ
FAQ
Did the 2026 vortex actually set a record?
Yes, for the specific date-matched NASA Ozone Watch metric being tracked here. On September 16, the analyzed 60°N zonal-mean zonal wind at 10 hPa was 11.71 m/s versus a previous historical maximum of 11.20 m/s for that calendar date.[1] This does not mean it is the strongest polar vortex ever measured at any point in the season; it means the September 16 value exceeded the historical maximum for September 16 in NASA’s climatology.
Is a sudden stratospheric warming starting?
No. The vortex is still strongly westerly, and the latest analyzed wind is record-strong for the date. The 100-hPa heat-flux forecast does show increasing planetary-wave forcing later in the forecast window, which is something to watch for deformation or deceleration, but that is not the same thing as an SSW.
Does the quieter Sun prove the vortex is about to weaken?
No. It creates a useful test because the upstream forcing I have been watching is fading at the same time the vortex anomaly is forecast to fade. But planetary-wave forcing is also forecast to rise strongly, so the slowdown cannot be uniquely assigned to solar forcing.
Are coronal holes still affecting Earth?
Yes, but the influence is weakening. NOAA’s September 18 forecast discussion says the negative-polarity coronal-hole high-speed-stream influence is weakening, solar-wind speed declined toward roughly 400 km/s, and only weak lingering HSS enhancement is expected before a return toward nominal conditions.[4]
Is the solar-atmosphere pathway real?
Parts of it are well established. Coronal holes can generate high-speed solar-wind streams; geomagnetic activity and energetic-particle precipitation alter polar ionization and chemistry; EPP can increase NOx/HOx and affect ozone. The uncertain part is how large, consistent and directionally predictable the resulting influence on the stratospheric vortex is in a specific season.[6][8][9]
13 · SOURCES
Sources
- NASA Ozone Watch — 60°N Zonal Mean Zonal Wind, 10 hPa, 2026.
- NASA Ozone Watch — 60–90°N Zonal Mean Temperature, 10 hPa, 2026.
- NASA Ozone Watch — 45–75°N Eddy Heat Flux, 100 hPa, 2026.
- NOAA Space Weather Prediction Center — Forecast Discussion, issued September 18, 2026 1230 UTC.
- NOAA / USAF — Solar and Geophysical Activity Summary, September 18, 2026.
- NOAA Space Weather Prediction Center — Coronal Holes and High-Speed Solar-Wind Streams.
- Joint USAF/NOAA Solar and Geophysical Activity Report, September 17, 2026, processed by SpaceWeatherLive.
- Meraner & Schmidt (2018), Atmospheric Chemistry and Physics — Climate impact of idealized polar ozone losses caused by energetic particle precipitation.
- Randall et al. (2007), Journal of Geophysical Research — Energetic particle precipitation effects on the stratosphere.
The point of this watch is not to force one variable into being the answer. It is to document the sequence, separate observation from forecast, and keep testing which inputs actually add predictive power.
What's Your Reaction?
 Like
0
Like
0
 Dislike
0
Dislike
0
 Love
0
Love
0
 Funny
0
Funny
0
 Wow
0
Wow
0
 Sad
0
Sad
0
 Angry
0
Angry
0

Founder of Pattern Nexus. I research markets, macro, geopolitics, AI, history, ancient systems, and the patterns most people overlook. I’m also building Market Radar, a trading scanner designed to read pressure, risk, confirmation, and setup quality before chasing a move. Pattern Nexus is where I connect the dots between data, history, technology, and the bigger system playing out around us.

Comments (0)