
Gold’s Rough Day Doesn’t Change the Bigger Picture: A Natural Correction in a Structural Bull Market
Gold is pulling back to $4,210 after its record-breaking rally above $4,400, but this retracement is part of the natural rhythm of the market. Behind the short-term volatility, the long-term structural forces driving gold higher — liquidity stress, repo tightening, QE speculation, and collateral repricing — remain firmly intact.
Gold’s Rough Day Doesn’t Change the Bigger Picture
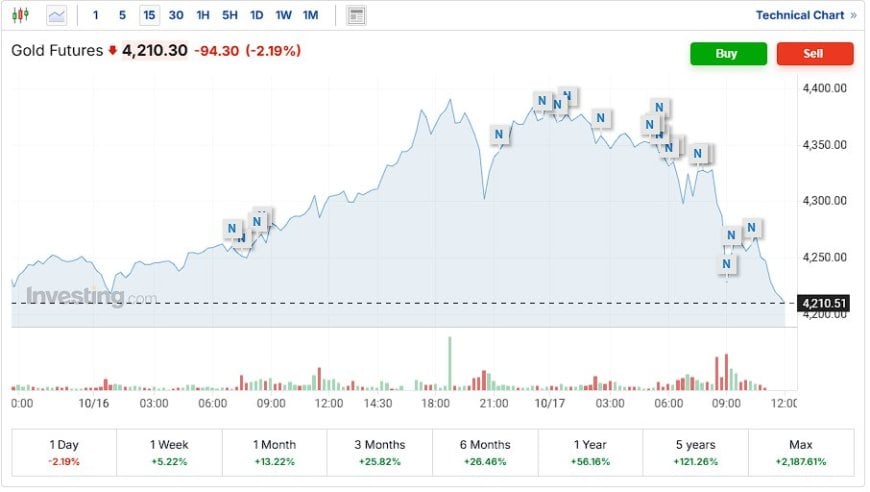
After weeks of strength, gold futures have taken a breather. As of October 17, prices have slipped back to around $4,210/oz, down roughly 2% on the day. That may look sharp on the chart, but in context, it’s perfectly normal.
If you’ve followed my earlier posts — particularly the “System Reset” analysis — you know this pullback was anticipated. Gold overshot the upper boundary of its long-term channel when it hit $4,400, reaching my previous target range of $4,200 by October 28 two weeks early. The price is now simply realigning with its historical trajectory.
Unless the global economy completely unravels overnight, this retracement is not a reversal — it’s a pressure release. Gold doesn’t move in straight lines; it oscillates in a rhythm that’s as much mathematical as it is psychological. It behaves like a Fibonacci pulse through time — each cycle shorter in duration yet more explosive in magnitude, following the same expansion-consolidation pattern that has defined every major move since the 1970s.
1. The Pullback Was Technically Inevitable
Technically, gold’s breakout created a short-term overextension above both its 50-day and 200-day moving averages. Momentum traders took profits, and algorithmic systems triggered retracements to mean levels. This is classic market behavior.
According to Investing.com and Kitco data, the nearest short-term support sits near $4,180–$4,200, with deeper structural support in the $4,050 zone. Unless those levels break decisively, the long-term uptrend remains intact.
We’re witnessing the same phenomenon that occurs after every parabolic expansion: a retracement toward equilibrium before the next leg higher. Fibonacci modeling across historical cycles (1979, 2011, 2020) shows that gold tends to correct by 5–8% after a breakout, consolidating for 2–4 weeks before resuming its trend.
2. The Macro Context Hasn’t Changed
The recent dip doesn’t erase the larger story — the one we’ve been tracking for months. Gold’s long-term trajectory is still defined by:
- Liquidity Contraction: The Standing Repo Facility usage surged again this week, with banks tapping over $15 billion in emergency overnight funding. This indicates that cash is scarce in interbank markets — the same stress signal seen in 2019 and 2020 before quantitative easing resumed.
- Bank Fragility: Regional lenders like Zions and Western Alliance continue to expose credit losses tied to fraud and bad commercial loans, echoing early signs of systemic weakness.
- Fiscal Illusions: The U.S. Treasury’s September “surplus” was tariff-driven — a temporary sugar high masking an underlying structural deficit approaching $2 trillion annually.
These stress points don’t vanish because gold fell 2%. They’re what anchor gold’s long-term upward trend. As liquidity tightens, confidence erodes, and investors shift into hard collateral — gold becomes the primary release valve for systemic risk.
3. The Fibonacci Pulse and Fractal Rhythm of Gold
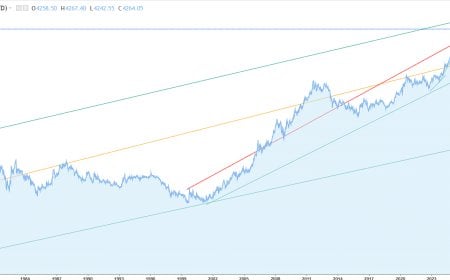
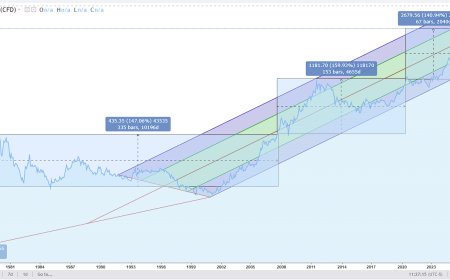
Gold’s behavior over decades follows an unmistakable fractal rhythm. Each expansion cycle since 1971 — when Nixon severed gold from the dollar — mirrors a Fibonacci progression in both time and magnitude.
- 1971–1980: Gold surged 24×, from $35 to $850, as fiat systems recalibrated to post-Bretton Woods inflation.
- 1999–2011: A 12-year rally took gold from $250 to $1,900 — a 7.6× move, roughly half the prior amplitude and proportionally longer.
- 2018–2025: The current cycle has unfolded faster and sharper, with a 3× rise in just seven years, matching the pattern of compression and acceleration.
Each phase shortens by approximately 0.618× in duration and expands in price velocity by the same ratio — a direct echo of the Fibonacci constant found in natural and market systems alike. It’s not mysticism — it’s rhythm encoded into human behavior and liquidity cycles.
4. QE, Tokenization, and the Next Catalyst
The next major inflection point for gold likely hinges on renewed Quantitative Easing (QE) or its digital equivalent — liquidity injections through tokenized financial instruments.
In the analog era, QE meant printing money to buy bonds. In the coming digital phase, QE will occur via tokenized treasuries, repo swaps, and digital collateral networks. Projects like BIS Project Guardian and DTCC’s Digital Asset Platform are already testing these systems — allowing central banks and institutions to move liquidity at the blockchain layer.
As liquidity stress deepens, these tools will become the new QE mechanisms. Instead of overt bond-buying, liquidity will enter markets through tokenized conduits — making future interventions faster and less visible to the public.
That’s why gold’s correlation with these developments is so consistent. It reacts not to policy statements, but to systemic liquidity constraints. When cash tightens, gold anticipates the pivot — long before the Fed admits it.
5. Real Assets as the New Collateral Layer
This structural evolution ties directly into what I’ve called the “Liquidity Crunch” framework. The old model — fiat credit expansion secured by paper promises — is giving way to a collateral-based hierarchy built on tangible reserves: gold, energy, commodities, and eventually tokenized real estate.
Each asset cycle redefines what the market trusts. In the 1970s, it was oil. In the 2000s, it was housing. Now, in the 2020s, it’s monetary metals — assets that can’t default, can’t be hacked, and can’t be printed.
That’s why the correction we’re seeing today doesn’t change the narrative; it reinforces it. Every pullback is a reminder that volatility is simply the breathing mechanism of a living system adjusting to new equilibrium.
6. Historical Parallels: 1974, 2008, 2011, and 2019
Each of these years marked an inflection between liquidity, inflation, and trust:
- 1974: Gold corrected 47% after its initial surge post-Bretton Woods, then tripled again as stagflation deepened.
- 2008: Gold dipped 30% during the financial panic, only to double by 2011 as QE expanded the monetary base 4×.
- 2019: The Fed’s repo operations quietly restarted QE — gold rallied 35% over the next year as liquidity normalized.
- 2025: Today’s correction mirrors those pauses — the system is catching its breath before another structural acceleration.
7. The Big Picture: Structure Over Sentiment
Day-to-day fluctuations make headlines, but the data doesn’t lie. Every indicator of systemic stress — from repo facility usage to central bank gold buying — still points upward for the metal that underpins real trust.
So yes, gold’s having a rough day. But zoom out, and it’s exactly where it needs to be. This correction isn’t weakness — it’s synchronization.
Gold’s long-term trajectory remains the same: higher highs, shorter cycles, greater velocity. The math hasn’t changed — only the timeframe has compressed.
Sources and References
- Investing.com Technical Gold Update (Oct 17, 2025)
- Federal Reserve Data Hub: Standing Repo Facility Usage
- U.S. Treasury: Monthly Treasury Statement (September 2025)
- Bank for International Settlements: Project Guardian Report (2024)
- World Gold Council: Gold Demand Trends 2024
- Yahoo Finance: Western Alliance Loan Fraud Disclosure (Oct 2025)
Gold doesn’t move in straight lines — it breathes. Today’s pullback is just one heartbeat in a much larger pulse. The system hasn’t changed direction; it’s preparing for the next surge.
#Gold #Finance #Markets #Macro #Inflation #QE #SoundMoney #PatternNexus
Qual é a sua reação?
 Curtir
0
Curtir
0
 Não gostei
0
Não gostei
0
 Amor
0
Amor
0
 Engraçado
0
Engraçado
0
 Uau
0
Uau
0
 Triste
0
Triste
0
 Bravo
0
Bravo
0

Founder of Pattern Nexus. I research markets, macro, geopolitics, AI, history, ancient systems, and the patterns most people overlook. I’m also building Market Radar, a trading scanner designed to read pressure, risk, confirmation, and setup quality before chasing a move. Pattern Nexus is where I connect the dots between data, history, technology, and the bigger system playing out around us.















Comentários (0)