
Morning Macro Report: Confidence Falls, Housing Cools, Inflation Splits, and Labor Weakens
morning-macro-report-confidence-housing-inflation-labor-2025-11-25
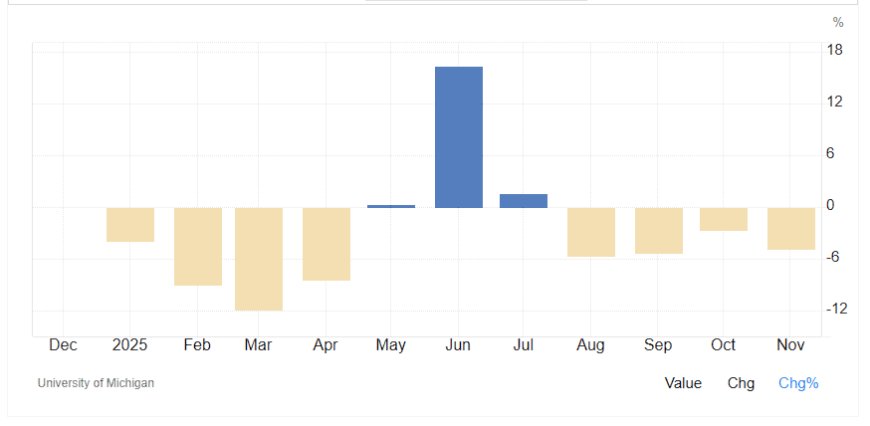
Morning Macro Report: Confidence Cracks, Housing Cools, and Producer Prices Re-Heat
Date: November 25, 2025
This morning’s data dump paints a very specific picture: households are getting nervous, price pressures at the consumer level look “tamed but not done,” producer prices are quietly re-accelerating, housing is shifting from “boom” to “slow bleed” in a lot of metros, retail spending is losing altitude, and high-frequency labor data are starting to fray.
At a Glance
- Consumer sentiment (University of Michigan) fell to 51.0 in November, down from 53.6 in October—extending a string of declines and sitting near multi-year lows.
- Inflation (CPI) is running around ~3% year-over-year, way down from the 8%+ peak, but monthly prints remain choppy rather than “victory-level” tame.
- Producer prices (PPI) for final demand rose 0.3% in September after a 0.1% decline in August, leaving the year-over-year pace at 2.7%.
- Retail sales for September increased just 0.2% versus expectations for a stronger print, confirming softer momentum after a strong summer.
- Home prices are still up year-over-year nationally, but growth has slowed to 1.3%–1.4% and a number of big metros are slipping in real terms and even nominally.
- ADP high-frequency labor data show U.S. private employers cutting an average of 13,500 jobs per week over the four weeks ending November 8, a stark contrast to October’s modest job gains.
Consumer Confidence: Households Finally Blink
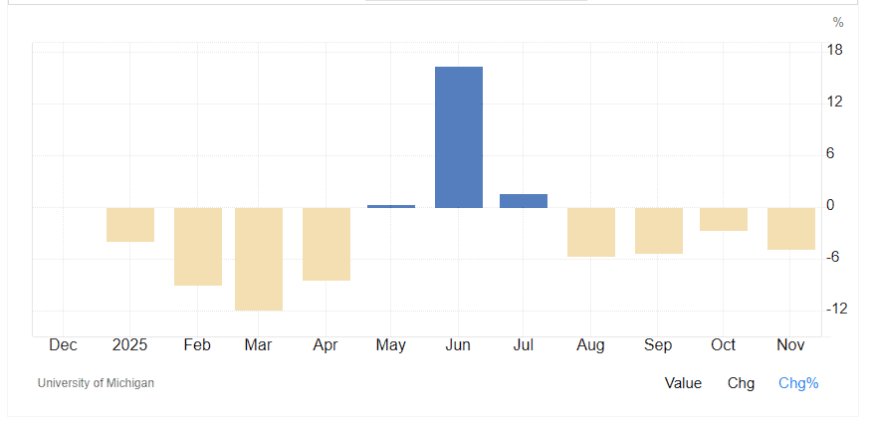
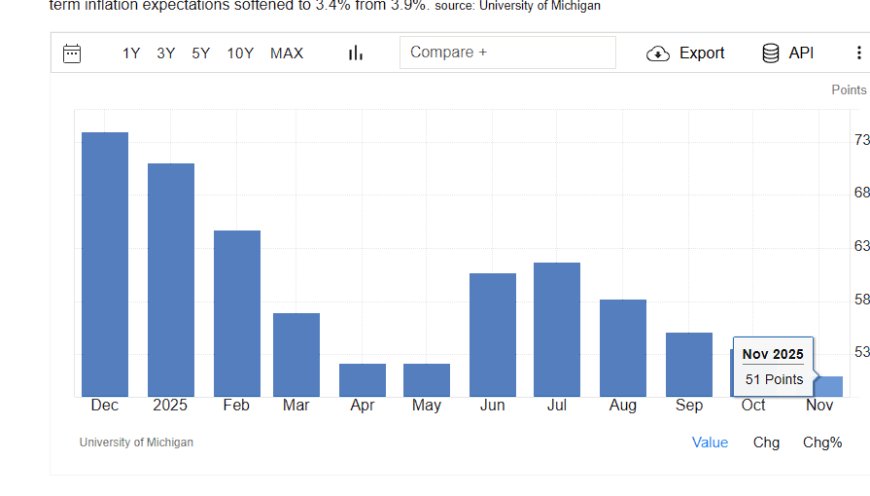
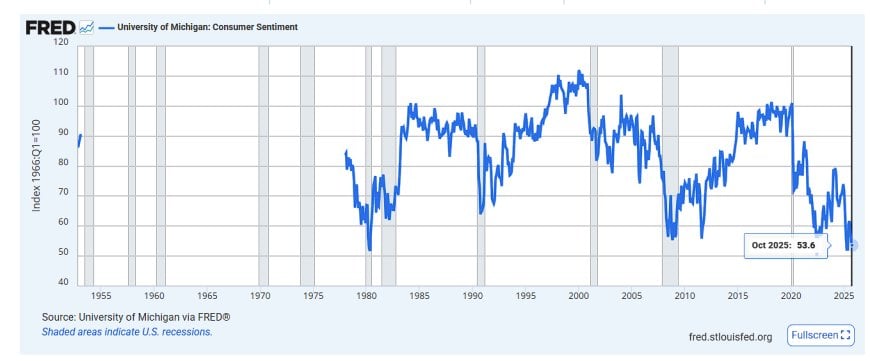
The University of Michigan’s Consumer Sentiment Index fell to 51.0 in November from 53.6 in October, extending a series of monthly declines and marking one of the weakest readings since the inflation shock period of 2022.
The weakness is concentrated in the expectations component, which has dropped back toward levels historically associated with recession risk. The current conditions component has also softened, but more gradually, signaling that people still see the present as “manageable” while turning much more negative on the outlook.
The big picture: you don’t get sustainable consumer-led expansions when forward expectations are this weak. With the index back in the low-50s—territory that has historically lined up with periods of economic stress—the consumer is shifting from “resilient” to “cautious,” which is consistent with what we’re seeing in retail and housing.
CPI vs. PPI: Consumer Prices Cool, Producer Prices Rewarm
CPI – The “Fallen, Not Finished” Story
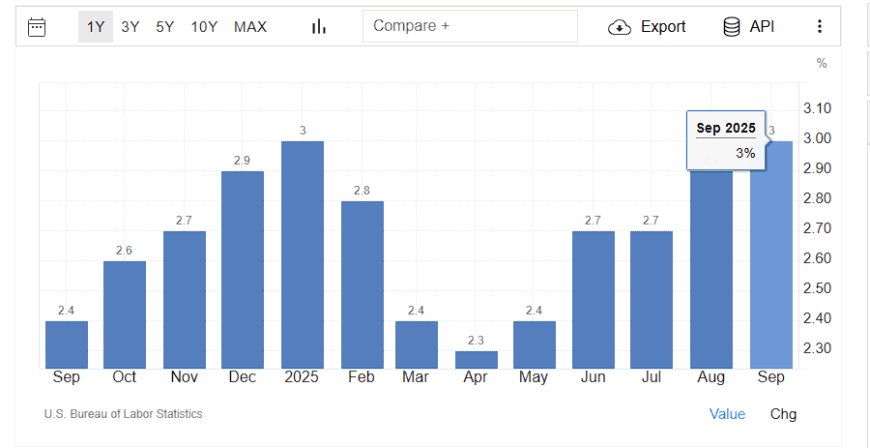
The latest official CPI release (September) showed headline inflation up 0.3% month-over-month and 3.0% year-over-year, with core CPI also at 3.0%. That’s miles below the 2022 peak, but still above the Fed’s target and consistent with a “sticky 3% world” rather than a clean return to 2%.
Inflation nowcasting suggests CPI is hovering around that same ~3% year-over-year range into Q4, with only modest drift. So from a directional standpoint, yes, CPI has “fallen”—but it has fallen into a plateau, not a clear glide path to 2%.
PPI – Energy and Goods Bite Back
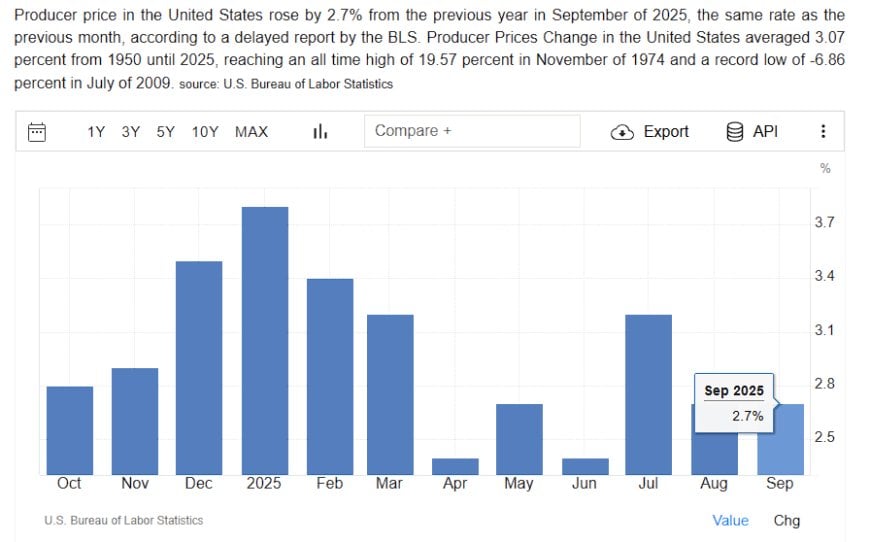
On the producer side, the Producer Price Index (PPI) for final demand rose 0.3% in September after a 0.1% decline in August. On a year-over-year basis, PPI is running at 2.7%.
The driver: energy and transportation costs—final demand transportation and warehousing services jumped 0.8% in September, offsetting weakness in other categories.
Put simply: CPI is telling you “we beat the fire back,” while PPI is whispering “embers are still hot under the floorboards.”
Housing: Nominally Up, Functionally Rolling Over
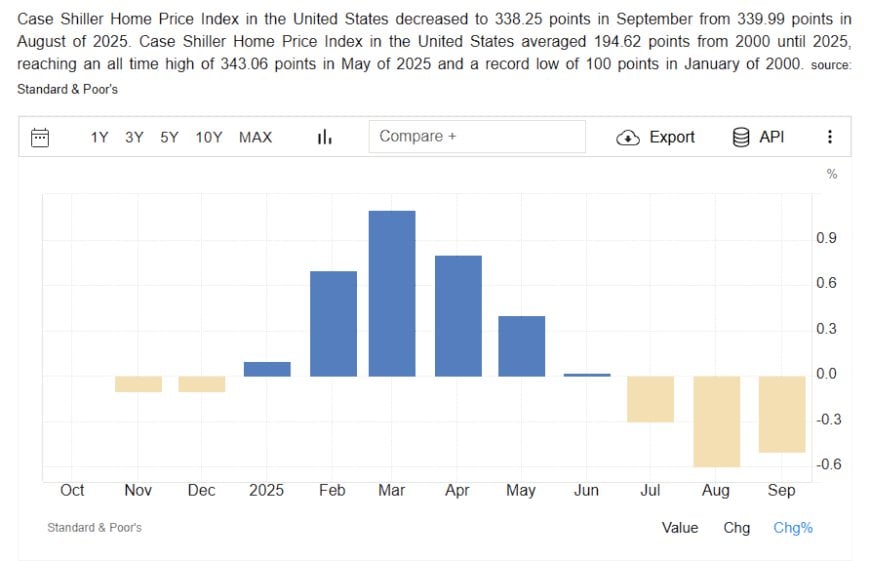
The S&P CoreLogic Case-Shiller U.S. National Home Price Index shows home prices up 1.3% year-over-year in September, a slight deceleration from 1.4% in August. The 20-city index is up 1.4% year-over-year, easing for the eighth straight month and marking the slowest pace since mid-2023.
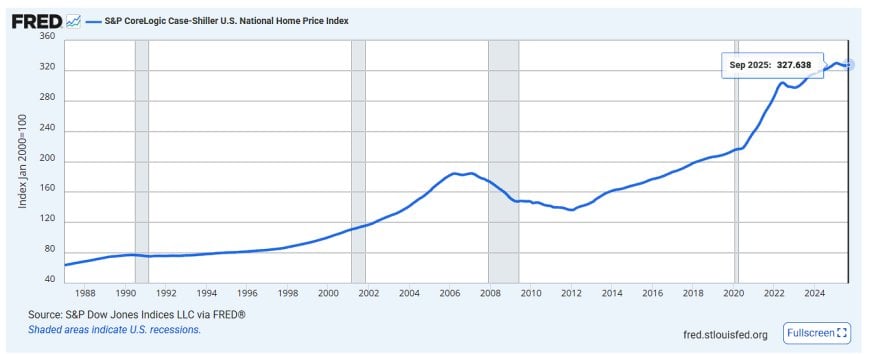
Under the hood, the picture is more fragile than the national average suggests:
- On a non-seasonally adjusted basis, Case-Shiller data show roughly a 0.3% month-over-month dip in September—another “gentle slide” in many big cities.
- Florida metros are leading the decline: Cape Coral, Naples, Punta Gorda and others are posting mid-single-digit to low-double-digit year-over-year price drops, reflecting the unwinding of pandemic booms, high insurance costs, and rising foreclosures.
- Meanwhile, some Rust Belt and secondary markets (Scranton, Syracuse, etc.) are seeing 8–10% price growth, purely on relative affordability and migration flows.
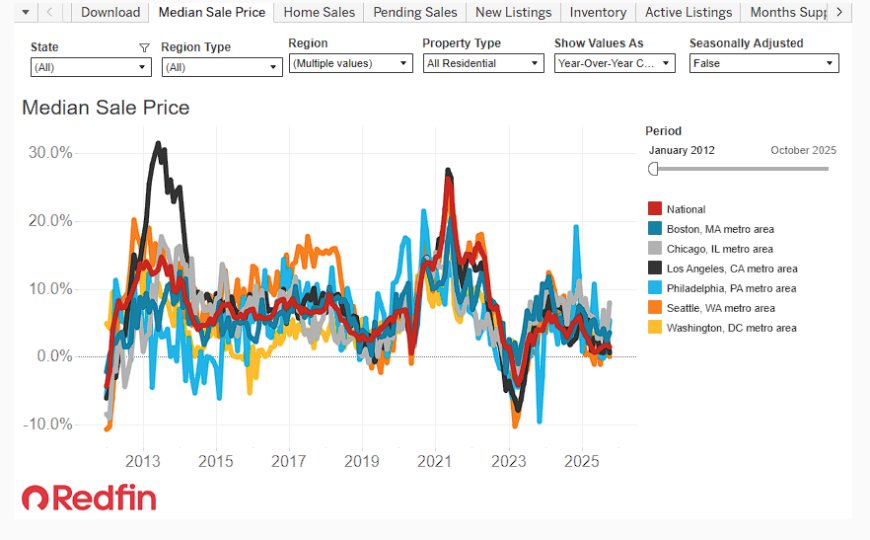
The important macro takeaway: housing isn’t catastrophically breaking, but price appreciation is no longer doing the heavy lifting for household balance sheets. That matters when you’re simultaneously seeing weaker confidence and slower retail spending.
Retail Sales: The Consumer Downshifts
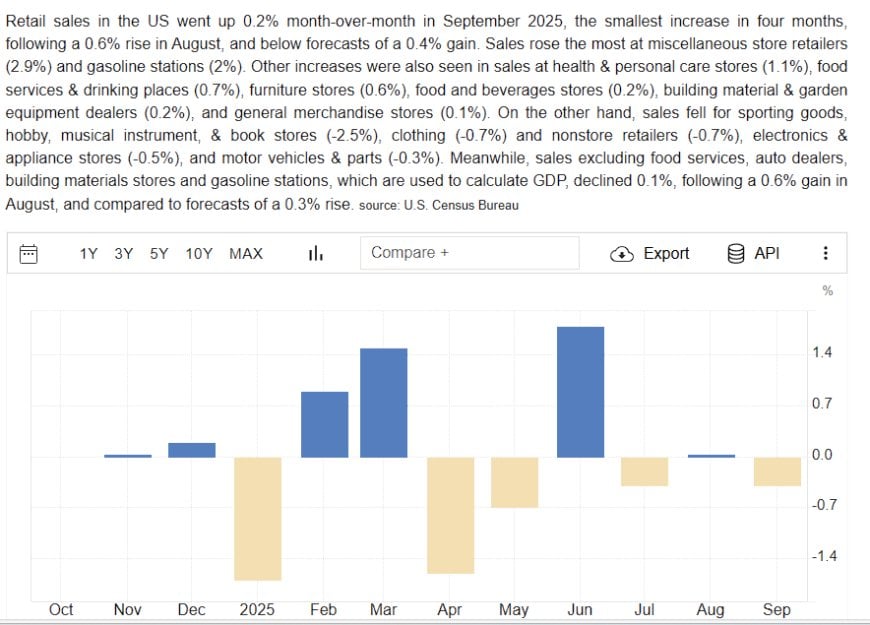
After a strong summer, U.S. retail and restaurant sales for September rose just 0.2% month-over-month in the delayed Commerce Department release, undershooting expectations for a stronger print.
Coverage framed it as “sales rose slightly … as resilient consumers moderated their spending after splurging over the summer”—which is exactly what the pattern shows: still-positive nominal growth, but a clear step down in momentum.
Adjusted for inflation running ~3%, that 0.2% nominal gain barely keeps real consumption flat. The mix also matters: nonstore (online) retailers and food services are still up solidly year-over-year, while more interest-sensitive and discretionary categories are softening.
Labor Market: ADP’s High-Frequency Pulse Turns Negative
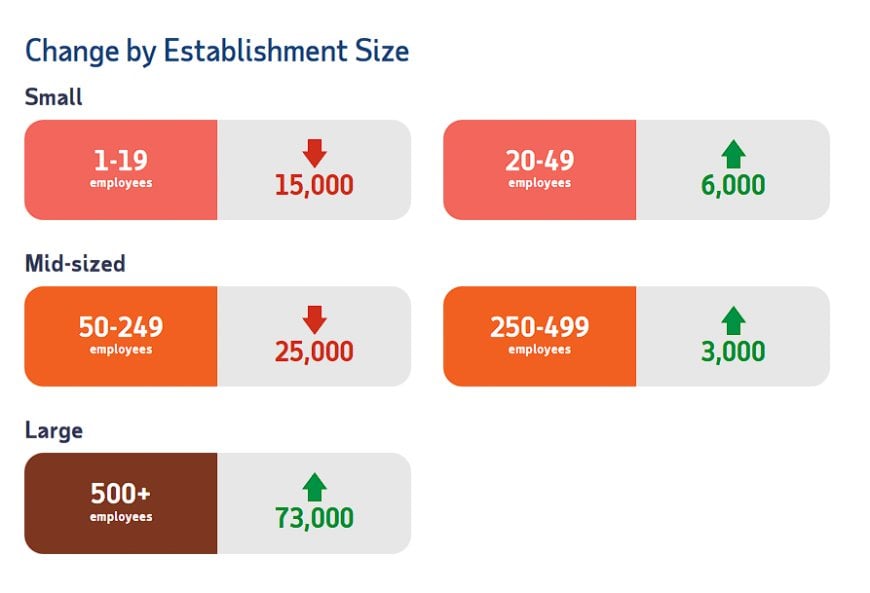
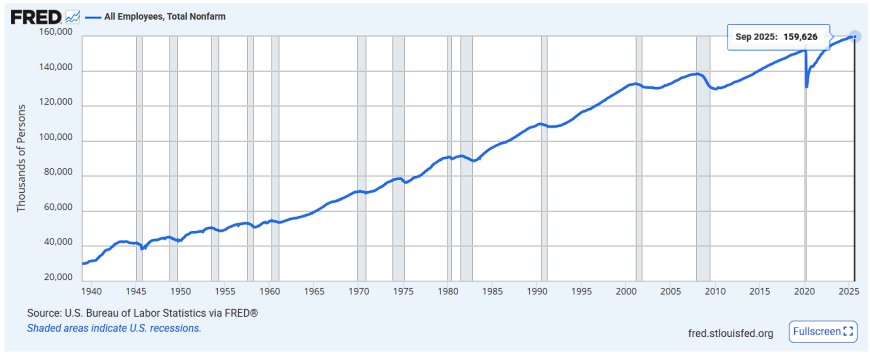
With the official BLS reports delayed, markets are leaning harder than usual on alternative indicators like ADP and private surveys. ADP’s new high-frequency NER Pulse estimate for the four weeks ending November 8 shows U.S. private employers shedding an average of 13,500 jobs per week.
That’s a sharp contrast with the October ADP report, which showed private payrolls up 42,000, itself a weak print by historical standards.
Other alternative trackers and staffing indicators are telling a consistent story: service activity is okay, but labor demand is softening at the margin, especially in interest-sensitive sectors.
Pattern Nexus Lens: How All the Pieces Fit Together
If you zoom out from the individual releases and look at the pattern, today’s data line up with a classic late-cycle configuration:
- Demand is fragmenting: Retail sales are slowing, housing appreciation is fading, and confidence is rolling over—especially in expectations.
- Inflation is “lower but sticky”: CPI has fallen from crisis levels but is stuck around ~3%, while PPI and energy costs keep quietly feeding pressure into the system.
- Labor is softening from the edges: ADP data and alternative indicators show hiring throttling back before you see headline job losses explode.
- Regional and sectoral divergence is accelerating: Florida-style boom markets correct, while undervalued Rust Belt and secondary metros still attract capital and migration.
For markets, that kind of tape usually means:
- Rates: Incoming data justify the market’s lean toward eventual easing, but sticky PPI and ~3% CPI limit how fast the Fed can pivot without losing credibility.
- Equities: Earnings get pinched between softer top-line growth (retail, housing, cyclical demand) and still-elevated input costs.
- Credit & housing: Slowly rising delinquencies and stressed metros matter more than headline national price indexes.
In other words: the “everything’s fine” narrative and the “recession tomorrow” narrative are both wrong. We’re in a grinding adjustment phase where the system bleeds off excess demand and speculative froth while still running hotter than a true 2% world.
Sources
Hyperlinks are provided here only, with no in-text external linking per Pattern Nexus style.
- University of Michigan – Surveys of Consumers (Sentiment Index)
- Bureau of Labor Statistics – Consumer Price Index (CPI)
- Bureau of Labor Statistics – Producer Price Index (PPI)
- Cleveland Fed – Inflation Nowcasting
- S&P CoreLogic Case-Shiller – U.S. Home Price Indices
- U.S. Census Bureau – Monthly Retail Trade
- ADP Research – National Employment Report & NER Pulse
- Reuters – U.S. macro and housing coverage
- AP / ABC – U.S. consumer and retail coverage
Какова ваша реакция?
 Нравится
0
Нравится
0
 Не нравится
0
Не нравится
0
 Любовь
0
Любовь
0
 Смешно
0
Смешно
0
 Вау
0
Вау
0
 Грусть
0
Грусть
0
 Сердитый
0
Сердитый
0

Founder of Pattern Nexus. I research markets, macro, geopolitics, AI, history, ancient systems, and the patterns most people overlook. I’m also building Market Radar, a trading scanner designed to read pressure, risk, confirmation, and setup quality before chasing a move. Pattern Nexus is where I connect the dots between data, history, technology, and the bigger system playing out around us.
















Комментарии (0)