
Mar 12, 2026 Market Wrap (Late Print): DXY 100, Brent 100+, VIX 27, and Why I’m Watching SPY for Another Flush
The “index optics” crowd can keep coping. Today the plumbing talked: VIX +12%, Brent back over $100, DXY camped at 100, and yields still elevated. Add a war-risk premium plus private credit stress and you get a tape that’s not done. Here’s the full systems read using my screenshots + the Mar 12 news flow.
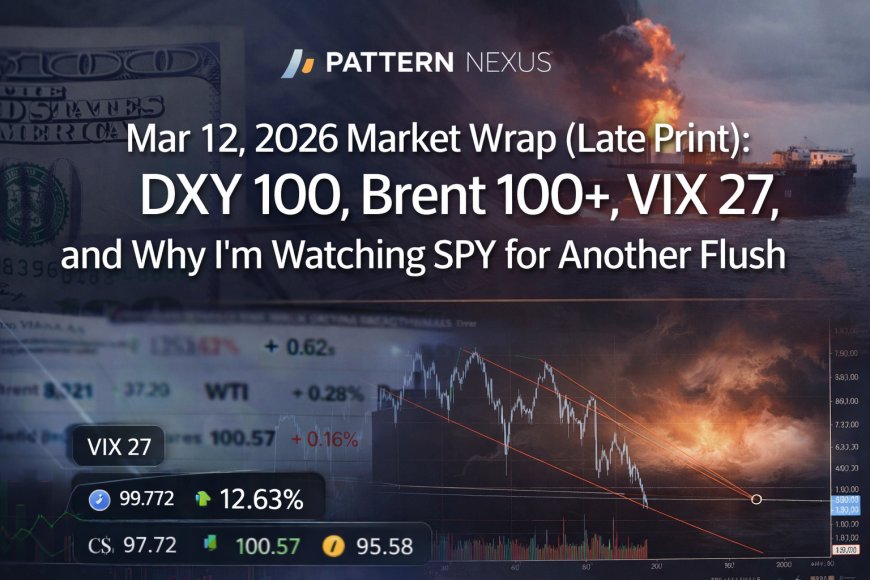

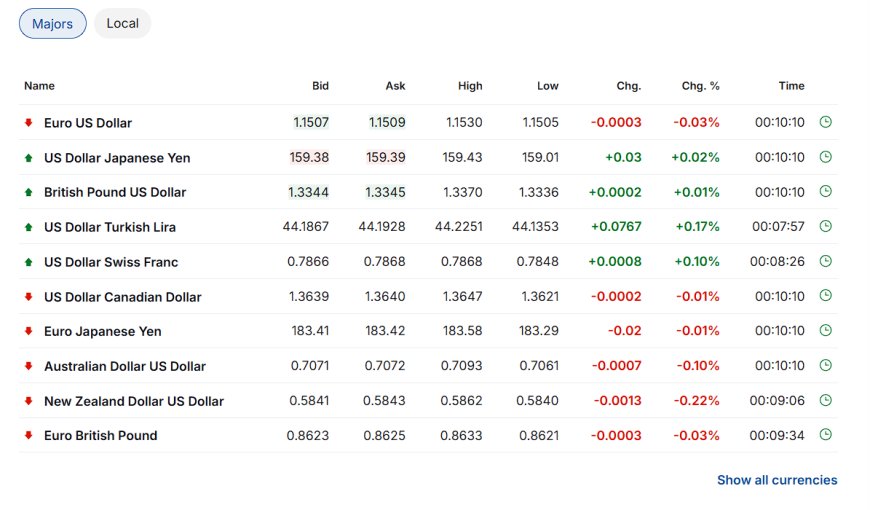
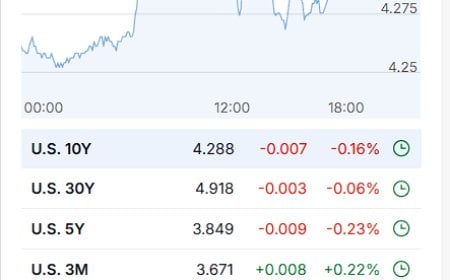
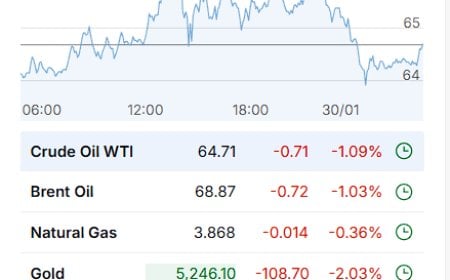
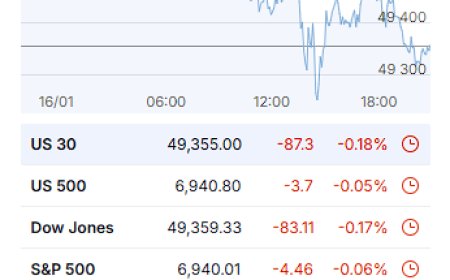
Today was not “normal.” S&P and Nasdaq got hit (-1.52% and -1.78% on my snapshot), VIX jumped to 27.29 (+12.63%), Brent is back over $100 (100.57), and DXY is basically camping at 100 (99.772). Yields are still elevated (10Y 4.262, 30Y 4.883) which means the Fed isn’t riding in on a white horse next week. Add the war-risk premium, plus the private credit fault line starting to show cracks, and you get a tape that can still flush. I’m looking for another move down on SPY because the structure is still bearish and the macro stack isn’t clearing.
If VIX is up double digits and Brent is over 100, “everything is fine” is just index optics.
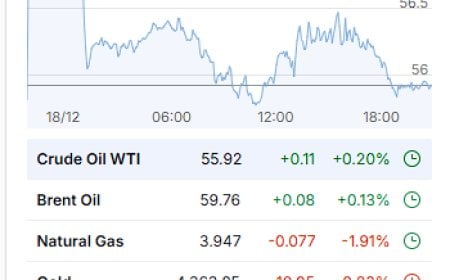
Brent > 100 while WTI lags = seaborne risk premium. That’s a physical-layer signal.
DXY at ~100 is funding preference. If it breaks and holds, the whole year reprices.
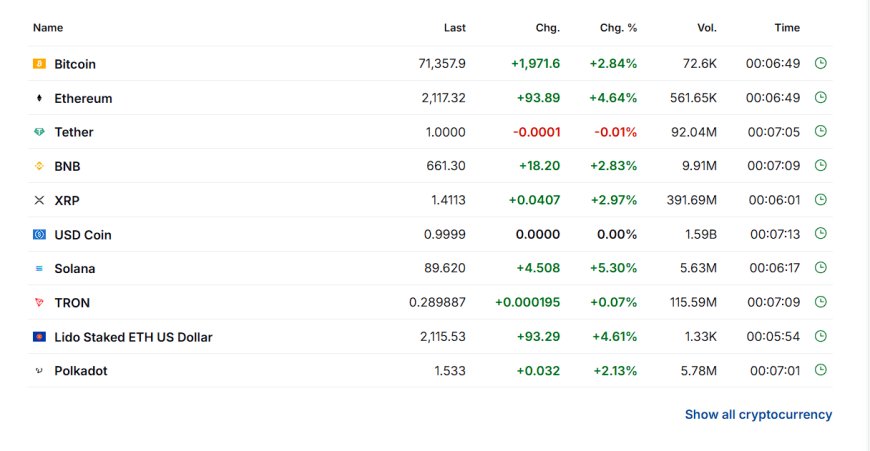
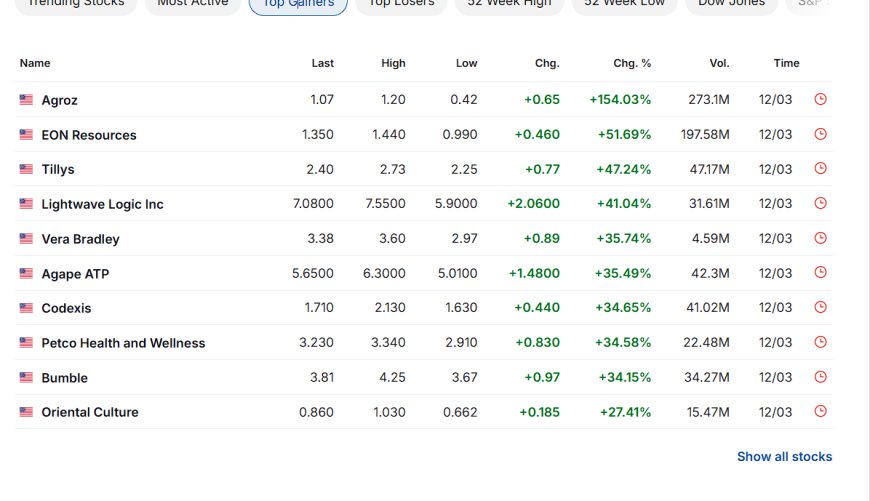
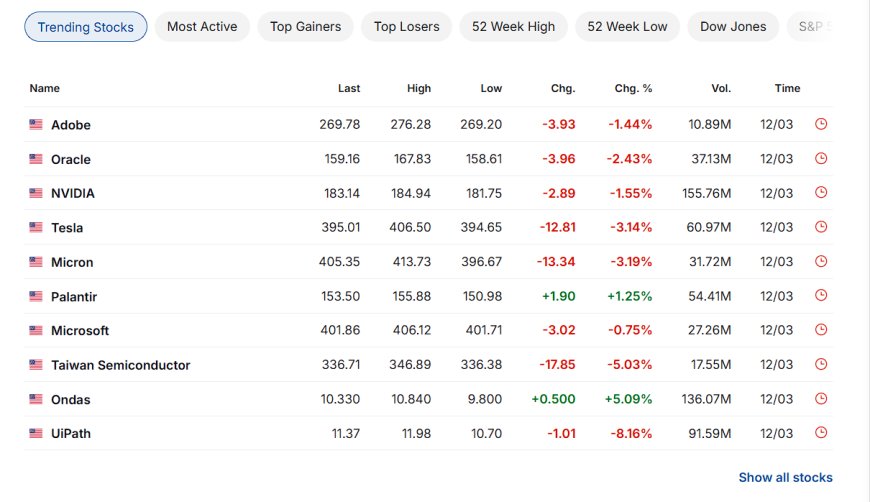
Snapshot: My Screens (Late Print)
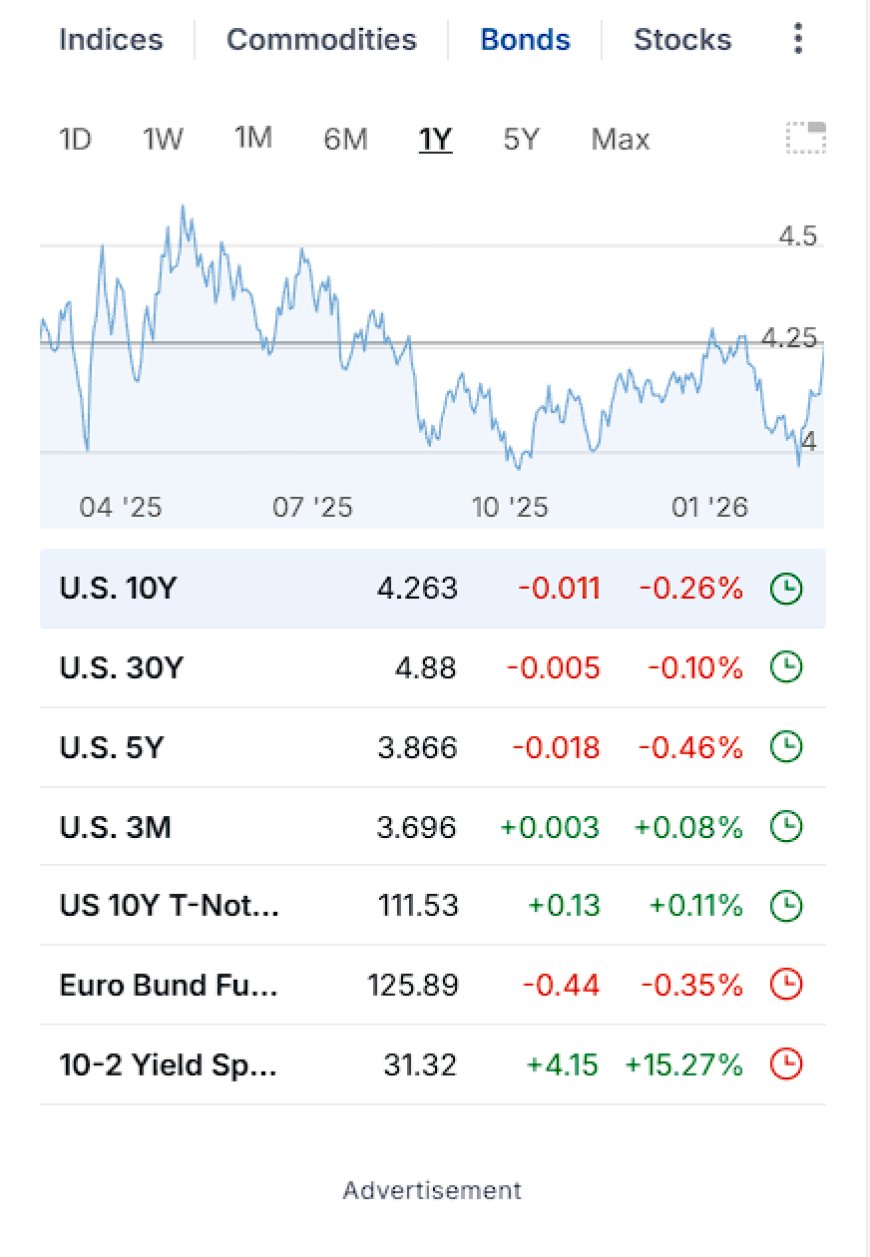
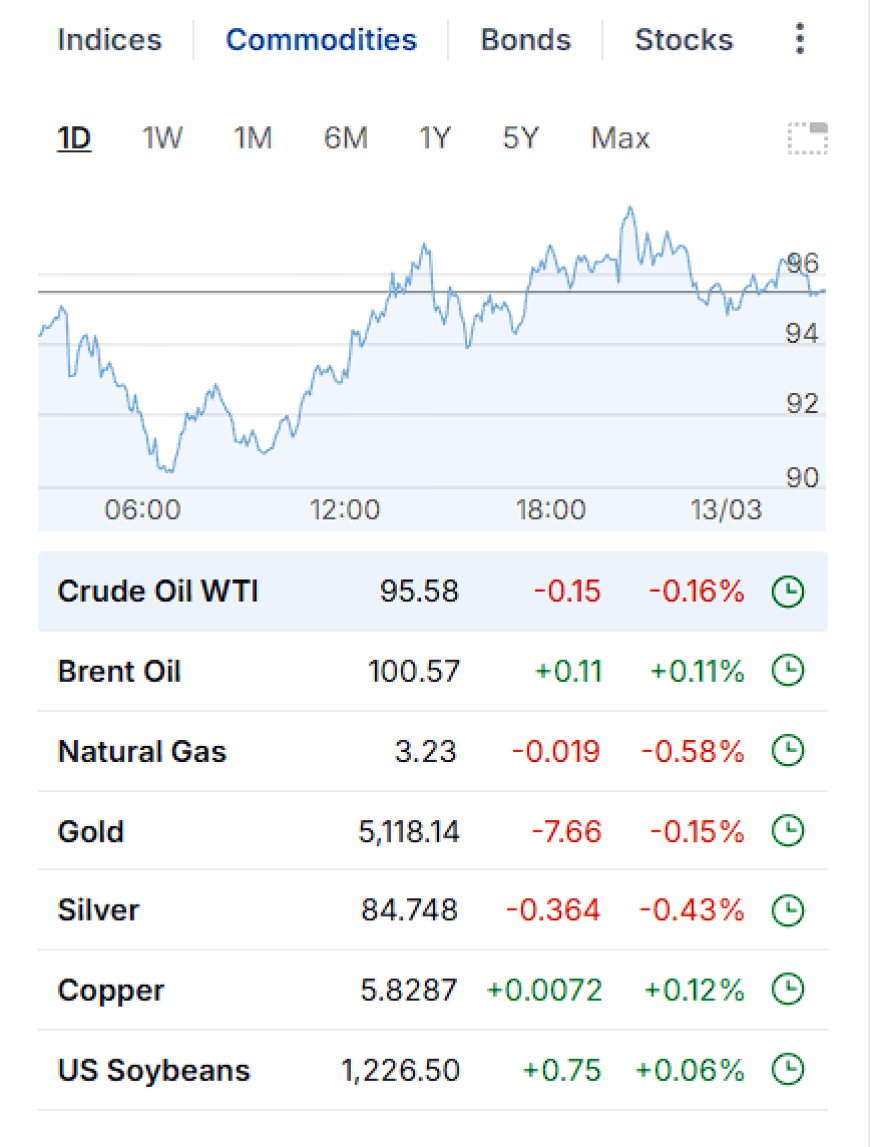
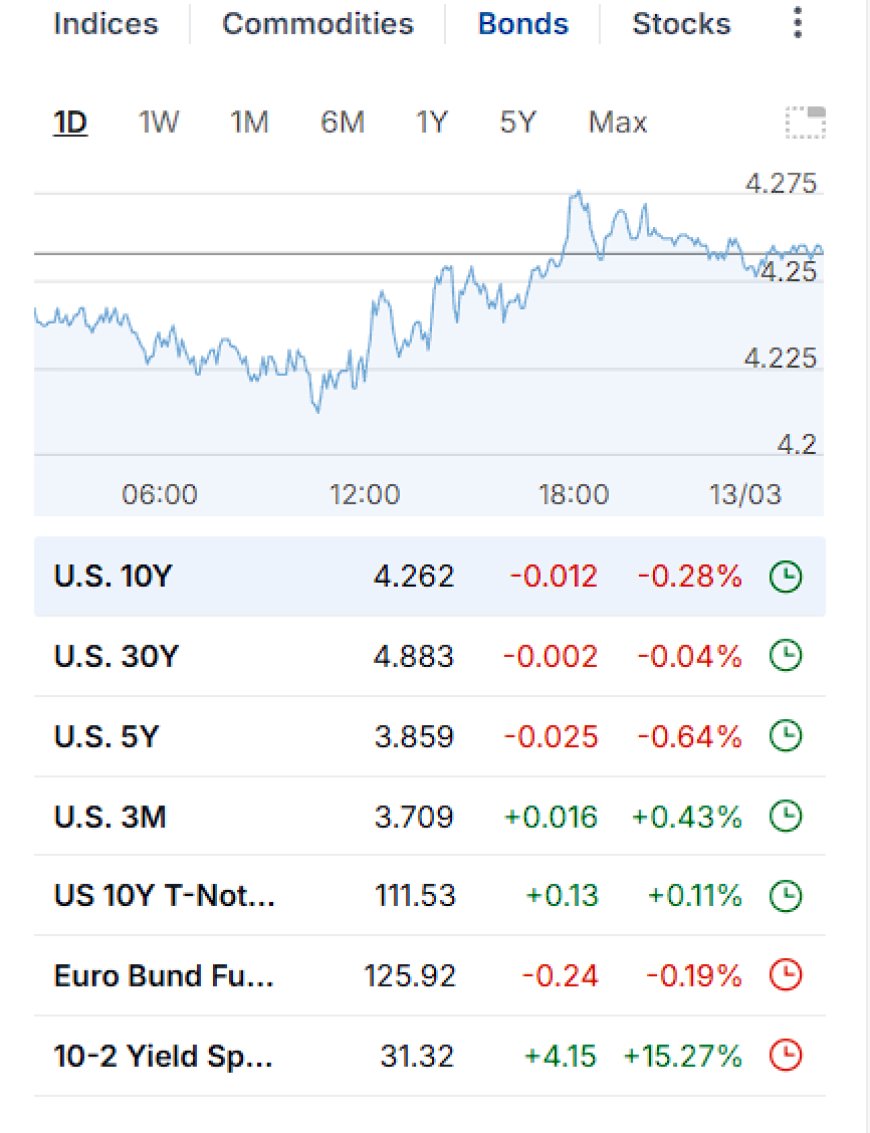
Everything below is pulled directly from my screenshots. This is the “late print” view, which is exactly how this tape trades: messy, fragmented, and easy to misread if you only look at one panel.
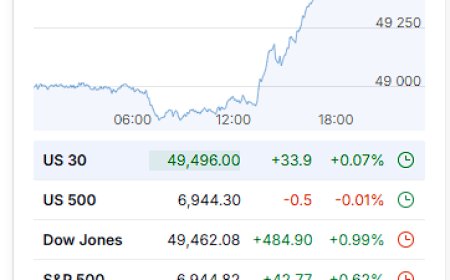
Important note: If you’re confused why “US500” is green while “S&P 500” is red, that’s a feed/timing issue. Different instruments, different session snapshots. I’m using this as a point-in-time print, not a settlement record.
The News Layer (What Actually Mattered Today)
Today’s market story wasn’t complicated. It was just uncomfortable.
- Iran war intensity: Reuters framed the session around intensified conflict and tanker strike risk pushing crude toward/over $100 and slamming equities.
- Fed boxed: Goldman pushed back its rate-cut timeline because the oil-driven inflation impulse makes early cuts harder to justify.
- Private credit stress: redemption limits and mark-downs are starting to show up more openly, right when the cost of capital is already high.
This is why the “it’s fine” crowd keeps getting chopped. The system isn’t clearing. It’s tightening.
The Plumbing Layer: VIX 27 + DXY 100
Here’s the part I care about: VIX was up +12% while DXY is basically on 100.
That’s the market paying for protection and paying for funding at the same time. That isn’t confidence. That’s managed exposure.
If we were actually stabilizing, you’d see the opposite: VIX compressing and DXY cooling. Today we got the “nope” print.
Energy: Brent Over 100 Is the Message
Brent over 100 matters more than people want to admit because it’s closer to the global/seaborne risk premium. WTI can lag for U.S.-specific reasons. Brent prices the corridor.
And this is where the inflation logic kicks in. Even if the market bounces tomorrow, the system doesn’t magically un-break shipping confidence. The premium can stay sticky because it’s not just “price.” It’s behavior.
Also: LNG is not a headline toy. LNG disruption shows up later, as “sudden” supply stress, because deliveries were delayed weeks earlier. That’s how the physical layer punches the macro layer in the face later.
Rates: Still Restrictive, Still Boxed
10Y 4.262. 30Y 4.883. 3M rising. This isn’t “easy money.” This is still restrictive capital.
That matters because everyone wants the Fed to fix the tape next week. But the Fed can’t cut into an inflation impulse without consequences. If oil stays elevated, cuts become toxic. That’s the box.
Equities: Dispersion, Air Pockets, and “Casino Greens”
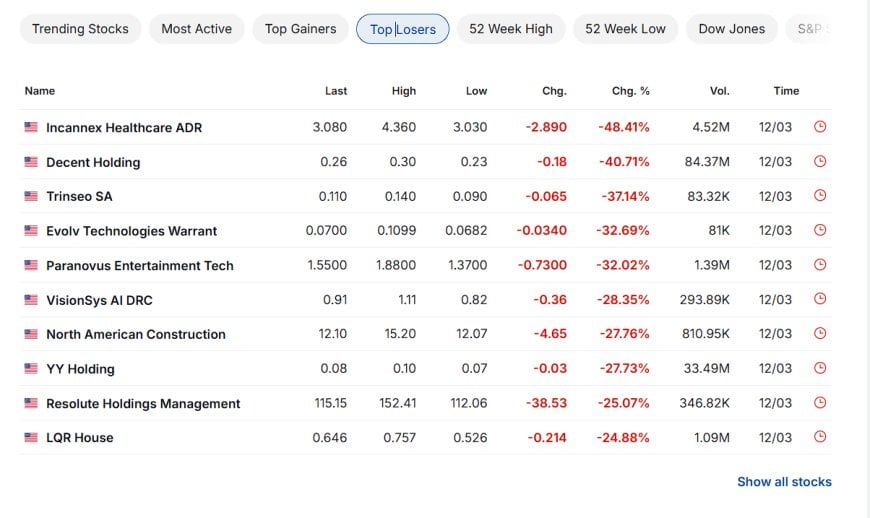
This tape is fragmented. You have pockets ripping and pockets collapsing. That’s not health. That’s dispersion under stress.
Crypto: Risk-On Pocket Inside a Risk-Off Tape
Crypto was green while equities were red. That happens in this regime because liquidity moves in pockets. Sometimes crypto becomes a pressure valve. Sometimes it’s just beta chasing.
Either way, it doesn’t override the macro tells. VIX + DXY + Brent is the real state of the system.
SPY Downside Map (What I’m Watching)
You said it straight: you’re looking for a move down on SPY. Same.
Not because I want it to happen. Because the structure is still bearish and the macro stack isn’t clearing.
- Why downside is still on the table: VIX 27, Brent 100+, DXY at 100, yields still elevated. That’s not an environment with a lot of slack.
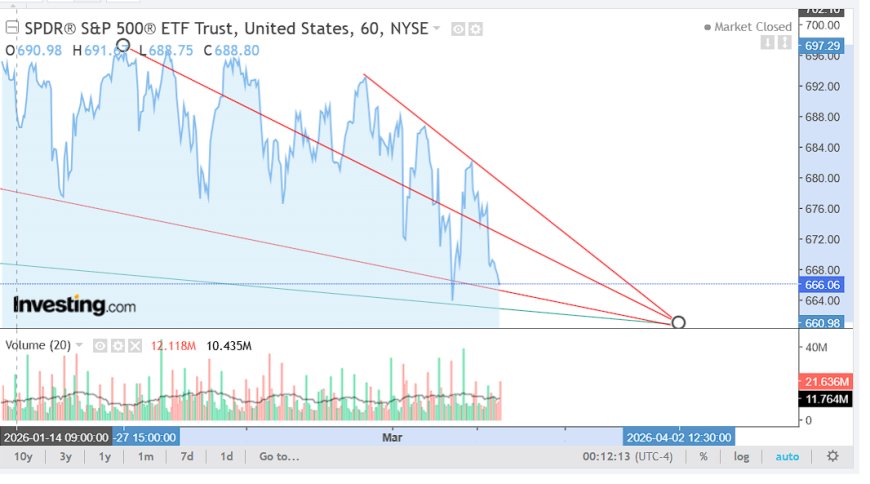
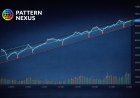
- What our chart shows: repeated lower highs, compression, and an obvious magnet zone underneath.
- Zones I’m watching from our chart: ~666 area and ~661 area (your marked levels). If those fail, it can accelerate.
- Invalidation concept: reclaim broken structure and hold above the downtrend lines. Not a wick. A hold.
This is my read and my map. I’m not telling you what to buy or sell. I’m telling you what the system is signaling and what levels I’m watching.
Pattern Nexus Lens
This is a control-systems tape.
The disturbance is war-risk plus energy throughput risk. The controller is policy expectations. The sensors are the things that don’t lie: VIX, DXY, Brent/WTI, yields, and credit behavior.
Today the sensors said constraint is still active. That’s why I’m not buying the “we’re fine” narrative.
If Brent holds over 100 and VIX is still elevated while DXY camps at 100, you’re not in a clean risk-on regime. You’re in a regime where flushes happen fast.
What I’m Watching Next
- DXY: does 100 break and hold, or reject?
- Brent: does it stay over 100, or fade back under?
- VIX: does it compress, or stay supported in the high 20s?
- Yields: do they actually relax, or stay pinned?
- SPY structure: does support break and hold below, or do we reclaim structure?
- Private credit: more redemption limits, more marks, more “quiet stress” becoming loud.
Sources
News anchors (Mar 12)
- Reuters: Wall St ends sharply lower as Iran war intensifies; crude pushes toward $100
- Reuters: Goldman pushes back Fed cut forecast amid inflation risks from the war
- Reuters: Morgan Stanley restricts redemptions at a private credit fund after withdrawals surge
- Reuters: Goldman raises crude forecasts; warns disruptions could push spot toward 2008 highs
Какова ваша реакция?
 Нравится
0
Нравится
0
 Не нравится
0
Не нравится
0
 Любовь
0
Любовь
0
 Смешно
0
Смешно
0
 Вау
0
Вау
0
 Грусть
0
Грусть
0
 Сердитый
0
Сердитый
0

Founder of Pattern Nexus. I research markets, macro, geopolitics, AI, history, ancient systems, and the patterns most people overlook. I’m also building Market Radar, a trading scanner designed to read pressure, risk, confirmation, and setup quality before chasing a move. Pattern Nexus is where I connect the dots between data, history, technology, and the bigger system playing out around us.












Комментарии (0)