
Bitcoin’s Structural Halving Cycle: Energy, Miner Economics, and the $38K Reset
A Pattern Nexus structural breakdown of Bitcoin’s halving cycle, miner energy economics, difficulty adjustment, cycle-to-cycle drawdown math, and why a $38K reset can be mechanical—not catastrophic.

Bitcoin is not “valued” like a company. It’s a programmed issuance schedule interacting with reflexive capital.
Every cycle feels “unprecedented” in headlines. Structurally, the same sequence repeats: supply shock → overshoot → leverage flush → miner reset.
Energy doesn’t set Bitcoin’s price, but it sets the survival boundary for miners, which affects forced selling and the bottoming process.
Bitcoin Fundamentals (What People Keep Missing)
Most writing about Bitcoin gets trapped in surface narratives: ETF flows, politics, “digital gold,” or whatever the trend-of-the-week is. Those factors can influence timing and amplitude, but they do not explain the core repeating structure.
The core structure is built from four mechanics that never change:
- Hard-capped supply: 21 million BTC maximum, with issuance distributed via block rewards.
- Deterministic issuance schedule: block subsidy halves on a roughly four-year rhythm.
- Difficulty adjustment: the protocol re-targets mining difficulty to keep blocks near ~10 minutes.
- Reflexive capital: price rises attract leverage and narrative capital; price declines force deleveraging.
A scheduled supply shock compresses miner revenue, price expands to compensate, speculation overshoots, then the system resets through leverage liquidation and miner capitulation until difficulty and cost structure re-equilibrate.
Once that’s understood, the “confusion” disappears. The cycle isn’t random. It’s algorithmic supply interacting with human leverage behavior.
Halving Cycle Mechanics (Issuance Shock)
Bitcoin mints new coins as a reward to miners who secure the network. That reward is the block subsidy (plus transaction fees). Roughly every four years, the subsidy is cut in half.
That halving is not symbolic. It is a direct revenue shock to the mining sector.
- Before halving: miners receive X BTC per block (plus fees).
- After halving: miners receive X/2 BTC per block (plus fees).
Unless fees double immediately (they rarely do in a stable way), the mining sector’s gross BTC revenue is cut ~50% overnight. That sets off a chain reaction:
- Phase 1: Revenue compression — less BTC paid out to miners per unit of hash.
- Phase 2: Price “must” adjust — if demand remains steady and new supply issuance falls, price pressure turns upward.
- Phase 3: Speculation piles in — expansion becomes narrative, leverage, and “cycle chasing.”
- Phase 4: Overshoot — price exceeds equilibrium; leverage becomes the marginal buyer.
- Phase 5: Reset — liquidity tightens or sentiment flips; leverage unwinds; miners get squeezed; capitulation and difficulty adjustment follow.
Because the halving changes the supply slope, and humans respond to slope changes with leverage. The leverage overshoots. The unwind becomes nonlinear. The system resets.
People often say “Bitcoin pumps because of the halving.” That’s incomplete. The halving is the ignition. The fuel is reflexive capital. The crash is the cleanup.
The Exponential Channel (Long-Run Geometry)
![[IMAGE_1_ALT_MONTHLY_SCREENSHOT]](https://patternnexus.com/uploads/images/202602/image_870x_698d3636c8274.jpg)
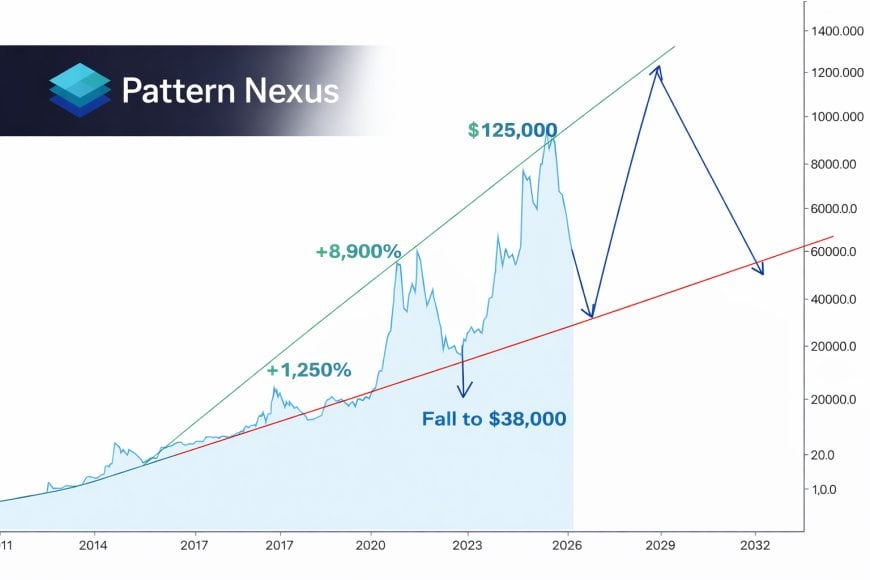
Bitcoin’s long-run structure is best understood as a broad exponential channel. This matters because exponential channels behave differently than linear trendlines.
In an exponential channel, the “middle” is the long-run growth trajectory, while the top and bottom bands represent the expansion and compression extremes.
Bitcoin repeatedly does three things inside that channel:
- Ride the channel in accumulation phases.
- Overshoot above the upper band during post-halving mania.
- Revert toward the lower band during the reset.
That doesn’t mean Bitcoin “must” touch the lower band every time. It means the structure regularly forces price discovery back toward the area where leverage is cleared and miners can survive again.
When people talk about “this time is different,” what they usually mean is “this time the narrative is different.” The geometry is not different.
Cycle-to-Cycle Percentage Math (Drawdowns + Multiples)
Here’s the part most analysts avoid: the actual percentage math cycle to cycle. If you want to understand Bitcoin structurally, you track peak-to-trough drawdowns and trough-to-peak multiples. The pattern is simple: drawdowns have been getting progressively less severe as the asset’s market cap has grown, but they remain large by normal asset standards.
Exact peaks and troughs vary slightly by exchange and by whether you use intraday highs/lows vs closing prices. The purpose here is structural math: the drawdown regime and the repeating magnitudes.
A clean structural snapshot:
| Cycle | Peak (USD) | Trough (USD) | Drawdown |
|---|---|---|---|
| 2011 peak → 2011 trough | $31.91 | $2.00 | -93.7% |
| 2013 peak → 2015 trough | $1,163 | $152 | -86.9% |
| 2017 peak → 2018 trough | $19,834 | $3,350 | -83.1% |
| 2021 peak → 2022 trough | $69,044.77 | $15,760 | -77.2% |
The trend is obvious: drawdowns are compressing over time (roughly -94% → -87% → -83% → -77%). That is exactly what you’d expect as liquidity deepens and the asset becomes more institutionally held. But “compressing” doesn’t mean “small.” A -70% drawdown is still normal in Bitcoin terms.
Historically, Bitcoin’s major-cycle peak-to-trough drawdowns cluster between roughly 75% and 90%, with a clear long-run tendency toward the lower end of that range as the market matures.
Now apply that math to a hypothetical peak near $125K (or a recent peak in that region). A 70% drawdown from $125K is $37.5K. That is the entire “why $38K” argument in one line. It’s not fear. It’s arithmetic consistent with the regime.
| Peak scenario | Drawdown | Target |
|---|---|---|
| $125,000 | -70% | $37,500 |
| $125,000 | -75% | $31,250 |
| $125,000 | -80% | $25,000 |
The question is not “can Bitcoin go down that much.” The question is “what drawdown band is consistent with the historical regime and the current maturity phase.” If the regime has compressed toward -70% to -80%, then $38K is a reasonable structural waypoint.
Miner Economics Model (Energy, Breakeven, Capitulation)
Here’s the missing piece: miners are not abstract. Mining is an industrial energy business. The network converts electricity into security, and miners get paid in BTC for doing it. That payment schedule is known. Costs are not.
Miner behavior matters because miners are a consistent, structural source of supply:
- Miners sell BTC to pay operating expenses (power, hosting, staff, repairs).
- In bull phases, miners can hold more (less forced selling).
- In bear phases, miners must sell more (forced selling increases).
- At extremes, miners shut off (capitulation), and difficulty adjusts lower.
Price doesn’t follow electricity directly. Hashrate follows price. But electricity sets the shutdown threshold, which shapes capitulation and bottom formation.
1) Revenue model
Expected BTC earned per day is proportional to hash share:
BTC_per_day = blocks_per_day * (block_subsidy + avg_fees) * (miner_hashrate / network_hashrate)

blocks_per_day ≈ 144
block_subsidy = 3.125 BTC (post-2024 halving)
avg_fees = variable (regime-dependent)
Convert to dollars:
USD_revenue_per_day = BTC_per_day * BTC_price
2) Cost model
Power is the dominant variable cost. A simple power cost model:
power_kW = (J_per_TH * TH_per_second) / 1000
kWh_per_day = power_kW * 24
USD_power_per_day = kWh_per_day * electricity_price_per_kWh
Then add non-power costs (hosting, labor, maintenance) and capital costs (hardware amortization):
USD_total_cost_per_day = USD_power_per_day + USD_fixed_opex_per_day + USD_capex_amort_per_day
3) Breakeven price
Breakeven happens when revenue equals cost:
BTC_price_breakeven = USD_total_cost_per_day / BTC_per_day
4) A concrete example (illustrative)
This is not a claim about any specific miner. It’s a demonstration of why “energy costs matter” in a structural way.
- Miner hashrate: 1 PH/s (1,000 TH/s)
- ASIC efficiency: 30 J/TH
- Electricity: $0.05/kWh
- Network hashrate: 600 EH/s (illustrative)
- Subsidy: 3.125 BTC
- Avg fees: 0.4 BTC/block (illustrative)
Power draw: 30 J/TH * 1,000 TH/s = 30,000 J/s = 30 kW → 720 kWh/day → $36/day power cost.
Expected BTC/day:
- Hash share = 1 PH / 600 EH = 1e15 / 6e20 = 1.67e-6
- BTC/day ≈ 144 * (3.125 + 0.4) * 1.67e-6 ≈ 0.000846 BTC/day
At $67K BTC price, revenue ≈ 0.000846 * 67,000 ≈ $56.7/day.
Now add: hosting + maintenance + staff + amortization. If non-power costs are ~$20/day for this slice of hash, total costs are ~$56/day, implying breakeven near the current price.
When price falls hard, marginal miners go underwater. That forces selling and shutdowns. Shutdowns lower hashrate. Difficulty retargets down. Surviving miners become profitable again. That feedback loop is part of the bottoming process.
5) Miner capitulation as a “reset valve”
Bitcoin has a built-in pressure relief mechanism: difficulty adjustment. If price collapses and miners shut off, blocks slow temporarily, then difficulty drops, and remaining miners earn more BTC per unit of hash.
That is why miner capitulation often clusters near major bottoms. It’s not superstition. It’s the system re-pricing its own production economics.
6) What the halving does to miner breakeven
If fees don’t rise, the halving cuts subsidy in half. That means, all else equal, miners need roughly double the BTC price to maintain the same dollar revenue per unit of hash.
This is the simplest driver of the post-halving expansion phase: the system “wants” a higher price regime to keep industrial security funded.
Why a $38K Reset Can Be “Normal”
![[IMAGE_2_ALT_WEEKLY_SCREENSHOT]](https://patternnexus.com/uploads/images/202602/image_870x_698d3637dbc58.jpg)
A $38K target is not about being bearish. It’s about respecting the regime. In Bitcoin, deep retracements are the rule, not the exception.
Structurally, resets happen when three pressures align:
- Leverage liquidation: marginal buyers disappear; forced sellers appear.
- Miner squeeze: price falls toward or below marginal cost; forced selling increases.
- Liquidity contraction: broader risk appetite compresses; correlations rise.
If the cycle peak is ~$125K and the drawdown regime compresses toward ~-70%, the reset target is ~$37.5K. That’s it. It’s not mystical.
Historically, the deepest pain points in Bitcoin are the points where the market stops pretending it is a straight-line adoption chart and reverts to what it actually is: a reflexive asset with a deterministic issuance schedule and a brutally honest leverage cleanup process.
And after the cleanup, the cycle eventually rebuilds again because the underlying issuance schedule does not change.
Pattern Nexus Lens
Bitcoin is a protocol-defined supply shock asset sitting on top of a human-defined leverage machine. The protocol enforces scarcity on schedule. Humans respond with narratives, leverage, and momentum chasing. That combination guarantees overshoots and resets.
In systems terms, Bitcoin behaves like a repeating control loop:
- Input: deterministic halving reduces supply issuance.
- Amplifier: reflexive capital and leverage expand the move.
- Instability: overshoot becomes fragile; marginal buyers vanish.
- Stabilizer: liquidation + miner capitulation + difficulty adjustment.
- New baseline: survivors consolidate; the next expansion builds.
The “crash phase” is not a bug. It’s the system’s forced deleveraging and industrial re-pricing event, repeated across every halving era.
FAQ
Is Bitcoin’s cycle “guaranteed”?
No market path is guaranteed. The point is regime behavior: a deterministic issuance schedule interacting with leverage has repeatedly produced the same sequence. The exact levels can vary, but the structural phases have been consistent.
Does electricity cost set the Bitcoin price?
Not directly. Price drives hashrate, and hashrate drives difficulty. Electricity cost sets the marginal survival boundary for miners, which affects forced selling and shutdown thresholds during drawdowns.
Why do drawdowns appear to be shrinking over time?
Liquidity depth, market structure, and broader ownership tend to reduce extreme tails as an asset matures. Bitcoin’s historical drawdowns show a clear compression trend, but the regime is still far more volatile than traditional assets.
Why doesn’t mainstream coverage explain this clearly?
Because it’s easier to sell narratives than to teach mechanics. A structural explanation requires talking about issuance schedules, difficulty adjustments, industrial cost curves, leverage reflexivity, and cycle statistics. Most coverage is built for attention, not comprehension.
Sources
Sources supporting issuance mechanics, historical peaks/troughs, and the recurring cycle structure (note: different providers show small differences due to exchange selection and intraday vs close).
- Bitcoin Whitepaper (Satoshi Nakamoto)
- Bitcoin Wiki: 2011 year summary (early-cycle peak reference)
- Forbes: Illustrated history of Bitcoin crashes (2011 crash to ~$2 reference)
- Bitcoin crash history (2013 peak ~$1,163 and 2015 trough ~$152 reference)
- Bitbo: 2017 price (peak reference)
- Bitbo: 2022 price (trough reference)
- StatMuse: 2022 low date/level reference
- Binance Square: 2021 ATH reference (~$69,044.77)
- Investing.com: BTC historical data (provider reference)
Vad är din reaktion?
 Gilla
0
Gilla
0
 Ogilla
0
Ogilla
0
 Kärlek
0
Kärlek
0
 Rolig
0
Rolig
0
 Wow
0
Wow
0
 Ledsen
0
Ledsen
0
 Arg
0
Arg
0

Founder of Pattern Nexus. I research markets, macro, geopolitics, AI, history, ancient systems, and the patterns most people overlook. I’m also building Market Radar, a trading scanner designed to read pressure, risk, confirmation, and setup quality before chasing a move. Pattern Nexus is where I connect the dots between data, history, technology, and the bigger system playing out around us.















Kommentarer (0)