
CPI (November 2025): Headline Cooling, Energy Re-Acceleration, and the “Two-Month CPI” Problem
Published: December 2025
By: Pattern Nexus
The headline rate is cooling. The structure is not. November 2025 CPI lands at 2.7% YoY while energy re-accelerates and electricity continues its slow ratchet higher. Complication: October survey pricing was not collected due to the federal shutdown, so the clean read is in the September-to-November two-month deltas and the category anatomy, not a single-month print.
Snapshot
Headline CPI (All Items): +2.7% year-over-year (Nov 2025, not seasonally adjusted).
Core CPI (Less Food & Energy): +2.6% year-over-year.
Energy: +4.2% year-over-year (reasserting itself as the marginal driver).
Food: +2.6% year-over-year (food at home +1.9%, food away from home +3.7%).
This report is “clean” only if you read it correctly: the inflation rate is not re-accelerating at the top line, but the system is not returning to a 2010s-style low-inflation equilibrium either. The post-2020 regime remains defined by higher baseline services inflation and periodic energy-driven pulses that re-price household budgets faster than headline CPI implies.
In this print, energy is back above the core rate, electricity is firmly elevated on a long-run chart, and regional/metro dispersion remains a feature of the cycle rather than noise.
The Shutdown Distortion: Why This Is a Two-Month CPI
BLS did not collect survey data for October 2025 due to a lapse in appropriations, and those survey prices could not be retroactively collected. CPI data collection resumed mid-November. Practically, this means the headline narrative should be framed around the two-month, seasonally adjusted change from September 2025 to November 2025, not an October-to-November story.
Two-month read-through (Sep → Nov, seasonally adjusted):
- All items: +0.2%
- Core (less food & energy): +0.2%
- Shelter: +0.2%
- Energy: +1.1%
- Food: +0.1%
That mix is the story: core and shelter are sticky-but-contained over the two-month window, while energy is doing the moving. This is exactly the configuration that can keep “inflation expectations” alive even when the headline YoY rate is drifting lower.
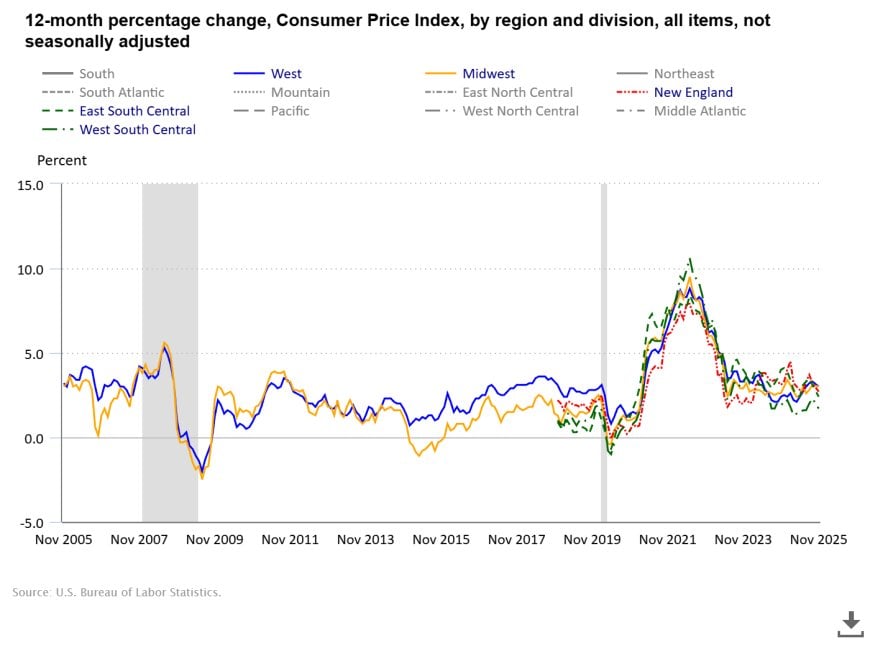
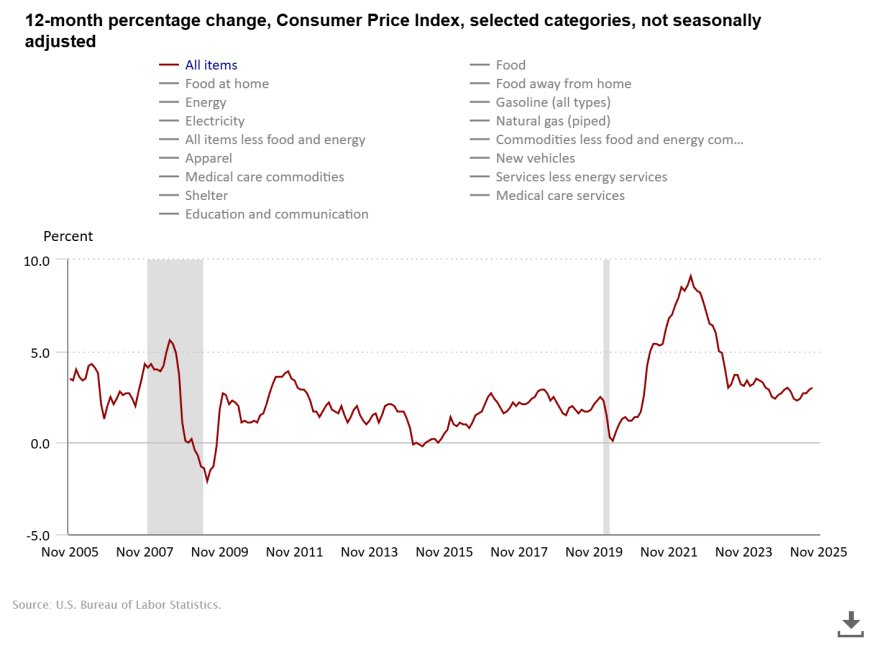
Chart: Headline CPI Regimes (2005–2025)
The long-run chart is the best antidote to narrative whiplash. It shows a pre-2020 world where inflation oscillated but remained structurally capped, and a post-2020 world where inflation becomes regime-driven: once the system reprices, it does not simply “snap back.” The peak is behind us. The elevated baseline is not.
Major Categories: Energy Leads, Core Sticks
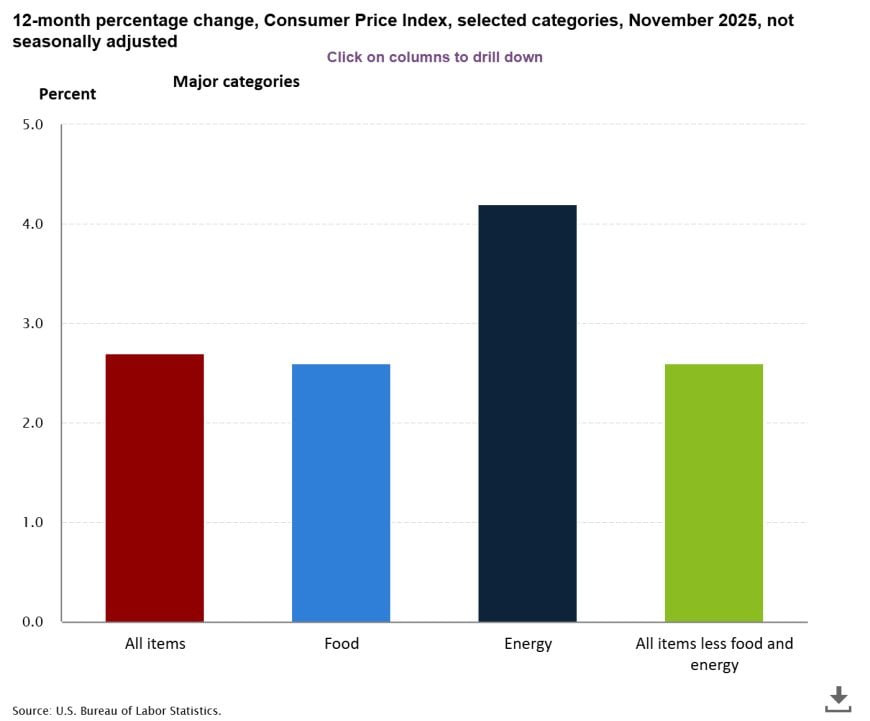
From a macro positioning perspective, this is a classic “headline looks fine, internals keep you honest” CPI setup.
What matters in this configuration:
- Energy above core means the next inflation impulse can arrive quickly (transportation, utilities, services pass-through).
- Core at ~2.6% signals services and administered pricing remain firm; the disinflation phase is incomplete.
- Food-away-from-home still higher is consistent with wage-intensive service categories staying sticky.
This is not a “back to 2% and done” print. It is a “cooling headline with embedded cost pressure” print.
Electricity: The Quiet Ratchet
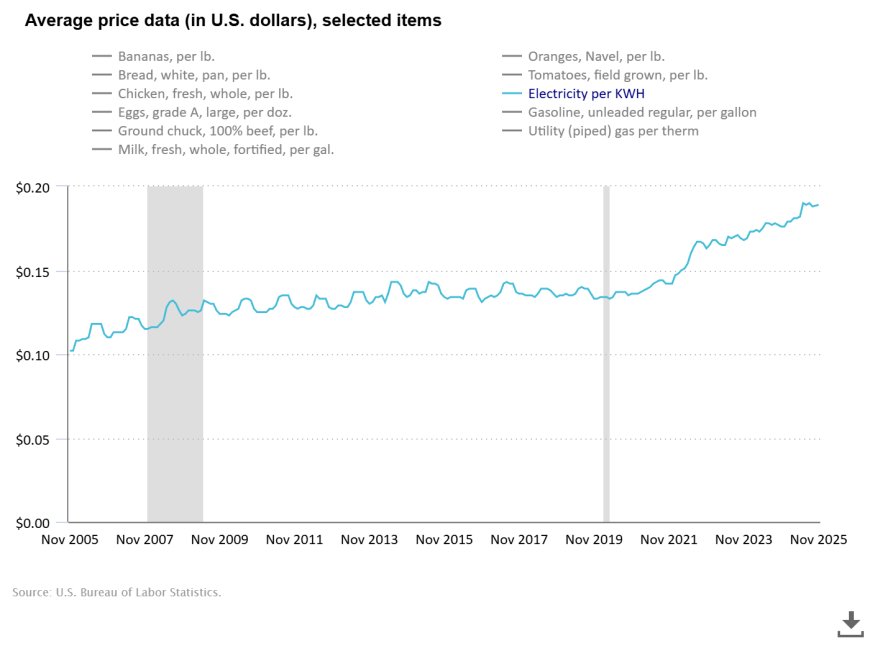
Electricity is one of the most under-discussed inflation channels because it does not usually crash the way gasoline can. It trends. It sticks. And it feeds everything: households directly, businesses through operating costs, and services through the cost structure of “normal life.”
When electricity runs elevated for years, it behaves like a structural tax on the consumption basket. That is why “inflation feels higher than CPI” complaints persist even as headline YoY prints cool: the day-to-day budget lines that do not mean-revert are the ones that shape lived experience.
Metro Inflation: Divergence Returns
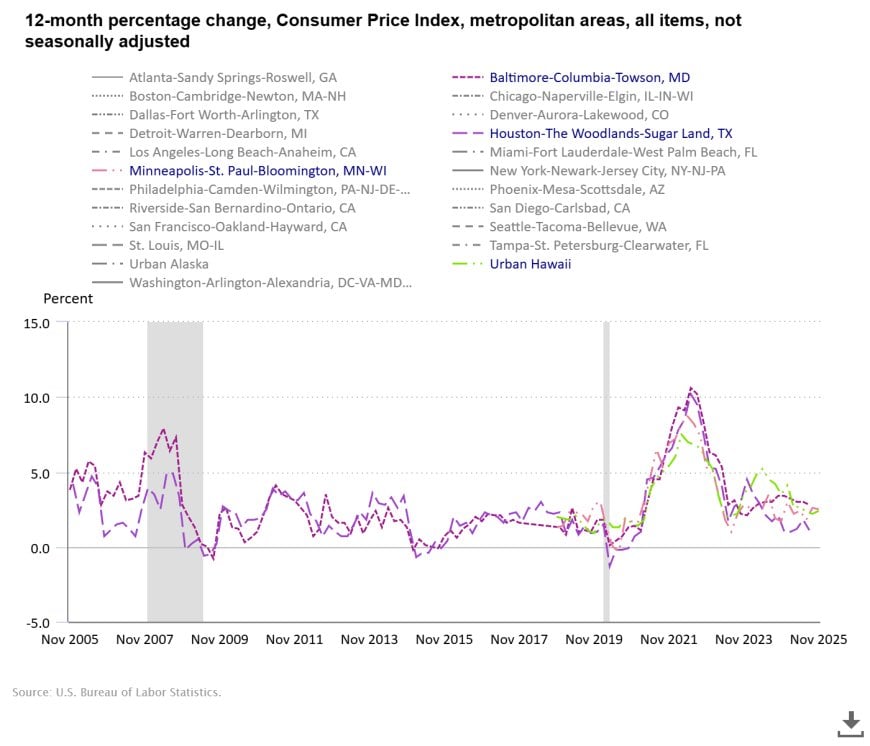
The metro chart is the reminder that CPI is not lived uniformly. Housing mix, utility structures, migration, and local wage dynamics create persistent differences across metros. The peak inflation era produced synchronized spikes. The post-peak era produces divergence.
Why divergence matters:
- National CPI can understate stress in high-cost metros even when the national average cools.
- Policy responses calibrated to the national average can be too tight for some regions and too loose for others.
- Regional and metro inflation regimes affect local politics, wage demands, and household formation decisions (rent vs buy).
Regions & Divisions: Geography Still Matters
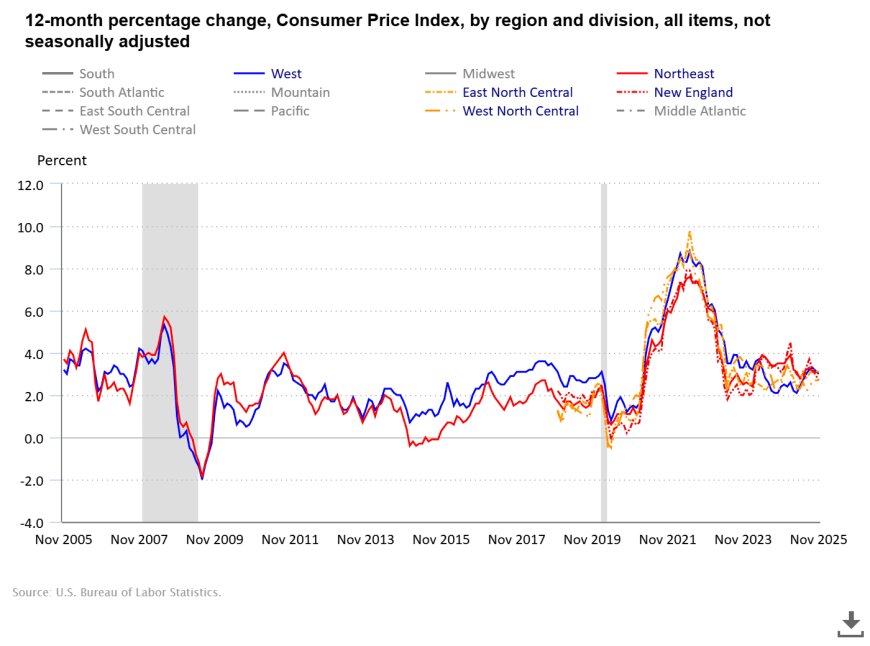
The regional and division charts reinforce the same structural point: inflation’s retreat is not symmetric. Some regions mean-revert faster. Others carry a higher baseline. In the post-2020 regime, housing and utilities interact with labor markets and insurance costs in ways that keep regional inflation “sticky” even when the national headline softens.
For investors and operators, this is actionable: inflation-sensitive sectors do not respond uniformly across the country. The “same business, different ZIP code” effect is real.
PN Lens: What CPI Is Signaling in the Liquidity Cycle
In Pattern Nexus terms, this CPI print reads like a system that has cooled the post-shock impulse but has not unwound the embedded cost structure. That distinction matters.
Three takeaways that actually matter:
- Disinflation is real at the headline level (2.7% YoY), but the baseline is still elevated versus the 2010s.
- Energy is the swing factor again (+4.2% YoY) and can re-inject inflation psychology quickly even if core stays steady.
- Electricity is the long-duration pressure: it behaves like a ratchet and keeps the “cost of living floor” high.
The shutdown distortion makes it easier for narratives to cherry-pick. The correct read is not “one month changed everything.” It is: the system is trending cooler, but the structure is still inflation-prone when energy pulses and when services costs do not fully mean-revert.
FAQ
Why are October-to-November monthly CPI changes missing or hard to interpret?
BLS did not collect CPI survey data for October 2025 due to a lapse in appropriations. Those survey prices could not be retroactively collected, so the cleanest near-term signal is the seasonally adjusted change over the two months from September to November.
If headline CPI is 2.7% YoY, why does it still feel expensive?
Because certain line items behave like a ratchet (utilities, insurance structures, service pricing). They rise and do not meaningfully revert, even when the headline rate cools. Electricity is a prime example.
Is this “mission accomplished” for inflation?
No. Cooling is not the same as normalization. Core inflation remains elevated relative to the 2010s, and energy has reasserted itself as a marginal driver. The system can still re-accelerate through energy-to-services pass-through.
What is the most important chart in this package?
The major categories breakdown is the fast read (headline vs core vs energy). The electricity chart is the slow read (why cost pressure persists even when headlines cool). The regional/metro charts explain why experiences diverge and why national averages can mislead.
Sources
- U.S. Bureau of Labor Statistics (BLS), Consumer Price Index Summary — November 2025 (CPI-U, Core, Food, Energy; shutdown note): https://www.bls.gov/news.release/cpi.nr0.htm
- BLS CPI Additional Resources — 2025 Federal Government Shutdown impact on CPI: https://www.bls.gov/cpi/additional-resources/2025-federal-government-shutdown-impact-cpi.htm
Vad är din reaktion?
 Gilla
0
Gilla
0
 Ogilla
0
Ogilla
0
 Kärlek
0
Kärlek
0
 Rolig
0
Rolig
0
 Wow
0
Wow
0
 Ledsen
0
Ledsen
0
 Arg
0
Arg
0

Founder of Pattern Nexus. I research markets, macro, geopolitics, AI, history, ancient systems, and the patterns most people overlook. I’m also building Market Radar, a trading scanner designed to read pressure, risk, confirmation, and setup quality before chasing a move. Pattern Nexus is where I connect the dots between data, history, technology, and the bigger system playing out around us.














Kommentarer (0)