

Where Europe’s Sovereign Stress Reaches Bank Balance Sheets
Government-bond repricing can reach a bank through accounting, collateral cover, and funding costs on different schedules. PN examines the latest sovereign-exposure data and follows one bond through …

Jump to a section
Europe’s sovereign financing risks reach banks through several channels. A bond can lose market value, provide less collateral cover, and become more expensive to finance before the bank sells it. The accounting category determines where valuation changes appear; it does not determine every cash requirement associated with holding the asset.
The latest EBA dashboard reports €4.540 trillion of gross sovereign exposures in June 2026, up from €4.176 trillion in December 2025. Its separate accounting breakdown, based on carrying amounts net of short positions, places 59% at amortized cost, 20% through other comprehensive income, 17% held for trading, 1% in a separate fair-value-through-profit category, and 3% in other assets.[2]
Banks enter this environment with substantial reported buffers. EBA describes robust capital and liquidity, while the ECB’s separate significant-bank statistics show a 16.00% CET1 ratio and a 154.91% liquidity coverage ratio for the second quarter. These are aggregate observations, not a guarantee about each institution’s October funding position.[3][4]
The financing channel deserves attention before a headline loss appears. My working hypothesis is that sovereign repricing could first become consequential through reduced collateral headroom and more expensive liabilities at particular banks. That outcome depends on their holdings, hedges, funding, and usable liquidity. The public aggregates establish exposure and resilience; they do not establish a general European banking crisis.
Identify the bank, issuer, maturity, and coverage of the reported exposure.
Track where valuation and credit changes enter profit or equity.
Measure usable cover at current values after applicable haircuts.
Follow liabilities, cash needs, and the dates financing must be renewed.
01 · SOVEREIGNS AND BANK FUNDING
The fiscal numbers have changed
Eurostat’s October 21 release places euro-area general government gross debt at 88.8% of GDP in the second quarter of 2026, up from 87.3% a year earlier. France stood at 119.1%, Italy at 139.9%, Belgium at 110.2%, and Germany at 63.4%. The release marks the latest quarterly observations as provisional.[1]
Those figures describe government debt relative to economic output. They do not identify which banks own the securities, how long the bonds run, or how the portfolios are financed. They also do not rank the probability of sovereign default. Debt servicing depends on the interest burden, maturity schedule, revenues, growth, and the credibility of future fiscal decisions.
The current policy environment adds pressure to that financing problem. On October 29, the ECB held its deposit rate at 2.50% and said financing conditions had tightened since its previous meeting. It identified the continuing energy shock as an upside inflation risk and a downside growth risk. Its APP and PEPP portfolios continued to decline as maturing principal was no longer reinvested.[8]
That combination can make a financing shock more difficult to absorb: governments face competing claims on budgets while the central bank is managing inflation and transmission. It does not establish that a particular government cannot fund itself or that banks must purchase a fixed share of its issuance.
Yields and spreads also need separate readings. In a hypothetical example, a sovereign yield staying at 4% while a comparable benchmark falls from 3% to 2.8% widens the spread from 100 to 120 basis points. That spread change alone has not raised the sovereign’s own yield. A bank’s valuation analysis needs the actual discount-rate change affecting its holdings.
02 · SOVEREIGNS AND BANK FUNDING
Banks enter with capital and liquidity
EBA’s September 25 release describes EU/EEA banks as operating from a position of strength, with a reported CET1 ratio of 16.1%, sound asset quality, and robust liquidity. That is the appropriate starting point for a transmission analysis. A large exposure does not, by itself, establish inadequate loss-absorbing capacity.[3]
The ECB’s significant-institution data provide a separate reference. For the second quarter, that population reported CET1 of 16.00%, annualized return on equity of 10.73%, and a liquidity coverage ratio of 154.91%. The ECB population is different from EBA’s broader EU/EEA sample, so the ratios should retain their source and scope.[4]
Capital and liquidity address different demands. Capital absorbs losses. Liquidity allows a bank to meet payments and withdrawals. A bank can have a substantial capital ratio while facing a concentrated funding need; it can also have ample cash while a deteriorating asset reduces earnings or equity.
The averages cannot identify that institution. They combine banks with different portfolios, business models, funding structures, and hedging arrangements. The figures also refer to June, rather than a live October 31 balance sheet.
The useful question is how a repricing would interact with those starting positions. That requires tracing the asset and liability sides together, including the collateral that can actually be used when a payment is due.
03 · SOVEREIGNS AND BANK FUNDING
Read the country rows before ranking the risk
EBA’s sovereign table reports direct general-government exposures through non-derivative financial assets. It includes more than tradable government bonds. Reporting coverage is restricted to institutions whose sovereign exposures meet the stated threshold of at least 1% of total debt securities and loans receivable.[2]
The country aggregates also overlap. A subsidiary can enter its host-country data while remaining inside its parent’s consolidated home-country data. EBA’s EU/EEA aggregate uses the consolidated reporting entity. Adding the national rows would therefore double-count some exposures; this article uses the published EU/EEA total.[2]
The gross aggregate rose by €364 billion between December and June, approximately 8.7% using the rounded table totals. That is a change in the reported carrying amount, rather than a clean measure of net bond purchases. Valuations, reporting coverage, and other balance-sheet changes can affect the comparison.
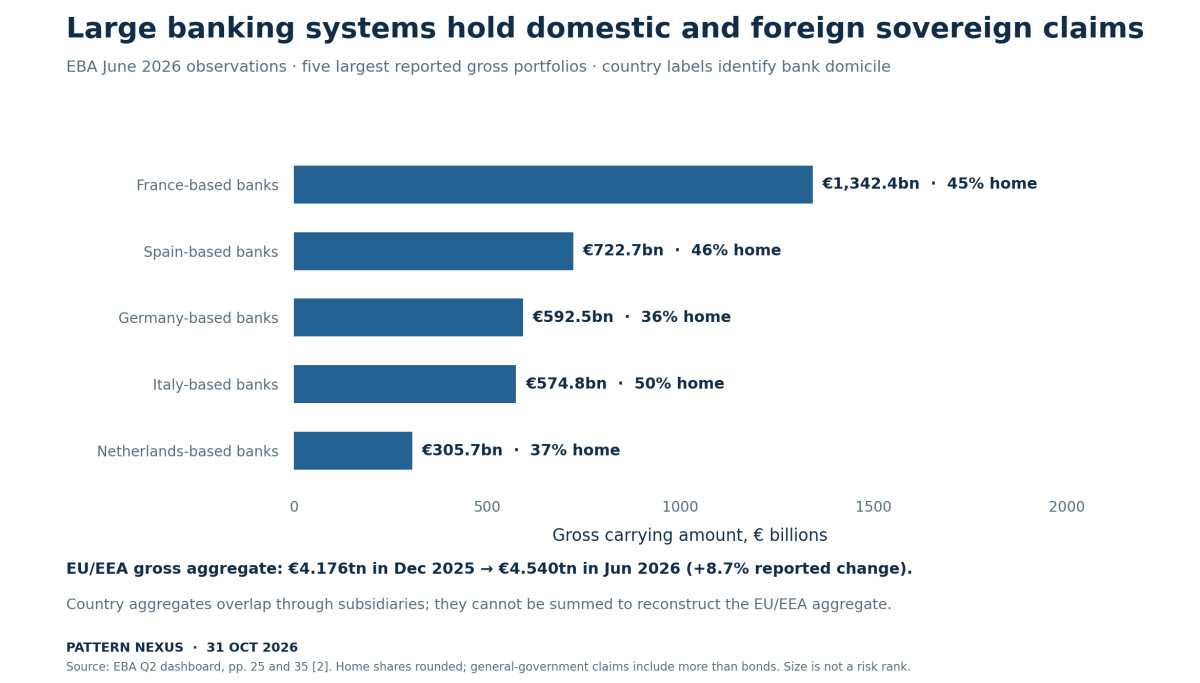
The country rows identify banking systems. The French row reports €1.3424 trillion of gross sovereign exposures held by banks in that reporting group. It does not mean those banks hold €1.3424 trillion of French government debt. The table separately reports a 45% home-country share for the French row and a 22% share toward other EU/EEA countries.[2]
A bank’s nationality does not identify every sovereign issuer in its portfolio. Cross-border holdings can transmit a shock beyond the issuer’s domestic banking system, while diversification can reduce dependence on a single government.
The selected large banking systems also differ in their home-country shares: 46% for Spain, 36% for Germany, 50% for Italy, and 37% for the Netherlands. These are rounded portfolio shares, rather than measures of loss severity, capital adequacy, or immediate funding pressure.[2]
An absolute exposure ranking partly reflects the size of the banking system. A smaller portfolio can be more consequential to a bank with less capital, longer duration, less hedging, or weaker funding access. The table is a starting map of reported claims; it cannot supply a vulnerability ranking on its own.
04 · SOVEREIGNS AND BANK FUNDING
The portfolio has more than one valuation route
The same EBA table contains a separate carrying-amount measure net of short positions: €4.327 trillion in June, compared with €3.972 trillion in December. Its accounting percentages belong to that measure. Applying them to the €4.540 trillion gross total would mix denominators.[2]
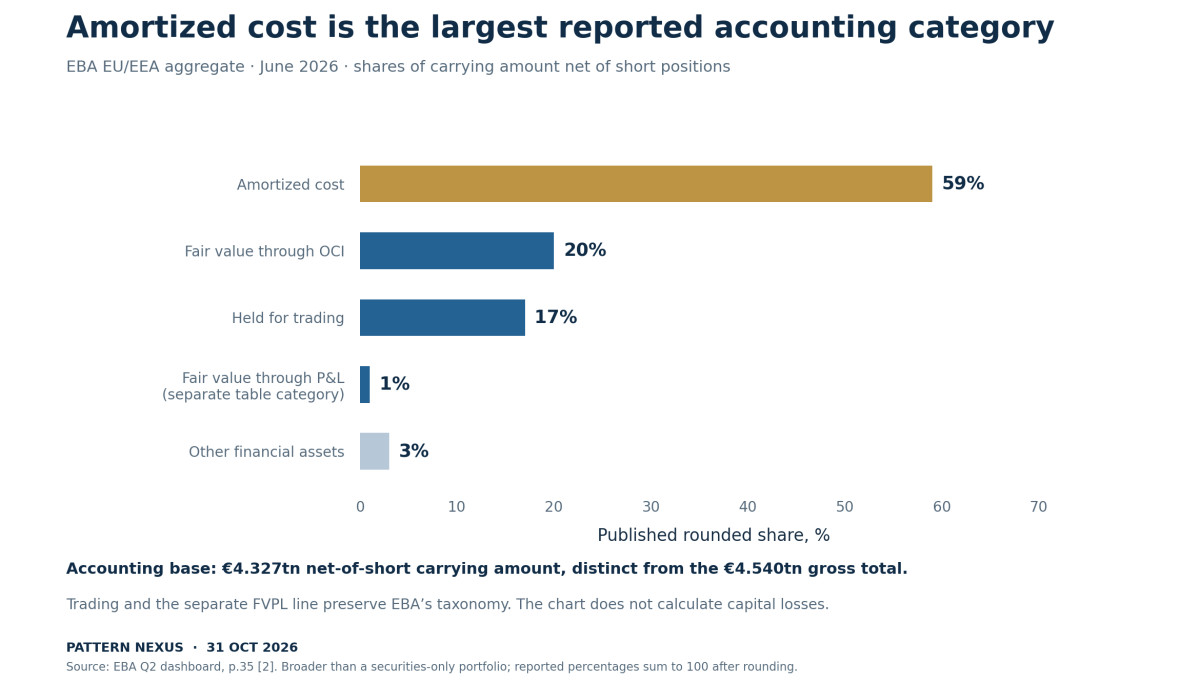
Amortized cost accounts for the largest reported share, 59%. Fair value through other comprehensive income, or FVOCI, accounts for 20%. The table separately identifies assets held for trading at 17%, another fair-value-through-profit-and-loss category at 1%, and other assets at 3%. The published percentages are rounded.[2]
The separate trading and fair-value-through-profit categories follow the dashboard’s reporting taxonomy. They should not be read as a claim that trading assets escape fair-value accounting. The chart preserves the published categories so readers can follow the table without silently changing its definitions.
IFRS 9 classification depends on how financial assets are managed and the nature of their contractual cash flows. Amortized-cost treatment generally applies to qualifying assets managed to collect contractual payments. Qualifying FVOCI debt assets are managed through both collection and sales. Other relevant assets are measured through profit or loss, subject to the standard’s requirements.[5]
Those categories determine how a price movement is reported. They do not make an asset’s current market value irrelevant to a sale, a collateral transaction, or a lender assessing the bank. Reclassification also follows a change in the business model under IFRS 9; a falling bond price is not itself a discretionary opportunity to move the loss into a different category.[5]
05 · SOVEREIGNS AND BANK FUNDING
Follow one bond through a yield move
Consider a hypothetical ten-year bond with €100 million of principal and a fixed annual coupon of 3%. At a 3% annual yield, its price is €100 million. Assume an immediate yield change, with all ten years still remaining, no default, and unchanged contractual payments.
At a 4% yield, the present value falls to approximately €91.889 million. At 5%, it falls to €84.557 million. Those are exact discounted-cash-flow calculations under the stated annual-payment assumptions, rounded for presentation. They are not estimates of the duration or losses in the European banking system.
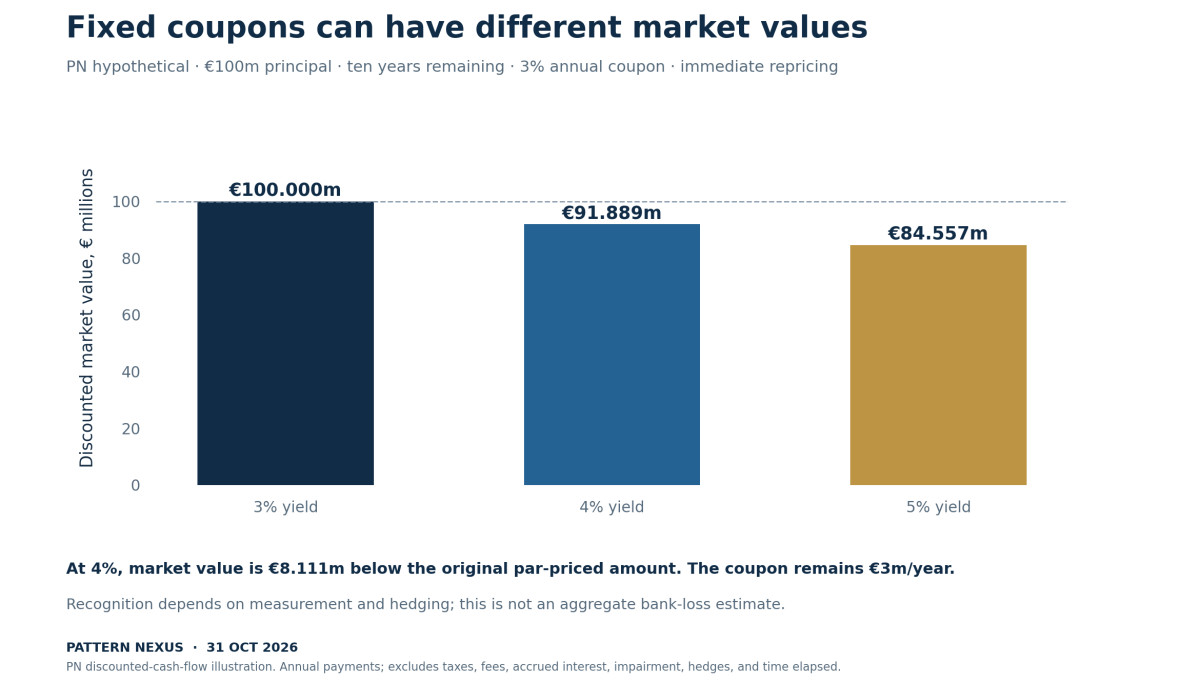
The coupon remains €3 million a year. A higher market yield changes the price a new buyer would pay for those fixed payments. It does not rewrite the existing coupon contract. The bank’s financing costs, however, can change independently.
At the 4% yield, the €8.111 million market-value decline is economically relevant across the accounting categories. Its recognition differs. For an unhedged qualifying amortized-cost asset, a pure discount-rate movement does not produce the same immediate fair-value charge as it would for an asset measured through profit or loss. Credit impairment and other applicable adjustments remain separate questions.
The example assumes no hedging, taxes, impairment, transaction costs, or accrued interest. A real bank can use derivatives or offsetting liabilities, and its bonds have different coupons, maturities, currencies, and issuers. Multiplying this example’s price decline by EBA’s entire sovereign-exposure total would ignore those differences and include claims that are not equivalent bonds.
The calculation establishes the common valuation change. The next steps determine where it appears and whether the bank needs cash because of it.
06 · SOVEREIGNS AND BANK FUNDING
Profit, equity, and regulatory capital do not move identically
For the hypothetical bond’s move from €100 million to €91.889 million, the simplified reporting routes are:
| Measurement category | Treatment of the isolated market-price change | Separate issue to examine |
|---|---|---|
| Fair value through profit or loss | The €8.111 million decline generally enters profit or loss | Hedges, tax, and other applicable accounting effects |
| Qualifying debt at FVOCI | The fair-value movement generally enters other comprehensive income | Impairment and certain other items affect profit or loss; prudential treatment must be assessed |
| Qualifying debt at amortized cost | No matching immediate fair-value remeasurement from this rate move alone | Credit-loss allowances, hedging adjustments, and a possible sale |
The EBA’s explanation of FVOCI debt confirms that ordinary fair-value changes are recorded in OCI while impairment gains and losses are recognized in profit or loss. Calling an OCI movement invisible because it is outside current profit would miss its place in comprehensive income and accounting equity.[6]
Regulatory capital requires an additional calculation. Recognized earnings, accumulated OCI, applicable adjustments and filters, tax effects, hedges, and risk-weighted assets all matter. An accounting category alone is insufficient to calculate the change in a bank’s CET1 ratio.
A price decline also differs from a default loss. A fixed-rate bond can trade below its carrying amount because discount rates have risen while all contractual payments remain expected. A deterioration in the issuer’s ability to pay introduces credit risk and can affect expected-credit-loss allowances. Amortized cost is not an exemption from credit impairment.[5][6]
The analysis should keep the economic valuation, accounting entry, and prudential result connected without substituting one for another. Each gives information the others do not fully capture.
07 · SOVEREIGNS AND BANK FUNDING
Amortized cost still has a liquidity exposure
A bank that can hold the modeled bond and receive its payments faces a different cash position from a bank that must sell it today. Holding avoids realizing that particular market discount through an immediate sale. It does not make the asset worth €100 million to a buyer at the assumed 4% yield.
If the bank sells the entire unhedged bond at €91.889 million against a €100 million carrying amount, the simplified disposal creates an €8.111 million loss. The example omits impairment already recognized, hedges, tax, fees, and other adjustments that would affect an actual accounting result.
Selling is only one way to obtain liquidity. A bank may use unencumbered cash, raise deposits, issue liabilities, borrow against eligible assets, or adjust other positions. Whether those routes are available determines how likely a market-value gap is to become a realized sale loss.
Classification and liquidity planning therefore need to be read together. A portfolio intended for collecting contractual payments can still encounter a demand for cash elsewhere in the bank. The existence of a funding need does not prove that the bank must sell this portfolio, but the available alternatives require evidence.
The strongest signal would be a shortening list of usable alternatives alongside a growing need to meet payments. An unrealized discount alone does not establish that sequence. Neither does an aggregate liquidity ratio reveal every restriction on moving collateral or cash between entities and accounts.
08 · SOVEREIGNS AND BANK FUNDING
Collateral receives a second valuation
The Eurosystem’s collateral framework provides a direct example of a valuation that serves a different purpose from the bank’s accounting measurement. Its risk-control page describes haircut-adjusted market values and the requirement to provide additional assets or cash when the collateral supporting a credit operation falls below the required level.[7]
Assume the hypothetical €100 million bond initially has a 2% collateral haircut. Its cover value is €98 million. After the yield rises to 4%, the market price is €91.889 million. Keeping the haircut unchanged at 2% reduces cover to about €90.051 million.
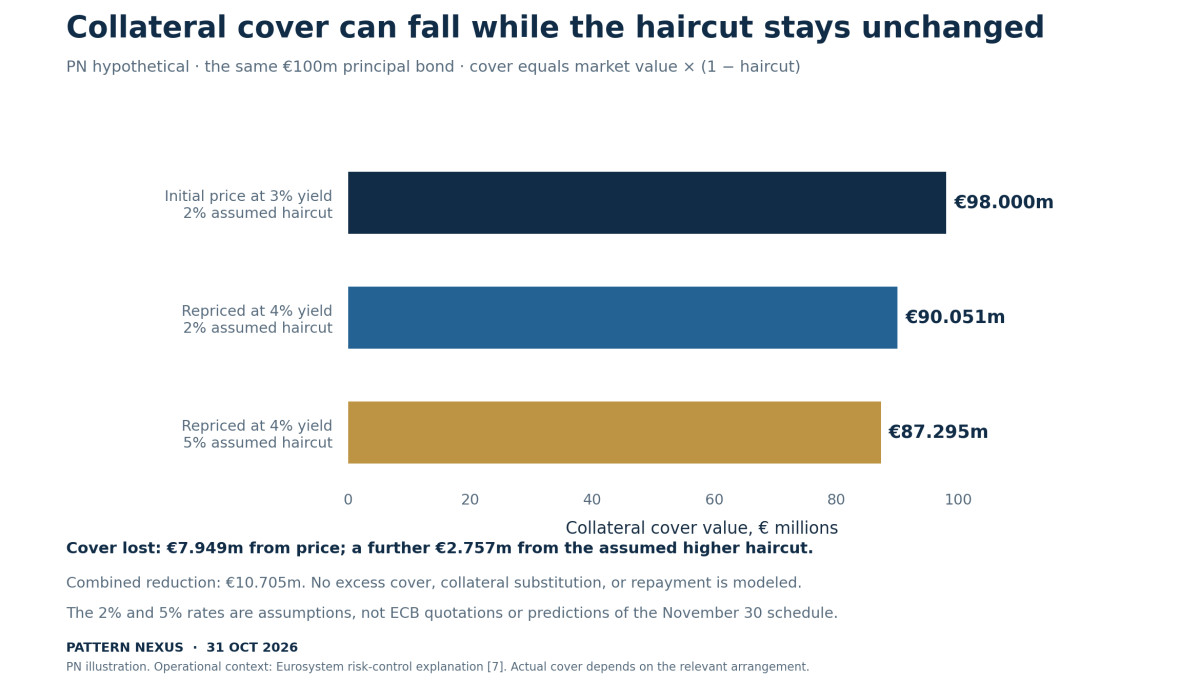
The cover reduction is approximately €7.949 million despite an unchanged haircut. If, in a separate assumed stress case, the haircut rises to 5%, cover falls further to €87.295 million. The additional haircut effect is about €2.757 million, bringing the total reduction from the starting cover to €10.705 million.
These are illustrative haircuts, not ECB quotations for a named sovereign or predictions of a policy change. The example isolates two effects: a lower market price and a different percentage applied to that price. The accounting carrying amount does not replace either input.
If an unchanged €98 million obligation were supported only by this collateral, the reduced cover would have to be resolved under the relevant arrangement. A bank might supply other eligible assets or cash, reduce the borrowing, or use excess cover already available in its pool. The example assumes no such excess when illustrating the gap.
A private repo transaction has its own terms and risk controls. ECB eligibility, a private counterparty’s acceptance, and the quantity of unencumbered collateral are different parts of the funding analysis. Treating all government securities as equally usable at their accounting amounts would conceal those constraints.
09 · SOVEREIGNS AND BANK FUNDING
Funding can reprice before the asset is sold
A bank can retain every bond and still face a change in earnings because its liabilities become more expensive. Depositors may demand higher rates. Wholesale debt may mature into a less favorable market. Secured funding may require more collateral or different terms.
For a simple scale illustration, an additional one percentage point of annual funding cost on €1 billion of liabilities adds €10 million a year, if the whole amount reprices for the full year and nothing offsets it. That is an assumption about financing, rather than a realized bond-sale loss or a bank forecast.
The asset side can reprice too. Floating-rate loans and new business may generate higher income, while derivatives and other positions can offset parts of the movement. A bank with well-matched exposures can experience a very different earnings result from one holding long fixed-rate assets against rapidly repricing liabilities.
The sovereign channel can also reach the price investors demand for bank debt. The ECB’s May speech describes the link between perceptions of sovereign strength and the pricing of bank liabilities, including expectations of public support during stress. The resolution framework affects that relationship.[10]
The ordering is consequential. Funding spreads and deposit costs can change before a bank realizes a loss on its securities. An assessment confined to the bond portfolio’s current profit-and-loss entry could therefore miss an earlier reduction in earnings capacity.
10 · SOVEREIGNS AND BANK FUNDING
The fiscal backstop can weaken alongside borrowers
Sovereigns and banks are connected beyond direct debt holdings. Government guarantees can support loans to businesses. Fiscal support can protect household income and corporate revenues. A government with less room to respond to a downturn may provide a different cushion to the bank’s borrowers.[10]
An energy shock illustrates the possible interaction. More expensive energy can weaken some businesses while raising demands for government support. If the fiscal response becomes harder to finance, the protection available to borrowers may be more limited. Banks could then face both sovereign-market pressure and deterioration in parts of the private loan book.
That is a conditional pathway. It does not establish that every guarantee becomes worthless when public debt rises, or that support will necessarily be withdrawn. The terms, legal commitments, beneficiaries, and fiscal capacity have to be examined directly.
The historical record also contains institutional improvements. Claudia Buch’s May 19 speech said the bank-sovereign nexus had weakened and was not then a prudential concern. She identified stronger bank balance sheets, supervision, and resolution arrangements as reasons for the progress.[10]
That dated assessment should remain part of the evidence. The current article examines how the channels could transmit renewed pressure; it does not assume the post-crisis reforms have disappeared. A claim that governments will automatically absorb all bank losses would be inconsistent with the role of resolution and private loss absorption.
11 · SOVEREIGNS AND BANK FUNDING
Diversification changes the transmission map
EBA’s June table puts the home-country share of gross sovereign exposures at 43%, compared with 45% in December. Exposure to other EU/EEA countries rises from 31% to 33%. Those rounded aggregate shares indicate a meaningful cross-border component.[2]
Diversification can reduce concentration in one issuer. It can also make a domestic-only story incomplete. A shock to one government may affect banks headquartered elsewhere, depending on the actual issuer holdings. The country-of-bank rows do not disclose that whole issuer-by-holder matrix.
Diversifying sovereign issuers still leaves exposure to a common increase in interest rates. Several national bond markets can reprice together. A portfolio spread across issuers may still have substantial duration if its payments lie far in the future.
The reverse can occur as well. A country-specific shock may widen one spread while benchmark securities gain value. The outcome for a diversified bank then depends on position sizes, maturity, hedges, and the correlations that actually develop.
The appropriate map has at least four dimensions: bank, issuer, maturity, and accounting or hedging treatment. Funding adds a fifth. The public table provides part of that map, with enough information to reject simplistic national rankings but insufficient detail to calculate every bank’s response.
12 · SOVEREIGNS AND BANK FUNDING
ECB policy has more than one transmission problem to manage
The October 29 decision retained the ECB’s inflation objective while acknowledging tighter financing conditions and the continuing energy shock. The statement also confirmed that the Transmission Protection Instrument remained available for unwarranted, disorderly market dynamics threatening monetary-policy transmission.[8]
That availability is relevant to a fragmentation scenario. It is not a promise to preserve every sovereign bond price or eliminate the consequences of fiscal fundamentals. The TPI’s published framework provides for a Governing Council assessment of market conditions, eligibility, and proportionality before activation.[11]
The instrument’s original description also distinguishes financing deterioration unwarranted by country fundamentals from persistent tensions attributed to fundamentals. A forecast that treats all spread widening as automatically eligible for purchases would omit that assessment.[11]
For bank analysis, the policy framework is a potential stabilizer. It can affect expectations about disorderly market dynamics. It does not replace the bank’s need to meet collateral obligations, manage interest-rate exposure, or maintain credible funding arrangements.
The decline in APP and PEPP holdings is a separate process. It changes the background allocation of securities across investors as maturities are not reinvested. The EBA exposure increase is consistent with banks retaining a substantial role in sovereign financing, but it does not identify how much of their change was caused by central-bank portfolio runoff.
13 · SOVEREIGNS AND BANK FUNDING
The next collateral change has a future effective date
The ECB published implementation-guideline amendments on September 29, with application scheduled for November 30, 2026. At this article’s October 31 cutoff, that application date is still future.[9]
The package includes an updated haircut schedule and changes to the use of external ratings for specified assets. Its announcement says the second-best rating treatment concerns private-sector assets and the non-euro-area public sector, while the first-best rating continues for euro-area public-sector assets.[9]
That scope prevents a misleading shortcut. The announcement should not be summarized as every euro-area sovereign suddenly moving to a second-best rating rule. Nor should a future schedule be treated as already determining October collateral calls.
A rating action, market-price decline, haircut change, and loss of eligibility are distinct events. One can occur without all the others occurring simultaneously. A rating change must be evaluated against the applicable framework, maturity, asset classification, and any relevant provisions.
The forthcoming date belongs on a funding calendar because banks need to understand which assets and procedures are affected. It does not establish an impending collateral cliff. The article’s 2% and 5% examples remain hypothetical and do not model the amended schedule.
14 · SOVEREIGNS AND BANK FUNDING
Three sequences would produce different evidence
| Conditional sequence | What reaches the bank first | Evidence needed to assess escalation |
|---|---|---|
| Orderly repricing with adequate funding | Market-value changes and normal collateral adjustments | Manageable calls, stable funding access, credible hedges and buffers |
| Funding pressure on a portfolio largely held at amortized cost | Lower usable cover or more expensive liabilities before a sale | Declining unencumbered collateral, concentrated refinancing needs, forced disposals or emergency funding |
| Fiscal and private-credit deterioration together | Sovereign repricing alongside weaker borrowers or less effective guarantees | Issuer exposures, credit-loss allowances, guarantee terms, funding changes, and capital effects |
These sequences describe mechanisms to test, not assigned probabilities. The first can involve substantial bond-price movement without a banking crisis. The second puts liquidity management at the center. The third adds credit deterioration that a pure interest-rate example does not capture.
Evidence of large holdings is insufficient to choose among them. A capital ratio, a bond spread, or an unrealized market discount also cannot make that choice alone. The combination and ordering of observations matter.
Payment evidence determines the assessment. Timely collateral substitution and ordinary refinancing show a different outcome from missed payments, forced asset sales, or a loss of market access. Those stronger claims require bank-specific evidence.
15 · SOVEREIGNS AND BANK FUNDING
The balance-sheet dashboard
I would update this thesis using six connected sets of observations:
- Issuer and maturity: Which governments the bank is exposed to, how much, and when the cash flows arrive; separate changes in benchmark rates from issuer spreads.
- Measurement and hedging: Amortized cost, FVOCI, trading and other fair-value categories, credit allowances, and the actual offsets from derivatives or liabilities.
- Usable collateral: Current market value after relevant haircuts, eligibility, existing encumbrance, excess cover, and operational access.
- Funding calendar: Deposit behavior, wholesale maturities, secured-financing terms, currency needs, and refinancing costs.
- Capital and earnings: Recognized losses, OCI, prudential adjustments, risk-weighted assets, and the income available to absorb pressure.
- Observable strain: Forced sales, emergency funding disclosures, missed obligations, disrupted trading, or lending constraints linked to the bank’s financing position.
The dashboard should preserve the source population and observation date. EBA’s EU/EEA aggregate, the ECB’s significant-bank aggregate, a national banking system, and an individual bank are different units of analysis.
It should also preserve the difference between a buffer and a flow. Reported capital is not spendable cash. Gross sovereign exposure is not a margin call. A bond’s principal amount is not its borrowing capacity. Converting one into another without the intervening calculation creates a false picture of stress.
PATTERN NEXUS VIEW
The Pattern Nexus view
The connection to PN’s Liquidity Framework & Market Plumbing is the asset’s ability to carry a financing obligation through time. Government debt can serve as an investment, a liquidity-buffer component, and collateral. Those uses depend on different measurements and constraints.[12]
The less visible risk is a bank retaining its contractual asset payments while losing some flexibility to fund the interval before those payments arrive. An amortized-cost carrying value can remain comparatively stable while market-based collateral cover falls. Funding costs can then increase before the bank sells the asset.
The reverse is also possible. Strong buffers, usable collateral, stable deposits, and effective hedges can absorb the repricing. The latest public capital and liquidity observations give reasons to take that resilience seriously.[3][4]
I would therefore look for the funding channel becoming restrictive before declaring a renewed sovereign-bank crisis. The exposure data establish where to begin. The payment, collateral, and refinancing evidence determine whether a valuation movement is becoming a constraint on the bank’s behavior.
READER QUESTIONS
Frequently asked questions
Does a rise in sovereign yields immediately reduce every bank’s profit?
The recognition depends on measurement category, hedging, impairment, and other applicable accounting effects. Fair-value-through-profit assets generally transmit price changes into earnings. Qualifying FVOCI debt records ordinary fair-value changes in OCI. Qualifying amortized-cost assets do not receive the same immediate fair-value remeasurement from an isolated rate move. Their credit and liquidity risks still require assessment.[5][6]
Does the French row mean €1.3424 trillion of French government debt?
It identifies gross sovereign exposures held by the French banking-system reporting group, rather than a single issuer. The table separately gives its home-country share as 45% in June. The holdings include other sovereigns. The row also covers general-government claims through non-derivative assets, which are broader than tradable government bonds.[2]
Are sovereign exposures assigned zero risk because they cannot lose value?
The ECB’s May speech describes a generally zero risk weight for specified Member State central-government and central-bank exposures denominated and funded in domestic currency. That regulatory treatment has conditions. It does not prevent market-price changes or eliminate interest-rate, concentration, credit, and funding risks. Supervision also addresses concentrations.[10]
Can an amortized-cost bond generate a collateral call?
A collateral arrangement can use a market-based valuation independently of accounting treatment. The Eurosystem describes haircut-adjusted market values and additional cover requirements when those values fall below the required level. The result depends on the assets pledged, existing excess cover, borrowing, and applicable terms. Accounting carrying value alone does not determine the call.[7]
Are the article’s haircuts actual ECB sovereign haircut rates?
The 2% and 5% rates are assumptions chosen to separate a market-price effect from a haircut effect. They are not quotations for a named security or forecasts of policy. Actual treatment requires the applicable asset, maturity, credit assessment, eligibility provisions, and effective schedule. The September amendments apply from November 30, after this article’s cutoff.[9]
Do the latest figures show that European banks are already in crisis?
The cited EBA release describes robust buffers, and the ECB’s significant-bank cohort reports substantial aggregate capital and liquidity. The article identifies conditional transmission channels and does not establish a general loss of funding access. A crisis claim would require current evidence of impaired payments, financing, solvency, or market functioning beyond the aggregate holdings data.[3][4]
What would weaken the financing-risk thesis?
Stable funding, ample usable collateral, manageable calls, effective hedges, and adequate earnings and capital would weaken the escalation case. So would evidence that institutions could meet liquidity needs without distressed sales. Sovereign repricing can remain orderly when banks can absorb it. The proposed channel is a mechanism to monitor, rather than a predetermined crisis sequence.
METHOD AND EVIDENCE
Method and evidence
Research cutoff: October 31, 2026. EBA’s second-quarter dashboard was published September 25 and compares December 2025 with June 2026. Page 35 supplies the sovereign table and coverage notes. Eurostat’s October 21 release supplies provisional second-quarter fiscal data. ECB significant-bank statistics are a separate June population. The October 29 policy statement and September 29 collateral announcement provide the current policy context.
Figures 1 and 2 use the EBA table. Country aggregates overlap through subsidiaries and are not summed; page 25 supplies the consolidation notes. Gross carrying amounts, net-of-short carrying amounts, banking-system domicile, issuer location, and rounded accounting shares remain distinct. Figures 3 and 4 are PN illustrations using an immediately repriced ten-year, 3% annual-coupon bond and assumed collateral haircuts. They exclude accrued interest, taxes, fees, impairment, hedging, excess collateral, and actual bank portfolios.
The bond value is the discounted sum of ten annual €3 million coupons and €100 million principal. Cover value is market value multiplied by one minus the assumed haircut. Neither calculation estimates aggregate European bank losses or a live margin call. The transmission scenarios require bank-specific evidence before being treated as observed outcomes.
SOURCES
Research and Data Sources
Official fiscal and supervisory releases establish the reported exposures and starting buffers. Accounting and collateral sources establish separate measurement routes. PN valuation and funding examples are labeled; conditional scenarios are not reported crises.
- Eurostat. Government debt at 88.8% of GDP in euro area — second quarter 2026. Released October 21, 2026; provisional Q2 observations. General-government gross debt/GDP and country fiscal context. These are not bank exposure ratios or default rankings.
- European Banking Authority. Risk Dashboard — Q2 2026. Published September 25, 2026; December 2025 and June 2026 observations. Page 35: non-derivative general-government exposures, gross/net-of-short amounts and accounting shares. Page 25: country aggregates overlap through subsidiaries and cannot be summed to recreate the consolidated EU/EEA aggregate. Coverage threshold and rounded shares retained.
- European Banking Authority. EU/EEA banks display strength amid a challenging risk environment. September 25, 2026; second-quarter data. EU/EEA baseline: robust buffers and CET1 of 16.1%. Different sample from the ECB significant-institution statistics.
- ECB Banking Supervision. Supervisory banking statistics on significant institutions — second quarter 2026. September 15, 2026; Q2 observations. Significant-institution aggregate CET1 16.00%, annualized ROE 10.73%, LCR 154.91%. June aggregate, not a live bank-by-bank funding assessment.
- IFRS Foundation. IFRS9 Financial Instruments — public overview. Current public overview, accessed October 31, 2026. Classification by business model and contractual cash-flow characteristics; expected-credit-loss framework and reclassification principles. Gated standard text was not used.
- European Banking Authority. 2017_3146 — FINREP treatment of ECLs on FVOCI assets. Published final Q&A, accessed October 31, 2026. Explains ordinary fair-value changes in OCI and impairment in profit/loss for qualifying FVOCI debt; not a complete bank capital calculation.
- European Central Bank. Risk control — Eurosystem collateral framework. Current framework explanation, accessed October 31, 2026. Haircut-adjusted market values and the provision of additional assets or cash when required cover falls. The article’s haircuts are assumed, not ECB quotations.
- European Central Bank. Monetary policy decisions. October 29, 2026. Deposit rate 2.50%, tightened financing conditions, APP/PEPP runoff and continued TPI availability.
- European Central Bank. ECB amends monetary policy implementation guidelines as part of regular review. Announced September 29; applicable November 30, 2026. Future application date; haircut updates and distinction between second-best treatment for specified assets and continuing first-best rating treatment for euro-area public-sector assets.
- Claudia Buch / ECB Banking Supervision. The bank-sovereign nexus: securing progress by completing the banking union. May 19, 2026 speech. Bank-sovereign channels through assets, liabilities, guarantees, fiscal support and resolution; dated assessment that the nexus had weakened and was not then a prudential concern. Its narrower exposure statistics are not substituted for EBA totals.
- European Central Bank. The Transmission Protection Instrument. July 21, 2022 framework; availability cross-checked October 29, 2026. Eligibility and Governing Council assessment of unwarranted disorderly dynamics; not a standing guarantee of sovereign prices or automatic activation.
- Pattern Nexus. Liquidity Framework & Market Plumbing. Public research hub, accessed October 31, 2026. Related PN balance-sheet, funding and collateral framework. Interpretation, rather than independent proof of a current banking crisis.
Public research on sovereign financing, bank portfolios, and the funding conditions connecting them. This article is available free, without a premium or registration gate.
Article overview
Government-bond repricing can reach a bank through accounting, collateral cover, and funding costs on different schedules. PN examines the latest sovereign-exposure data and follows one bond through those channels to identify where pressure could become a constraint.
What's Your Reaction?
 Like
0
 Dislike
0
 Love
0
 Funny
0
 Wow
0
 Sad
0
 Angry
0

Nexus (Christopher)
Founder of Pattern Nexus. I research markets, macro, geopolitics, AI, history, ancient systems, and the patterns most people overlook. I’m also building Market Radar, a trading scanner designed to read pressure, risk, confirmation, and setup quality before ch…
Related research

The Capital Ladder: Where $100 to $1 Trillion Places You in the Global and American Wealth System
A deep Pattern Nexus regression and data analysis mapping where net worth levels from $100 to $1 trillion place an individual within the gl…
5 shared topics.
Selling U.S. Assets” Won’t Collapse the Dollar — It Collapses Europe’s Dollar Plumbing
Viral claims say Europe could dump U.S. assets to trigger a dollar collapse. In the eurodollar system, that move is closer to setting your …
5 shared topics, same research avenue.
Ukraine Is the Fault Line: NATO Expansion, Dollar Custody Warfare, and Russia’s Forced Pivot to China
Ukraine is not a regional war. It is the convergence point where NATO’s post-1991 security architecture, the U.S.-led financial control sta…
4 shared topics, same research avenue.
The Treasury Market Is Changing Its Gatekeepers
Treasury clearing deadlines are approaching. PN examines who gains from netting and cross-margining, how access and funding terms shape the…
4 shared topics.
The QE Decade — Audio-Video Edition
Episode 8 of the weekly Pattern Nexus audio-video series turns Part 8 of Cycles of Power into a shorter story about how quantitative easing…
4 shared topics.
The New Fed Chair Does Not Inherit an Economy. He Inherits the Permission Stack.
Kevin Warsh is not simply inheriting the Federal Reserve. He is inheriting the control layer where inflation, debt service, Treasury fundin…
4 shared topics.
The Headline Is Late: How Pattern Nexus Mapped the Chokepoint War Before Hormuz Became Visible
The Iran-Hormuz crisis did not create the Pattern Nexus framework. It exposed it. For months, Pattern Nexus had already been mapping the de…
4 shared topics.
Comments (0)
Security Check
Please complete the captcha to verify you are human.