

A Winter Energy Shock Could Become a Margin Call
A winter price shock can demand cash before a hedge’s physical offset pays out. PN examines October gas inventories, clearing terms, and a worked producer example to trace how variation margin, colla…
Jump to a section
A winter energy shock can reach company treasuries before it reaches the next customer bill. A producer that sells futures against expected output can preserve its eventual selling price while making substantial cash payments as prices rise. The higher physical-sale proceeds may arrive weeks later. The hedge can perform as intended across the full transaction and still require financing along the way.
The physical backdrop warrants attention. ACER’s October 27 report places EU gas storage at 75% of capacity on October 21. ENTSOG’s winter assessment identifies continued LNG deliveries as important to meeting demand and preserving storage. These are dated observations and conditional supply assessments, rather than a forecast of an unavoidable shortage.[1][2]
The financial channel is already operating in ordinary market conditions. The European Supervisory Authorities’ autumn 2026 update says commodity-price swings increased margin calls and clearing volumes while markets remained orderly. Higher calls alone do not establish a liquidity crisis.[8]
My winter watch is the gap between a payment becoming due and usable funding arriving. A cold spell, supply disruption, or abrupt repricing could widen that gap through variation margin, additional initial margin, and physical working capital. The question is which firms can bridge it without cutting hedges, selling assets, or passing the pressure into their suppliers and banks.
Fuel stocks, supply routes, and demand determine the starting conditions.
The position’s direction determines who pays as prices move.
Variation payments and incremental initial margin have different purposes.
Cash must reach the relevant account in the required form and time.
01 · ENERGY AND COLLATERAL
The winter balance already has weak points
Europe approaches the heating season with a smaller storage cushion than in recent winters. ACER reports that storage ended winter 2025–26 at 28% of capacity and reached 75% by October 21. Its assessment also notes that gas demand remains around 20% below the level before the 2022 crisis. A lower filling percentage therefore needs to be read alongside the demand being served.[1]
LNG availability is another part of the balance. ENTSOG’s October 8 outlook finds that European infrastructure remains flexible, but sustained LNG deliveries matter for meeting winter demand and limiting withdrawals. Its scenarios show that constrained LNG availability could leave end-winter storage well below 30%. That is a conditional model result, rather than the expected outcome of every winter path.[2]
A terminal’s ability to receive gas does not guarantee that a cargo is available at an acceptable price. Shipping, competing buyers, upstream supply, pipeline access, and the timing of delivery all affect how much of the infrastructure can be used. A country can have spare import capacity while competing aggressively for the next cargo.
The October reports describe a system with buffers and constraints. They do not require a severe cold forecast to be financially relevant. An abrupt change in the expected balance can move forward prices before a physical deficit develops. Hedged positions then revalue against that new price path.
The financial exposure depends on how the firm has structured its contracts. A utility buying fuel for future sales, a producer selling expected output, and a trader moving cargoes across regions can face the same weather headline and very different cash requirements.
02 · ENERGY AND COLLATERAL
America’s national inventory number has regional limits
The latest U.S. weekly storage report available at this article’s October 31 cutoff covers October 23 and was released October 29. Lower 48 working gas was 3,724 billion cubic feet, 38 Bcf above the five-year average and 147 Bcf below the year-earlier level. EIA places the total within its five-year historical range.[3]
That is a useful counterweight to an indiscriminate shortage narrative. It also leaves considerable regional variation. South Central stocks were 1,168 Bcf against a five-year average of 1,196 Bcf. The other four principal regions were above their respective averages. The national total combines those positions; it does not make them interchangeable.[3]
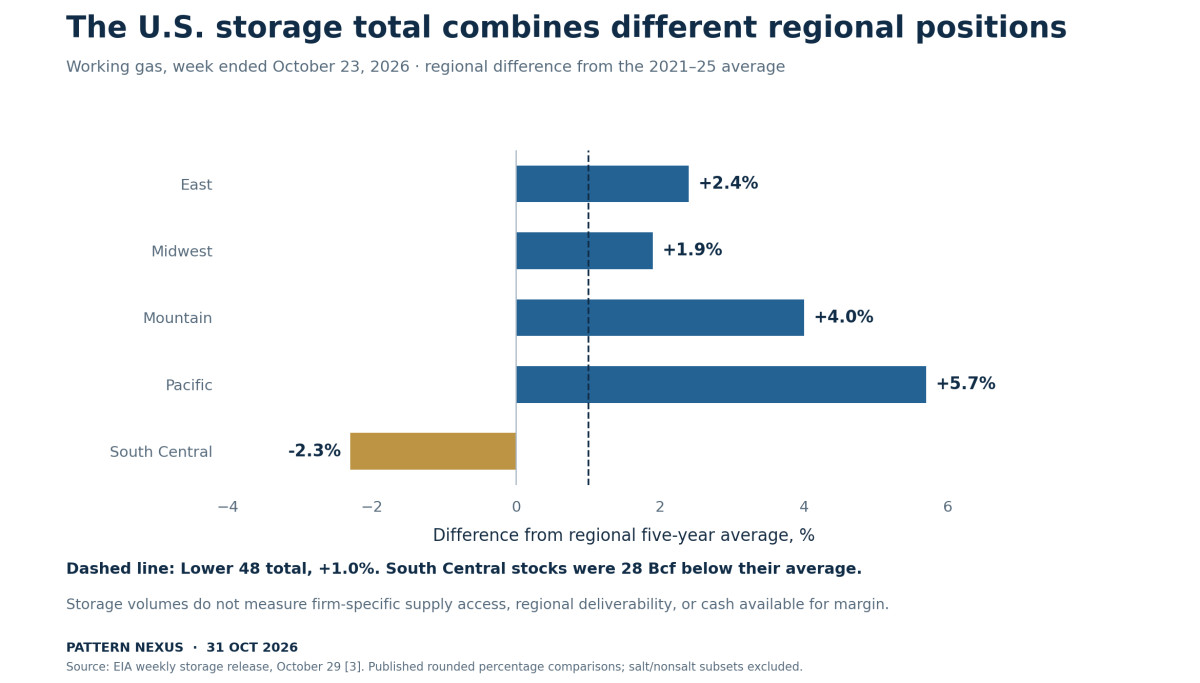
Gas has to reach the location where demand rises. Storage withdrawal capacity, pipeline capacity, production performance, and contractual access can constrain delivery even when the aggregate inventory looks adequate. ENTSOG’s European analysis similarly distinguishes regional access and infrastructure constraints from an overall supply total.[2]
The connection across the Atlantic is LNG. ACER reports that U.S. LNG represented roughly 30% of EU gas supply imports in its summer assessment. European demand for cargoes and American domestic demand therefore belong in the same winter watch, while operating through different prices, transport constraints, and contracts.[1]
The chart does not measure export availability or predict a regional price spike. It shows why a national inventory number is an incomplete stress test. A firm’s hedge may reference one benchmark while its actual fuel or output is priced at another location. That mismatch becomes more consequential when transport or delivery is constrained.
03 · ENERGY AND COLLATERAL
The hedge has a payment calendar
A producer expects to sell energy in the future. Selling a matching futures position can offset the effect of a falling market price on that future sale. If prices rise instead, the futures position loses value while the expected physical sale becomes more valuable. Under an ideal match, the two price effects offset across the transaction.
Their cash dates can differ. Cleared futures are marked to market, and losses can require cash payments before the physical sale is completed. ICE Clear Europe describes daily variation-margin settlement in the contract currency and intraday monitoring that can generate additional calls.[4]
The producer cannot pay today’s call merely by pointing to a more valuable future delivery. It needs cash, a usable financing arrangement, or another permitted means of meeting the relevant obligation. A favorable economic offset is useful to a lender assessing the business, but the offset itself does not transfer money into the margin account.
This is the timing issue that can become visible before deterioration in annual earnings. A balance sheet may contain valuable assets and future receivables while a particular account faces a payment deadline. The financial question is how the firm bridges those dates and what happens if the required bridge grows quickly.
The mechanism works in the opposite direction when prices fall. A producer’s short futures position can receive cash while the expected physical sale becomes less valuable. The sign of the price move and the direction of the position must be identified before describing who faces a call.
04 · ENERGY AND COLLATERAL
Follow one producer through a price jump
Take a hypothetical producer expecting to sell one million megawatt-hours, equivalent to one terawatt-hour, on day 30. It sells a perfectly matching generic futures hedge at €50 per MWh. Assume the price rises to €60 on day one, €70 on day two, and €80 on day three, then remains at €80 through the physical sale and hedge close-out.
Each €10 move creates a €10 million loss on the short hedge. Assume those losses are paid as daily variation margin. By day three the producer has paid €30 million, while the physical buyer has paid nothing yet. The modeled market price has improved the value of the future sale, but the cash receipt is still on day 30.
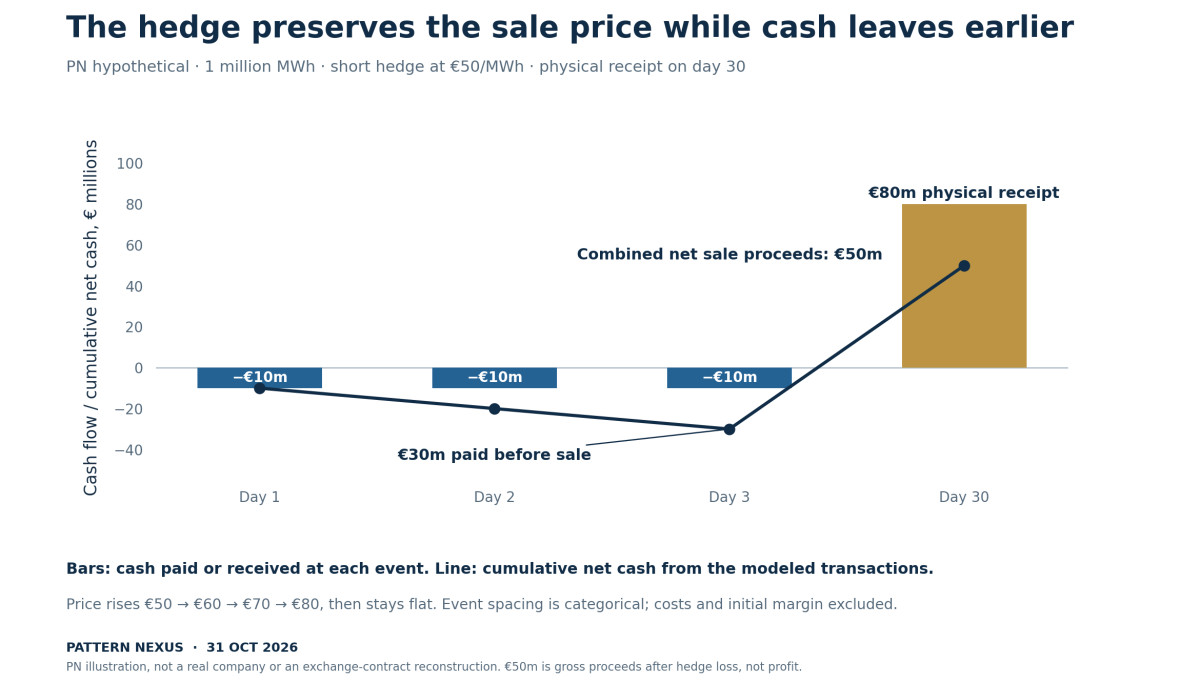
On day 30, the producer receives €80 million for the physical sale. After the €30 million hedge loss already paid, it has retained €50 million of gross sale proceeds across the combined transaction. That matches the original €50 per MWh selling level on one million MWh. It is revenue before production costs, financing costs, fees, and taxes; it is not profit.
The price protection worked under the assumptions. The producer nevertheless needed €30 million of financing before the sale. A business with ample liquidity could meet the calls routinely. A business with insufficient cash and credit available by the deadline could face a problem before receiving the offsetting proceeds.
This example assumes matched volumes, benchmark, delivery period, currency, and settlement values. It omits initial margin and actual exchange contract specifications. It also assumes output is delivered and the customer pays in full. It illustrates the cash schedule of an idealized hedge; it does not estimate a particular company’s position or reproduce a specific TTF contract.
The margin payment must be counted once. It settles the modeled futures loss as it occurs. Subtracting another €30 million at close-out would double-count the same loss and make a successful hedge look economically worse than it is.
05 · ENERGY AND COLLATERAL
The direction of the position changes the cash pressure
An energy-price increase does not create identical derivatives losses throughout the energy sector. A long futures position gains when the reference price rises. A short position loses. The physical business being hedged determines whether that derivatives movement offsets another exposure.
| Stylized position | Effect of a matching price rise | Potential timing issue |
|---|---|---|
| Producer with expected output and a short futures hedge | Higher expected physical-sale proceeds; futures losses | Margin can be due before sale receipts |
| Buyer with future fuel needs and a long futures hedge | More expensive physical purchase; futures gains | Gains may help fund procurement, subject to access and timing |
| Retail supplier with fixed customer prices and incomplete fuel cover | Higher procurement cost without a full offset | Operating cash and profitability can both deteriorate |
| Trader holding mismatched locations or delivery months | Gains and losses depend on the spread between positions | Offsets may be incomplete or unavailable in the account facing payment |
These are simplified exposures. A real utility can own generation, buy fuel, sell power, serve retail customers, and hold several kinds of derivatives simultaneously. Describing it simply as a utility does not establish whether it receives or pays margin on a particular move.
The same applies to a report of large derivative losses. Those losses may offset physical gains, reflect basis risk, or represent an unhedged position. The interpretation requires the combined book and its payment dates. A headline amount without that context can confuse economic losses with the financing of an effective hedge.
06 · ENERGY AND COLLATERAL
Variation margin, initial margin, and fuel purchases do different jobs
Variation margin transfers cash as the marked value of a position changes. Initial margin provides protection against potential losses during the period needed to manage a default and close positions. Physical working capital finances the actual business, including fuel purchases, inventory, transport, and the wait for customer payment.[4][9]
| Requirement | What can drive it | Cash-flow treatment |
|---|---|---|
| Variation margin | An adverse move in the marked value of the position | A current payment settling or collateralizing that exposure under the applicable contract |
| Additional initial margin | Changes in risk calibration, positions, concentration, or other requirements | More collateral committed; not automatically a realized trading loss |
| Physical working capital | More expensive purchases, inventory, or longer payment terms | Funding tied up until the relevant operating receipts arrive |
For the cleared futures example, variation margin is paid as settlement of the modeled daily loss. Other derivatives can use collateral arrangements with different legal and cash-flow treatment. The generic phrase margin call should not erase those differences.
A price jump can increase a short hedger’s variation payment. Increased volatility or other portfolio changes can also increase initial-margin requirements. That second increase should not be assumed to follow a fixed percentage formula. ICE’s published framework includes risk models, offsets, and additional charges, rather than a universal cash multiplier.[4]
The firm may simultaneously need more working capital. A larger purchase invoice is separate from a margin requirement. In a consolidated cash forecast, both matter, but each must be linked to its own transaction to prevent double counting. Collateral already posted is also separate from newly required collateral and unrestricted cash.
07 · ENERGY AND COLLATERAL
Build the cash budget before calling it a crisis
Extend the hypothetical example. Assume the producer faces €30 million of variation payments, an additional €8 million of initial margin, and €10 million of other near-term operating payments. The existing initial margin has already been funded and is outside this incremental budget. All three new amounts are assumptions.
Available cash is €15 million. A further €20 million of committed borrowing is assumed drawable and settled before the payment deadline. That gives €35 million of usable funding against €48 million of near-term needs, leaving a €13 million gap.
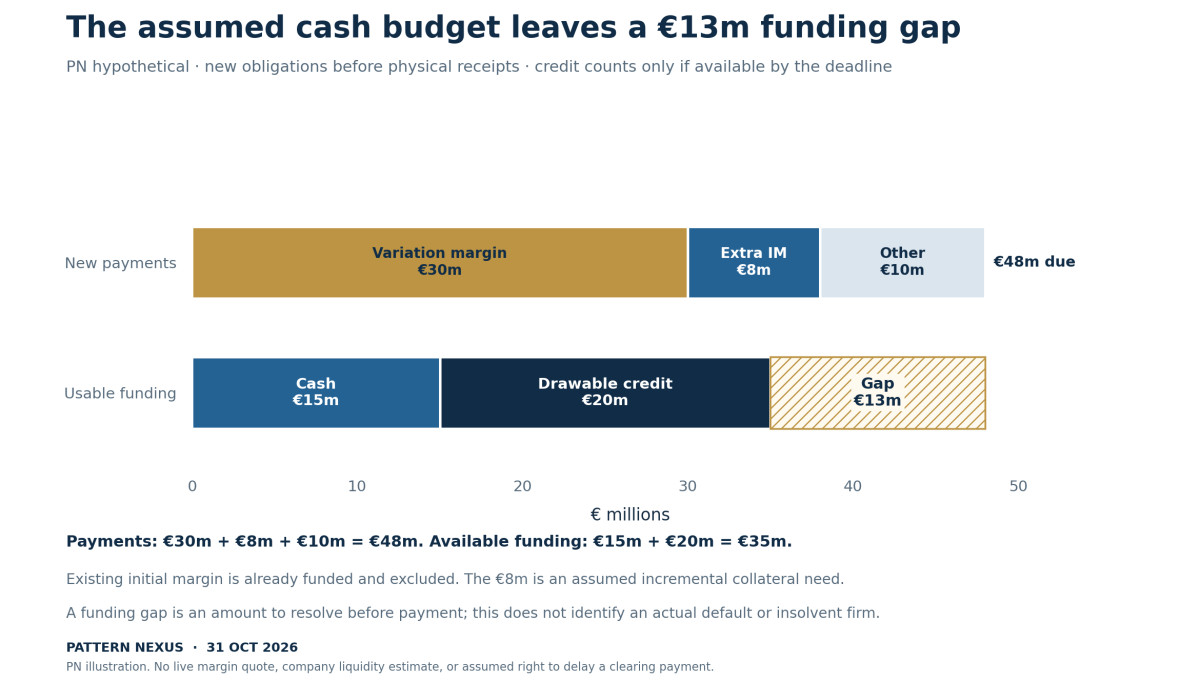
The €8 million initial-margin increase is a collateral commitment, rather than another €8 million trading loss. The €10 million operating item is separate from the modeled futures loss. The €20 million credit line counts only because the example explicitly assumes it can be drawn and received in time.
If the line arrives after the call, it cannot meet that deadline. If cash is held by another legal entity or pledged elsewhere, it may not be usable by the account that owes the payment. If a reported liquidity total includes collateral already posted, counting that collateral again as available cash would overstate capacity.
A company reporting €100 million of liquidity might therefore have more or less capacity than this simple example suggests. The figure could combine unrestricted cash, committed facilities, uncommitted facilities, and assets requiring sale or financing. The components and restrictions determine how much is actually available on the relevant date.
The calculation identifies an assumed funding gap. It does not establish insolvency, a default, or a market-wide shortage. It shows the amount that would have to be resolved through additional funding, revised payment arrangements, or changes in the book before the modeled deadline.
08 · ENERGY AND COLLATERAL
Funding has to arrive in the right form
ICE Clear Europe’s treasury material distinguishes currencies used for initial margin from those used for variation margin. It also identifies permitted cash and securities for initial-margin and guaranty-fund cover, with haircuts and settlement requirements. Those permissions do not make every valuable asset acceptable for every payment.[5]
A security accepted as initial-margin cover can support one obligation while leaving a cash variation payment to be financed separately. Selling it or borrowing against it may create cash, but the transaction needs market access, an acceptable price, operational capacity, and enough time to settle. A haircut can reduce the recognized cover value relative to the asset’s face amount.
Currencies add another step. A firm with dollar receipts and a euro obligation may need foreign-exchange funding or conversion. An apparent group-level cash surplus is less useful if it is in the wrong entity, account, currency, or settlement window.
The clearing procedures make payment mechanics explicit through the Assured Payment System and the obligations of clearing members. End clients also need to understand their arrangements with the clearing member through which they transact. The client’s operational funding chain is part of the analysis, rather than something resolved by a consolidated earnings forecast.[5][6]
The FSB’s December 2024 recommendations address liquidity preparedness across these arrangements, including stress tests and reliable funding sources. They are policy recommendations, not a new October 2026 emergency program. The report specifically cautions against treating uncommitted credit as reliable during market stress.[9]
09 · ENERGY AND COLLATERAL
What the clearing disclosures actually measure
ICE Clear Europe’s resource page reports $102.479 billion of futures-and-options original margin on deposit as of September 30, 2026. Its definition includes excess collateral and applies relevant haircuts. The figure covers the futures-and-options service, rather than a disclosed total for European gas producers alone.[7]
That number is a stock of deposited collateral. It is not the day’s variation-margin call, the amount newly demanded during a winter shock, or unrestricted cash available to the companies that posted it. It cannot be added to corporate credit lines as though it were spare liquidity.
The same resource page separately identifies guaranty-fund and other default resources. Those protect the clearing structure under specified circumstances. They are not ordinary working-capital facilities that a client can draw to pay its margin obligation.[7]
These disclosures are useful for evaluating the clearing system. Company cash statements and facility disclosures answer another question: whether a particular participant can fund its obligations. A well-collateralized clearing house can coexist with a client facing a difficult cash deadline.
The separation also prevents an exaggerated claim about systemic risk. A large collateral stock does not show that the system is failing. It demonstrates the scale of resources already committed under the disclosed framework. Identifying stress requires changes, exposures, payment performance, and funding conditions with consistent definitions and dates.
10 · ENERGY AND COLLATERAL
Supervisors have observed pressure without disorder
The European Supervisory Authorities’ autumn 2026 update describes higher margin calls and clearing volumes associated with commodity-price swings, while reporting that markets stayed orderly. The report also identifies natural gas as vulnerable to shocks because of supply and production constraints.[8]
That combination fits the normal purpose of margin. As positions revalue, payment requirements move with them. Receiving and paying those amounts can indicate that the risk-management process is operating. A larger call becomes a liquidity problem for the payer when usable resources cannot meet the amount and deadline.
The next escalation would require additional evidence: delayed or missed payments, emergency funding disclosures, sharp reductions in available credit, forced position closures, or impaired trading conditions. The available report does not establish a general winter liquidity crisis or widespread energy-company default.
It does establish that the financial channel is more than an abstract possibility. The supervisory observation supplies a current baseline. The winter scenario asks what would happen if the price move, volatility, or funding constraints became materially more demanding than the participants had prepared for.
The timing of the evidence must remain visible. The autumn report is not a live feed of October 31 payment performance. The September clearing-resource stock and the October energy reports also describe different observation dates. Together they identify the mechanism and starting conditions, while leaving current firm-level positions largely undisclosed.
11 · ENERGY AND COLLATERAL
A smaller cash buffer can change the energy market
A firm facing a tight cash budget may reduce positions to release collateral or limit further calls. A producer buying back part of a short hedge reduces its remaining protection against a future price decline. That decision can improve near-term cash capacity while changing the business’s future exposure.
Position reduction can also affect trading conditions if many firms attempt it at once. Buying back short hedges adds buying pressure to those contracts, although its market effect depends on counterparties, depth, and other flows. It is a possible feedback channel, rather than an automatic explanation for any observed energy rally.
Banks and clearing members may face greater demands from clients at the same time. Some clients draw committed facilities; others request additional financing or different collateral arrangements. The financial consequences depend on contractual commitments, credit quality, limits, and the lenders’ own funding capacity.
An energy-price shock can then reach the real economy through several routes. Procurement becomes more expensive. Working capital rises. Suppliers may revise payment terms. Firms may hedge less or reduce activity. These are conditional responses; the article does not assume every participant takes them or that each response moves prices in the same direction.
Variation margin also has a receiving side. The cash does not disappear from the system because a producer pays it. The distribution changes. A receiving participant’s surplus does not automatically fund an unrelated payer by its deadline, which is why aggregate cash availability alone cannot settle the company-level question.
12 · ENERGY AND COLLATERAL
The physical offset can fail to match
The producer example deliberately assumes a perfect hedge. Real exposures add several ways for the offset to weaken.
Location and basis: The derivative may reference a hub price while the company sells or buys in another region. Transport constraints can change the price difference. A favorable move in the reference contract may then cover less of the physical cost than expected.
Volume: Expected generation or production may fail to arrive. A generator that loses output can retain a derivatives obligation without the matching physical sale. It may also have to purchase replacement energy to meet a customer commitment.
Timing: The physical invoice and hedge can refer to different delivery periods. A profitable calendar spread across the full period may still require financing on the losing leg first.
Counterparty and access: A physical customer can pay late or fail to pay. An offsetting derivative held in another account may not be available for netting against the obligation that is due. Consolidated economic exposure does not by itself establish a right to combine those payments.
These possibilities change the diagnosis. An ideal hedge with a timing gap needs bridging finance. A broken volume or basis match can create an economic loss as well. A delayed receivable adds credit risk. Calling all three a temporary margin problem would understate the exposure.
For a company-specific conclusion, I would need the positions, physical commitments, collateral arrangements, and reliable funding resources. Public inventories and aggregate clearing statistics cannot reveal that complete book. The examples here show what to ask of the evidence without identifying a hidden loss at an unnamed firm.
13 · ENERGY AND COLLATERAL
The threshold depends on volume as well as price
Return to the assumed €35 million of usable funding and €18 million of non-variation needs: the €8 million incremental initial margin plus €10 million of other payments. That leaves €17 million to absorb variation payments before a funding gap appears.
For the idealized short hedge, variation cash paid over a monotonic price rise equals hedged MWh multiplied by the increase in euros per MWh. At one million MWh, a €17 move uses that €17 million buffer. Larger moves exceed it. With half that volume, the same buffer absorbs a larger price move.
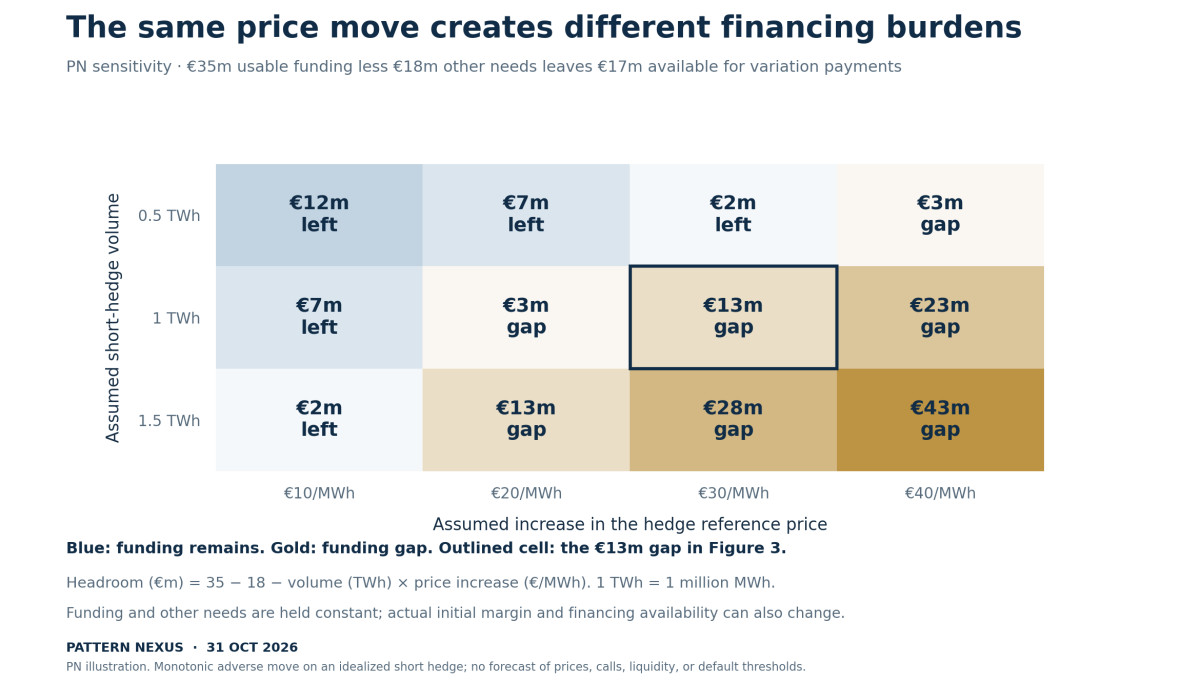
The table varies hedge volume and the assumed price increase while holding funding and other needs constant. It is a sensitivity calculation, not a forecast of prices, initial-margin requirements, or company liquidity. Actual initial margin and available financing could change as the scenario develops.
The threshold describes cash capacity under stated assumptions. It does not locate a default point. A firm could add funding, receive cash from other positions, negotiate terms, or change its hedge. Each response has its own constraints and consequences.
This also explains why a sector-wide headline price cannot identify the weakest payer. Two companies facing the same reference-price increase can have different hedge volumes, cash dates, netting arrangements, and financing headroom. The financing burden scales with the exposure that actually requires payment.
14 · ENERGY AND COLLATERAL
The sequence worth watching this winter
A financial transmission could develop before a large physical shortage becomes visible. A weather or supply surprise changes expected fuel needs. Forward prices and spreads reprice. Some short positions owe variation margin, while volatility or portfolio changes can add collateral requirements. The operating business may then need more cash for inventory and procurement.
The next step depends on funding capacity. If participants have prepared and can transfer the required funds, the episode can remain an orderly repricing. If cash is delayed or inadequate, some may seek additional bank financing or reduce positions. A broader stress claim would require evidence that those adjustments were disrupting payments or markets.
My watch list combines the two sides:
- Physical availability: Dated storage levels, withdrawals, actual LNG arrivals, outages, regional transport constraints, and weather-driven demand.
- Price exposure: The size and direction of the move, location spreads, delivery-month spreads, volatility, and whether the hedge still matches the physical business.
- Payment requirements: Variation payments, incremental initial margin, collateral eligibility, and the dates and currencies involved.
- Usable funding: Unrestricted cash and facilities that can actually be drawn, transferred, and settled before the call.
- Observable strain: Emergency financing, overdue payments, forced position changes, widening trading costs, or impaired intermediation.
The first items can identify pressure. The last items help establish whether that pressure has become disruptive. A rise in a benchmark price or a routine margin payment is insufficient on its own.
PATTERN NEXUS VIEW
The Pattern Nexus view
The connection to PN’s Liquidity Framework & Market Plumbing is the need to follow available resources through the channels and dates on which they can be used. An energy company can possess valuable future output while the account supporting its hedge needs cash today.[10]
This winter’s underappreciated financing question is who must bridge the interval. The producer with a short hedge can be economically protected and cash-hungry during a price rise. The buyer with a long hedge can receive cash while facing a more expensive physical purchase. The unhedged supplier can face a direct deterioration in operating margins. Each has a different transmission path.
The October supply evidence gives a reason to watch those paths. It does not establish that an unavoidable crisis is approaching. The current supervisory baseline is one of higher margin activity with orderly markets. A stronger conclusion would require payment and funding evidence beyond the aggregate data.[1][2][8]
The signal I would follow is the cash deadline becoming harder to meet as exposure reprices. That can become consequential before an annual earnings statement fully reflects the physical offset. The balance sheet, hedge, and payment calendar have to be read together.
READER QUESTIONS
Frequently asked questions
Does a margin call mean the company made a bad trade?
An effective hedge can owe margin while its physical offset gains value. In the producer example, higher sale proceeds offset the futures loss across the full transaction. The cash payments still arrive earlier. Assessing the trade requires both sides and their terms. Assessing liquidity requires the actual payment dates and usable funding.
Does every energy company pay margin when gas prices rise?
A short position loses when its reference price rises; a long position gains. A company can hold both across different products, months, and locations. Its physical exposures also differ. The label producer, utility, or trader is insufficient to establish the payment direction of its full portfolio.
Is initial margin another trading loss?
Initial margin supports potential future exposure under the applicable clearing arrangement. An increase commits additional collateral, which can consume cash capacity, but it is not automatically an additional realized loss. Variation margin and physical operating payments must be recorded separately. The article’s €8 million increase is an assumption, rather than an ICE margin quote.[4]
Do the October inventories prove a winter shortage is coming?
They describe starting conditions and regional differences. EU storage was 75% on October 21 in ACER’s report. U.S. Lower 48 stocks were slightly above the five-year average on October 23. Weather, supply, transport, and demand determine the subsequent path. ENTSOG’s constrained-LNG outcomes are conditional scenarios, rather than a certain forecast.[1][2][3]
Can a firm use any asset it owns to pay the call?
The relevant agreement determines the form of payment and eligible collateral. ICE’s material distinguishes cash variation settlement from permitted cover for initial margin and guaranty-fund requirements. Assets may also face haircuts, transfer restrictions, and settlement deadlines. A valuable receivable or physical asset is not automatically cash in the required account.[4][5][6]
Has a general energy-margin crisis already been identified?
The cited autumn 2026 supervisory update says commodity-price swings increased calls and clearing volumes while markets stayed orderly. This article does not identify a general payment failure or company default. Its winter stress sequence is conditional. A stronger claim would require current evidence of disrupted payments, inadequate funding, or impaired market functioning.[8]
What would weaken the winter financing-risk thesis?
Stable supply, manageable demand, orderly repricing, and timely funding would weaken the escalation case. So would disclosures showing ample usable headroom under credible stress assumptions. A price move can produce substantial margin transfers without disruption when participants can fund them. The mechanism warrants monitoring; its disruptive outcome is not predetermined.
METHOD AND EVIDENCE
Method and evidence
Research cutoff: October 31, 2026. European physical context comes from ACER’s October 27 report, including storage updated through October 21, and ENTSOG’s October 8 winter outlook. U.S. inventories are EIA’s October 23 observations released October 29. Clearing resources are a September 30 stock. The supervisory assessment is the autumn 2026 update.
Figure 1 uses EIA’s published regional stocks and five-year comparisons. Figures 2–4 are PN illustrations with stated assumptions. They do not reconstruct a real company’s book, forecast winter prices, or estimate live margin calls. One TWh equals one million MWh; the hypothetical hedge uses generic cash settlement and a monotonic price path.
The cash model distinguishes settlement of derivatives losses, incremental collateral, operating payments, and funding available before a deadline. It counts the futures loss once. The combined €50 million proceeds exclude production and financing costs. Existing initial margin, basis risk, volume failure, and actual exchange contract specifications are outside the numerical example.
The financial transmission is a conditional mechanism. Public storage and clearing disclosures do not identify which firms have insufficient usable liquidity. A company-specific conclusion would require evidence the aggregate sources do not provide.
SOURCES
Research and Data Sources
Official energy reports establish the physical context. Clearing documents establish payment mechanics; dated disclosures and supervisory findings establish the observed financial baseline. PN examples and conditional scenarios are identified separately.
- ACER. Key developments in European gas wholesale markets — gas summer 2026 and a look at winter 2026/2027. October 27, 2026; storage updated through October 21. Storage 75%; end-winter level 28%; demand and LNG-supply context. Dated physical conditions, not a current company liquidity reading.
- ENTSOG. Winter Supply Outlook 2026/27 with Summer 2027 Overview. October 8, 2026; October 1 starting conditions. Conditional LNG, storage, weather-sensitive demand, and regional network scenarios. Constrained-supply cases are not unconditional forecasts.
- U.S. Energy Information Administration. Weekly Natural Gas Storage Report. Released October 29, 2026; week ended October 23. Lower 48 working gas and regional comparisons against 2021–25 averages. Total and regional percentage differences are the published rounded values.
- ICE Clear Europe. Risk Management. Current page, accessed October 31, 2026. Daily cash variation settlement, intraday calls, initial-margin models and additional requirements; not a quote of a hypothetical company’s margin.
- ICE Clear Europe. Treasury and Banking. Current page, accessed October 31, 2026. Payment currencies, initial-margin permitted cover, haircuts, settlement and payment infrastructure.
- ICE Clear Europe. Finance Procedures. September 2025 document currently linked; accessed October 31, 2026. Clearing-member payment obligations, Assured Payment System, collateral procedures, and deadlines. Client arrangements require their own terms.
- ICE Clear Europe. Regulation — Financial Resources. Resources as of close September 30, 2026; accessed October 31. Futures-and-options original margin on deposit $102,479,329,026, including excess collateral after haircuts. Service-wide collateral stock; not energy-only cash calls or company spare liquidity.
- EBA, EIOPA and ESMA. Joint Committee update on risks and vulnerabilities in the EU financial system — autumn 2026. Published September 23, 2026. Reports higher commodity-related margin calls and clearing volumes with orderly markets. Dated supervisory baseline, not a live October 31 payment feed.
- Financial Stability Board. Liquidity Preparedness for Margin and Collateral Calls — final report. December 10, 2024. Liquidity preparedness, stress testing, funding reliability and collateral practices for non-bank participants, including commodity traders. Policy recommendations; not a new October 2026 emergency measure.
- Pattern Nexus. Liquidity Framework & Market Plumbing. Public research hub, accessed October 31, 2026. Related PN framework for balance-sheet capacity, collateral flows, funding, and settlement. Interpretive framework, not independent evidence of energy-company distress.
Public research on energy markets, collateral, and the cash required to carry a hedge. This article is available free, without a premium or registration gate.
Article overview
A winter price shock can demand cash before a hedge’s physical offset pays out. PN examines October gas inventories, clearing terms, and a worked producer example to trace how variation margin, collateral, and financing deadlines can transmit energy stress.
What's Your Reaction?
 Like
0
 Dislike
0
 Love
0
 Funny
0
 Wow
0
 Sad
0
 Angry
0

Nexus (Christopher)
Founder of Pattern Nexus. I research markets, macro, geopolitics, AI, history, ancient systems, and the patterns most people overlook. I’m also building Market Radar, a trading scanner designed to read pressure, risk, confirmation, and setup quality before ch…
Related research

The Fiscal-Monetary Fusion — Audio-Video Edition
Episode 9 of the weekly Pattern Nexus audio-video series turns Part 9 of Cycles of Power into a shorter story about how pandemic stimulus f…
5 shared topics, same research avenue.
The Oil Cushion Is Breaking: Hormuz, Inventories, and the Liquidity Shock Hiding Inside Energy
Oil Crisis, Strait of Hormuz, Hormuz, Energy Shock, Inflation, Brent Crude, WTI Crude, Strategic Petroleum Reserve, SPR, Oil Inventories, G…
5 shared topics.
The New Fed Chair Does Not Inherit an Economy. He Inherits the Permission Stack.
Kevin Warsh is not simply inheriting the Federal Reserve. He is inheriting the control layer where inflation, debt service, Treasury fundin…
5 shared topics.
The Headline Is Late: How Pattern Nexus Mapped the Chokepoint War Before Hormuz Became Visible
The Iran-Hormuz crisis did not create the Pattern Nexus framework. It exposed it. For months, Pattern Nexus had already been mapping the de…
5 shared topics, same research avenue.
Macro Cosmogony Map — The Complete Pattern Nexus Liquidity Framework
The full multi-layer circular macro cosmogony map of the global liquidity system, collateral hierarchy, AI-energy industrial cycle, geopoli…
5 shared topics.
The Convergence — Audio-Video Edition
The finale of the Pattern Nexus Cycles of Power audio-video series connects 150 years of industrial, monetary, computing, energy, and liqui…
4 shared topics, same research avenue.
The World I’ve Been Mapping Is Taking Shape
I connect the developments now taking shape across AI infrastructure, private power, critical minerals, the Iran energy shock, digital doll…
4 shared topics, same research avenue.
The QE Decade — Audio-Video Edition
Episode 8 of the weekly Pattern Nexus audio-video series turns Part 8 of Cycles of Power into a shorter story about how quantitative easing…
4 shared topics, same research avenue.
Comments (0)
Security Check
Please complete the captcha to verify you are human.