
The Next Recession: What Outperforms and Why (2026–2030 Analysis)
A deep institutional analysis of how the next recession will unfold, what sectors historically outperform, and how AI industrialization and tokenized rails shape 2026–2030.
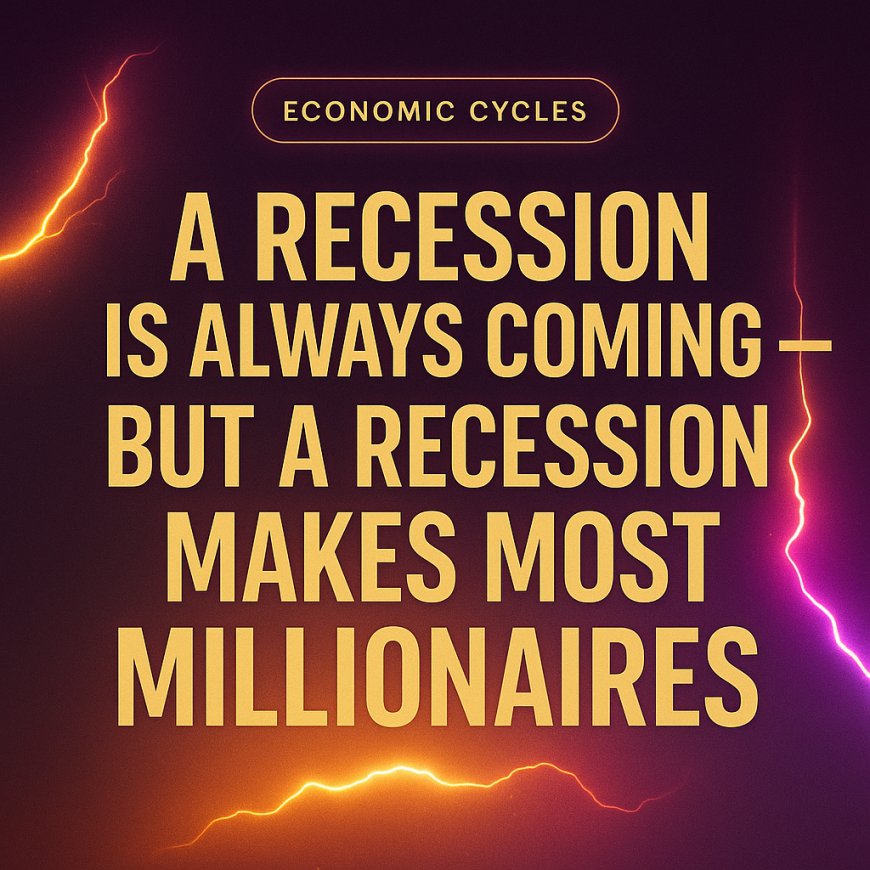
Recession Playbook 2026–2030: A Data-Driven Strategy for a Downturn
An institutional macro analysis of what survives, what leads, and how AI-driven industrialization and tokenized financial rails will alter the next recession cycle.
Executive Summary
For more than a decade, recession forecasts have outnumbered actual recessions. Each inversion, collateral kink, and fiscal standoff is treated as the breaking point—yet the global system keeps compounding atop three structural forces: accelerating technology investment, an AI-industrial build-out, and a collateral-centric monetary architecture that increasingly orbits U.S. Treasuries.
Recessions still occur. They reset risk premia, filter weak balance sheets, and reprice entry points into durable cash-flow franchises. Historically, three sleeves dominate during official recession windows: defensive equities (staples, utilities, healthcare), high-quality duration (USTs/core IG), and monetary hedges (gold). Those patterns remain, but the next downturn will be bent by forces we’ve covered across Pattern Nexus—AI power build-outs (AI Industrial Flywheel), liquidity plumbing and collateral (Reverse Repo Trap, Repo Surge), and tokenized rails (Tokenized Reserve Era).
This is not a crash call. It is a rules-based strategy for a 2026–2030 recession that integrates sector history with system plumbing and Our worldview on the next operating system of markets.
Why Recessions Still Matter
Recessions are regime tests. They compress earnings volatility, force capital toward resilient cash flows, and allow monetary policy to re-anchor expectations. In downturns, capital prefers resilience over growth optionality. Historically persistent winners include:
- Defensive equity sectors: consumer staples, utilities, healthcare (Market Cycles & Regimes)
- High-quality duration: Treasuries and investment-grade cores (Rates & Yields)
- Monetary hedges: gold and, selectively, miners—especially around policy inflection (Commodities, Gold & FX)
These outcomes persist because human needs and institutional constraints persist. People still consume essentials; hospitals still operate; Treasuries remain the core operating collateral of the system.
Sector Performance Across Past Recessions
Defensive Equity Outperformance
Across post-1970 recessions, defensive sectors have outperformed broad benchmarks on a relative basis. Reasons: non-discretionary demand, regulated rate frameworks, and stable cash flows. Staples typically deliver the lowest drawdowns; utilities benefit from regulated returns and falling financing costs; healthcare demand is less elastic.
Nominal bubbles can be optical (Everything Bubble 3 — Markets in Gold). In a contraction, that lens is clarifying: what truly holds value is durable cash flows and system utility, not nominal optics.
Duration & Core Bonds
Treasuries tend to perform early in recessions as growth expectations fall, inflation cools, and curves normalize. Magnitude depends on the starting inflation regime. IG aggregate cores benefit from benchmark yield declines, while credit spreads usually widen into the contraction and compress during recovery. See also our work on regime pivots (The Pivot Is Here).
Gold & Monetary Hedges
Gold’s recession performance is a function of real yields and liquidity preference, not just CPI prints. When policy eases and real yields fall, gold’s opportunity cost declines. Stress in funding or banking systems further increases its attraction as non-default collateral. See: Gold Front-Runs Liquidity (Again), Gold vs the 10-Year, Gold $4,300 — System Reset.
Yield-Curve Mechanics & Policy Reflex
Every recession is a curve story. The classic sequence: inversion → growth shock → policy cuts → re-steepening. What matters for portfolios is the timing of duration entry and the handoff from defensives to cyclicals as the curve normalizes.
- Inversion phase: Growth expectations deteriorate; late-cycle equity leadership narrows; liquidity plumbing takes center stage (Liquidity, QE/QT & Collateral).
- Policy inflection: Cuts/forward guidance; real yields decline; duration rallies; gold strengthens; low-vol/quality factors outperform (The Silent War Chest).
- Early recovery: Curves re-steepen; cyclicals re-price; AI/industrial complex re-accelerates as guidance stabilizes (Declining Liquidity & Markets).
collateral plumbing thesis also matters here: RRP, bill supply, TGA paths, and stealth QE dynamics shape the amplitude of the bond rally and the speed of equity rotation (Reverse Repo Trap, Fed MBS & Repo Ops — QE 2026).
Why the 2026–2030 Recession Will Be Different
AI-Driven Industrialization as a Cycle Buffer
Unlike 2001 or 2008, the next downturn sits atop a multi-year AI power and compute build-out: accelerators, hyperscale data centers, high-capacity substations, transmission upgrades, thermal systems, regional fiber, and on-prem hybrid stacks. This converts part of “cyclical” industry into mandated capex with policy and competitive tailwinds. See: AI Industrial Flywheel, AI Energy Demand, Systemic Realignment.
Tokenized Rails as a Treasury-Demand Amplifier
Tokenized cash, bills, and settlement rails shift balance-sheet behavior: collateral becomes programmable, mobility improves, and pristine assets (USTs) see structurally higher demand. In recession, this reinforces duration’s bid and smooths funding transmission compared with pre-tokenization cycles. See: Tokenized Reserve Era, Digital Sovereignty & CBDCs, Master Brief.
Policy Reflexivity (Cuts, QE-Lite, and Collateral Channels)
Expect the classic reflex—rate cuts, targeted balance-sheet tools, bill-heavy issuance paths. But the rails are faster now: on-chain collateral movement, real-time settlement, and AI-driven credit adjudication compress transmission lags. See: QT Is Over — Reserve Floor, October Pivot & Digital Dollar Frontier.
Scenario Analysis (2026–2030)
Scenario A — Classic Squeeze (Base)
Growth slows, unemployment rises, inflation returns to target. Winners: defensives (staples, utilities, healthcare), duration (USTs/core IG), gold. AI capex decelerates but persists; tokenized settlement deepens Treasury demand. Related: Market Cycles & Regimes.
Scenario B — AI Air-Pocket (Volatile)
Hyperscalers trim guidance; AI suppliers correct sharply; defensives + duration lead initially. As policy eases and order books normalize, the AI-industrial complex resumes leadership. Related: AI Feedback Loops.
Scenario C — Stagflation-Lite (Risk Case)
Growth weak; inflation sticky due to energy/supply shocks. Duration is a weaker hedge; utilities with pass-through mechanisms, quality cash-flow franchises, and gold outperform. Related: Commodities, Gold & FX.
Scenario D — Collateral-Crunch Recovery (Upside Tail)
A funding scare accelerates tokenized collateral adoption; UST demand spikes; yields compress; equities bottom sooner than historical averages; gold stabilizes; cyclicals re-engage earlier. Related: Liquidity & Collateral.
Positioning Framework
Defensive Allocation (First Line)
- Consumer Staples (non-discretionary cash flows; margin resilience)
- Utilities (regulated returns; dividend support; potential rate-base growth from grid upgrades)
- Healthcare (demographic + insurance-driven demand)
- Discount retail / big box (trade-down dynamics)
- Quality & Low-Volatility factors (profitability + balance-sheet strength)
Cross-reference: Global Macro Signals.
Duration & Core Bonds (Ballast)
- Intermediates & long USTs (curve normalization, falling reals)
- Core IG aggregates (benchmark yield tailwind; mind spreads)
- Selective credit after spread peaks (post-inflection)
Cross-reference: Treasury Line in the Sand, Fiscal Dominance & Term Premium.
Monetary Hedge Sleeve
- Core gold exposure as a liquidity preference hedge
- Gold miners as torque post-policy inflection
Cross-reference: Gold vs 10-Year, Gold $4,300.
Cyclical Re-Entry (Secular)
Use recessionary drawdowns to scale into the AI-industrial stack: semis/accelerators, electrical equipment, grid/transmission, thermal systems, specialty data-center REITs, and utilities with signed PPAs. The demand curve is policy- and competition-anchored, not purely cyclical. See: AI Industrial Flywheel, U.S. Nuclear Investment.
Risk Controls & Sizing
- Size duration to volatility tolerance; avoid forced selling
- Emphasize balance-sheet strength; limit leverage exposure
- Keep dry powder for capitulation phases
- Avoid tourist risk in cyclical small caps pre-policy turn
Related viewpoints: Calm Before the Liquidity Storm (QE 2026), End of the Bond Supercycle.
Appendix — Probabilities & Playbook Table
Probability Ranges (illustrative)
- Classic Squeeze (Base): 45–55%
- AI Air-Pocket: 20–30%
- Stagflation-Lite: 10–20%
- Collateral-Crunch Recovery: 10–15%
Ranges reflect current plumbing (RRP/TGA), policy reflex capacity, tokenized collateral momentum, and secular AI capex inertia. For recent plumbing context, see Repo Surge (Nov ’25).
One-Glance Playbook
| Phase | Likely Leaders | Hedges | Rotation Trigger | Cross-Refs |
|---|---|---|---|---|
| Late-Cycle / Inversion | Quality, Low-Vol, Select Defensives | Dur. UST (starter), Gold (core) | Policy guidance; funding stress | Liquidity & Collateral |
| Recession Onset | Staples, Utilities, Healthcare | Long USTs, Core IG; Gold | Re-steepening begins | Rates & Yields |
| Policy Inflection | Gold + Miners; Defensives hold | Dur. still works; reduce spread risk | Forward guidance, liquidity ops | QE-style Ops |
| Early Recovery | AI-Industrial Complex, Select Cyclicals | Gold trims; credit risk up after compression | EPS inflects, capex resumes | AI Flywheel |
Sources & Further Reading
- Macro & Markets (Category)
- Market Cycles & Regimes (Subcategory)
- Liquidity, QE/QT & Collateral
- Rates & Yields
- Commodities, Gold & FX
- AI Industrial Flywheel
- Tokenized Reserve Era
- Reverse Repo Trap
- Repo Surge — Nov 2025
- Fed MBS & Repo Operations — QE 2026
- Gold Front-Runs Liquidity (Again)
- Gold vs the 10-Year Yield
- Gold $4,300 — System Reset
- The Pivot Is Here
- Fiscal Dominance & Term Premium
- End of the Bond Supercycle
- Everything Bubble 3 — Markets in Gold
- S&P Dow Jones Indices — Sector Behavior
- Fidelity — Business Cycle & Sectors
- PIMCO — Recession & Fixed Income
- BIS — Tokenization & Monetary System
- LBMA — Gold & Liquidity
あなたの反応は?
 いいね
0
いいね
0
 嫌い
0
嫌い
0
 愛
0
愛
0
 面白い
0
面白い
0
 ワオ
0
ワオ
0
 悲しい
0
悲しい
0
 怒っている
0
怒っている
0

Founder of Pattern Nexus. I research markets, macro, geopolitics, AI, history, ancient systems, and the patterns most people overlook. I’m also building Market Radar, a trading scanner designed to read pressure, risk, confirmation, and setup quality before chasing a move. Pattern Nexus is where I connect the dots between data, history, technology, and the bigger system playing out around us.















コメント (0)