
Era of Easy Money Ends – How Declining Liquidity Is Shaping Markets
Central banks are pulling back trillions in liquidity after years of easy money. We examine how this liquidity drain – in the US and globally – impacts stocks, the economy, and what it signals for the future.
Liquidity Squeeze: How Falling Global Liquidity Impacts U.S. Markets
Over the past few years, financial markets have experienced a dramatic turn of the liquidity tide. In 2020-2021, central banks flooded the world with an unprecedented wave of easy money. Now that tide is rapidly receding. Liquidity – the lifeblood of markets – is being drained as central banks tighten policy, and investors are starting to feel the effects. In this article, we’ll break down what liquidity means, why it’s falling both in the U.S. and globally, and how this “liquidity squeeze” is shaping the outlook for U.S. markets and beyond.
What Do We Mean by “Liquidity”?
In simple terms, liquidity in the financial system refers to how much money is readily available to be lent, invested, and spent. It’s often influenced by central banks and the banking system. When liquidity is ample, there’s plenty of cash and credit sloshing around: interest rates are low, loans are easy to get, and investors have lots of fuel to buy assets (like stocks, bonds, real estate, etc.). When liquidity is tight or falling, money becomes scarcer: borrowing costs rise and investors grow more cautious with their cash. You can think of liquidity like the water that floats the boats in a harbor – if the tide rises (more liquidity), all boats (asset prices) tend to lift. If the tide goes out, boats can settle lower or risk running aground.
Central banks play a huge role in liquidity. In times of crisis or recession, they often pump money into the economy – for example by cutting interest rates to zero and buying assets (quantitative easing or “QE”). This was the case in 2020 when the COVID-19 pandemic hit: the U.S. Federal Reserve, European Central Bank (ECB), Bank of Japan (BoJ), and others collectively unleashed trillions of dollars of liquidity to stabilize markets and economies. On the other hand, when inflation becomes a concern or economies run hot, central banks may reverse course – raising interest rates and even pulling money out of circulation (quantitative tightening or “QT”). These policy shifts have a direct impact on the liquidity environment.
From Flood to Drought: The Great Liquidity Reversal
The contrast between a few years ago and today couldn’t be more striking. During 2020–2021, global money supply and central bank balance sheets exploded in size. Governments and central banks essentially “printed” money to fight the pandemic’s economic fallout. By some estimates, the broad global money supply surged over 24% combined in 2020 and 2021 – an astounding increase in such a short period. Major central banks’ balance sheets (a common proxy for liquidity injections) grew at a record pace, reaching all-time highs. For instance, the aggregate assets of the four biggest central banks (the Fed, ECB, BoJ, and China’s PBoC) swelled to roughly $30 trillion by early 2022. This flood of liquidity fueled a rapid recovery in financial markets: stock indices hit record highs, and asset prices across the board (from tech stocks to housing and commodities) were buoyed by the sea of easy money.
However, by 2022 the tide started to turn. Inflation had spiked in many countries as a side effect of the stimulus, and central banks pivoted to tightening policy. Interest rates began climbing rapidly, and crucially, the era of quantitative easing shifted into quantitative tightening (QT) – meaning central banks started shrinking their balance sheets. Instead of adding liquidity by buying bonds, they let bonds mature or sold assets, effectively pulling cash out of the financial system. In the United States, the Fed’s QT program ramped up in mid-2022 and has been draining liquidity since. The numbers are eye-opening:
- U.S. Federal Reserve: The Fed’s balance sheet has shrunk from nearly $9 trillion at its peak to about $6.6 trillion as of late 2025}. In other words, roughly $2.4 trillion of liquidity has been withdrawn by the Fed after the pandemic stimulus ended. This was achieved by stopping new bond purchases and allowing hundreds of billions in bonds to roll off each quarter.
- U.S. Money Supply: Reflecting these actions, the broad U.S. money supply (M2) actually contracted in 2022–2023 – the first annual decline in U.S. money supply since 1949. This is a historic shift; for decades, money supply only ever grew. The shrinkage (over $700 billion drop in M2 from the peak) signals how aggressively monetary conditions tightened from the pandemic extremes.
- Global Central Banks: Other major central banks followed suit in tightening. The ECB ended its bond-buying programs and started QT in 2023. The Bank of England began reducing its holdings as well. The combined balance sheets of the Fed, ECB, and Bank of England by late 2024 were the smallest relative to their economies (GDP) since early 2020, essentially reversing the pandemic-era expansion on a relative basis. In absolute terms, the Fed, ECB, BoE, and BoJ together saw their total assets drop significantly from the highs. One analysis noted that the “G4” central banks’ combined balance sheet fell by about $2.2 trillion in 2022 and another $2.2 trillion in 2023 – a stark turnaround from the rapid expansions of prior years.
- Global Money Supply: Zooming out, the worldwide liquidity trend has indeed flipped. Globally, broad money supply growth turned negative in 2022 for the first time in many years. By Q3 2023, global real money supply (adjusted for inflation) had fallen back to pre-pandemic levels. Advanced economies saw the sharpest pullback – their combined money supply fell over 6% from the peak – while globally the drop was around 0.9% at that point. In essence, a portion of the extraordinary money creation of 2020–21 was being unwound.
This great liquidity reversal can be visualized as the “liquidity tide” going out. One concrete sign in the U.S. was the decline of the Fed’s excess reserves and reverse repo balances. The Fed had a facility called the reverse repo (RRP) that soaked up excess cash from the financial system; during the height of QE, banks and funds parked up to $2.6 trillion in this facility because they had more cash than they could use. Now, with QT in effect, that pile of cash has dwindled to nearly zero by late 2025, indicating that much of the surplus liquidity has been drained away. All these indicators point to a clear fact: liquidity is being squeezed out of the system after years of abundance.
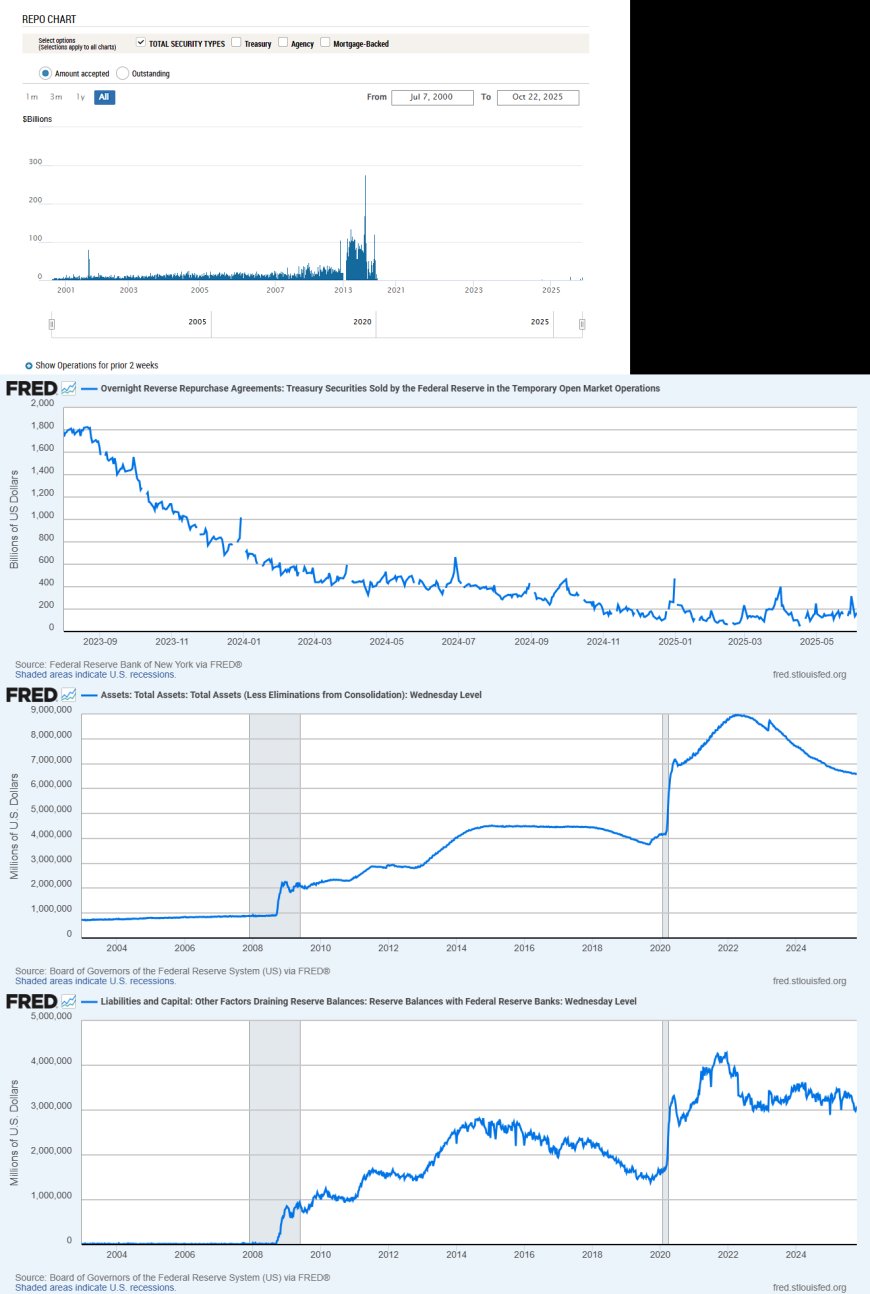
Figure 1: The Liquidity Drain in Charts
Each of these charts tells part of the same story — the hidden tightening beneath the surface of the markets. Together, they show how liquidity is leaving the system just as it did before every past funding crisis.
U.S. Bank Reserves (WRESBAL)

Bank reserves peaked during the 2020 liquidity flood and have been falling ever since. When reserves approach 2019–2020 levels, the system nears stress — this is the foundation of every modern liquidity crunch.
Federal Reserve Total Assets (WALCL)

The Fed’s balance sheet — the lifeblood of dollar liquidity — has contracted by over $2 trillion since 2022. Every major drawdown in this chart has eventually forced a QE reversal.
Overnight Reverse Repo Balances (RRPONTSYD)

The reverse-repo facility once held $2.6 trillion in excess cash. By late 2025 it’s nearly empty — proof that the easy-money surplus is gone and funding markets are tightening.
Treasury General Account (WTREGEN)

The TGA acts like a drain-valve for liquidity: when Treasury refills it through issuance, cash leaves banks; when it spends, liquidity returns. The swings here mirror each liquidity wave.
Money Supply (M2SL)

M2 actually contracted in 2023 — the first time since the 1940s. That reversal signaled the end of the stimulus era and confirmed that QT was biting into real money availability.
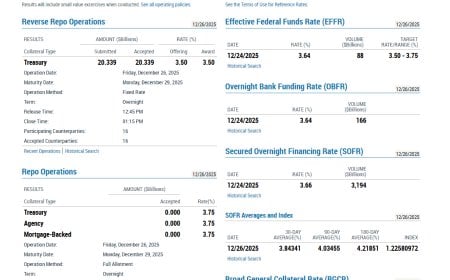
Secured Overnight Financing Rate (SOFR)

Every spike in SOFR marks a stress event in funding markets — from the 2019 repo crisis to periodic 2023–2025 squeezes. When liquidity thins, this rate jumps first.
Global Liquidity (BIS & Major Central Banks)

Source: Bank for International Settlements (BIS) Global Liquidity Indicators. Click the image to view the interactive dashboard with central bank balance sheets and cross-border credit data.
Globally, the G4 central banks’ balance sheets have been shrinking in sync. This isn’t just a U.S. story — the entire world is pulling liquidity at once, setting the stage for another coordinated QE cycle in 2026.
Together these charts make the pattern obvious: as reserves fall, funding tightens, repo spikes, and global liquidity contracts — the system reaches a point where QE has to return. It’s not policy preference, it’s survival.
Why do we care about these trillions in liquidity moving in or out? Because liquidity is often described as the “fuel” for financial markets. When money is cheap and abundant, investors tend to take more risks: they buy more stocks, they invest in ventures, they bid up asset prices in general. We saw this in the post-2020 rally – with interest rates at zero and central banks buying bonds hand over fist, capital was plentiful and looking for a home, which helped propel the stock market to new highs. Conversely, when liquidity is being withdrawn, it can act as a headwind for markets: less free cash to invest means investors may become more selective, and asset valuations may come under pressure as the easy money era fades.
Over long periods, there is a striking relationship between the money supply and market valuations. For instance, the total value of world equities and measures of the money supply have tended to rise in tandem over decades. In the U.S., the S&P 500’s growth has roughly mirrored the growth in the nation’s money supply (M2) over the long run. One analysis noted that from the 1990s through 2022, major U.S. stock indexes (like the S&P 500, Dow, etc.) increased about 6.5% per year – which is very similar to the ~6.5% annual growth rate of U.S. M2 money supply in that period. In other words, as the amount of money in the system expanded, it eventually was reflected in higher company earnings, higher investment, and thus higher stock prices. While many factors drive markets, the “money factor” is significant.
That said, liquidity isn’t the only game in town. In the short run, other forces can counteract or overshadow the effect of liquidity. A great example is the year 2023: by then, central banks were pulling back liquidity (the Fed and others were deep into QT), yet the U.S. stock market surged that year – the S&P 500 rose on the order of 20%+, and the Nasdaq even more. How is that possible during a liquidity squeeze? The answer lies in strong fundamentals and investor narratives that can offset tighter monetary conditions. In 2023, corporate earnings proved resilient and excitement over new technologies (like generative AI) fueled a boom in tech stocks. This exuberance helped markets climb despite the withdrawal of liquidity. As one commentator pointed out, global stocks rallied strongly in 2024 even as central bank liquidity was being drained, illustrating that factors like economic growth, innovation, and investor sentiment also play crucial roles. In short, liquidity is a powerful tide, but it’s not the only force moving the boats.
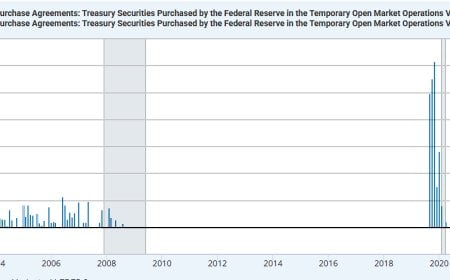
However, liquidity’s influence tends to show up eventually, and in certain market stresses it becomes the dominant factor. When liquidity gets too tight, cracks can emerge in the financial system. A historical incident often cited is the “repo market” turmoil of late 2019:
Secured Overnight Financing Rate (SOFR) – FRED (see Sep 2019 spike)
back then, the Fed had been slowly tightening and letting reserves in the banking system fall. Liquidity became just scarce enough that overnight lending rates between banks spiked unexpectedly, causing a mini-crisis in a usually obscure corner of finance. The Fed had to step in promptly with cash injections to quell the storm. This episode was a reminder that if the central bank drains too much liquidity, markets can seize up – essentially the system’s pipes run dry, and even otherwise safe markets (like short-term lending markets) can experience a shock. As a safeguard, the Fed now monitors bank reserves carefully and has tools (like standing repo facilities) to backstop the system in case of unexpected tightness. But the lesson remains: ample liquidity is needed for smooth market functioning, and taking it away too fast can cause unintended consequences.
Global Liquidity: All in the Same Boat
It’s important to note that liquidity is a global phenomenon. In today’s interconnected markets, what major central banks do in one region can spill over to others. U.S. investors, for example, can be affected by the actions of the European Central Bank or the Bank of Japan, and vice versa. Lately, the global trend has been synchronized: most central banks have been tightening policy in response to a worldwide surge in inflation. This means the liquidity pullback isn’t just an American story – it’s happening across many economies simultaneously.
By late 2023, virtually all major Western central banks were shrinking their balance sheets
BIS Data Portal – Global Liquidity & Central Bank Balance Sheets
or had stopped expanding them. The ECB began letting its portfolio of bonds run down, after years of bond purchases.
ECB Financial Statements / Balance Sheet
The Bank of England embarked on QT, albeit cautiously (even as it had to intervene briefly in 2022 to stabilize its bond market). Smaller central banks from Canada to Australia also raised rates sharply and curtailed liquidity. As a result, global measures of liquidity all show a decline. For instance, one measure of “global liquidity” (which includes central bank assets and credit metrics) peaked around the end of 2021 at roughly $165 trillion and then fell to around $155–160 trillion by the end of 2022. While the exact figures depend on how it’s defined, the clear direction was down through 2022 and into 2023.
That said, not every central bank has been tightening at the same pace. Notably, the Bank of Japan and the People’s Bank of China – the central banks of the world’s third and second largest economies – have at times been adding liquidity even as the Fed and others tightened. In late 2022 and early 2023, this divergence was striking. The Bank of Japan was still conducting large-scale bond purchases to maintain its yield curve control policy (capping Japanese government bond yields), and the PBoC was injecting funds to support China’s economy which was recovering slowly from COVID lockdowns. These actions actually resulted in a temporary surge of global liquidity in the first quarter of 2023, despite Western tightening. Analysts estimated that around $1 trillion of liquidity was pumped into the global system over just a few months thanks to Japan and China. This helped global markets start 2023 on a strong note. In fact, the liquidity coming out of Japan was so large it outweighed the Fed’s QT during that period – one headline noted “BoJ QE is now greater than Fed QT,” as the BOJ’s bond buying exceeded the Fed’s reductions at the start of 2023. The net effect was that aggregate global liquidity flows turned positive briefly, which contributed to rallies in risk assets worldwide.
However, those anomalies didn’t last long. The Bank of Japan eventually adjusted its policy in mid-2023 (allowing interest rates to rise a bit) which slowed the pace of its interventions, and China’s injections have been more measured over time. By late 2023 and into 2024, the overall global liquidity trend was back to contraction. In other words, the major central banks are largely “in the same boat” again – all bailing out excess liquidity, albeit at different speeds. For a U.S. investor, this broad global tightening means there are fewer offsetting sources of easy money internationally. When the U.S. Fed drains liquidity, it’s not being fully counteracted by, say, Japan or Europe, as might have been the case in some isolated months. Thus, the worldwide financial system has generally less cushion than it did at the height of stimulus.
Impact on U.S. Markets and Economy
So, how is this liquidity squeeze affecting U.S. markets specifically? The impact can be seen in several principal ways:
Tighter Financial Conditions:
As liquidity is withdrawn, financial conditions in the U.S. have clearly tightened. “Financial conditions” here includes items like interest rates, credit availability and asset-prices. With Federal Reserve rate hikes and running down of its balance‐sheet (QT), borrowing costs have climbed, banks have grown more cautious in lending and risk-assets are under more strain. This is not simply theoretical: recent bank funding pressures and repo-market stresses reflect that the “money-surplus” regime of the prior decade is fading.
- Stock Market Dynamics:
The relationship between equity markets and liquidity is complicated. After the post-COVID stimulus surge, the withdrawal of easy money played a key part in the 2022 market draw-down. While 2023 saw a rebound—even as reserves fell—the rally was narrow and concentrated in big tech/AI names, suggesting underlying liquidity headwinds. Now in late 2024 and 2025, elevated volatility + “higher for longer” rates are forcing broader investor caution; companies that relied heavily on cheap financing are showing increased risk. - Valuations and Risk Appetite:
When risk‐free yields (such as Treasuries) rise from near-zero to ~4-5 %, the discount rate on future cash flows correspondingly increases. In other words: elevated rates act as a “valuation cap”. High-growth sectors that thrived in low-rate, high-liquidity eras are now under pressure. Speculative risk appetite has cooled—meme-stocks, crypto surges and ultra-low-quality financing are far less dominant. As liquidity tightens, quality, earnings and balance‐sheet strength matter more. - Dollar and Global Spillovers:
U.S. liquidity trends don’t stop at the border. A stronger dollar and tighter global dollar funding are direct consequences of U.S. policy, putting pressure on emerging markets, especially those with dollar-denominated debt. When global capital flows contract, multinational earnings, trade flows and investor risk tolerance all feel it. In many respects, the U.S. tightening cycle is a global tightening cycle.
Is an End in Sight for the Squeeze?
A key question: how long will this liquidity tightening run? Recent comments from Chair Jerome Powell and Fed publications suggest the process of shrinking the balance sheet may be nearing its limit While the Fed has not explicitly restarted large-scale asset purchases (i.e., full-blown QE), indicators show a potential pause or significant slowdown in the runoff. For example:
-
The Fed’s balance sheet liability side stood around $6.5 trillion as of October 8, 2025.
-
Liquidity measures such as usage of the Overnight Reverse Repo facility have fallen sharply.
-
Analysts now debate whether the Fed will stop QT and maintain a “new normal” balance sheet size, rather than resume large-scale accommodation.
In short: the worst of the drain may be behind us, but we are not yet in a broad liquidity expansion. It may be a transition from shrinkage → plateau rather than shrinkage → immediate growth.
Conclusion: Navigating the New Normal
The story of U.S. liquidity over the past few years is extraordinary—moving from a flood of ultra-cheap money to a regime of intentional withdrawal and heightened discipline. For U.S. markets, this means moving away from a world where cheap financing was taken for granted. Investors now have to lean more on fundamentals and less on the “rising tide” of easy money.
That said, this transition opens new opportunities: firms with real earnings, strong cash flows and resilience are better positioned. Conversely, companies that depended heavily on abundant liquidity may struggle. In many ways, we are now in the new normal, not the old normal. It’s less about whether liquidity returns, and more about when—and in what form.
Whether you’re a professional or an informed observer, recognizing this shift in liquidity regime is as important as tracking earnings, valuations or macro headlines. Because when the tide eventually turns—or stabilises—the market moves will follow.
Sources
- Reuters – “Global cenbank liquidity – from market headwind to tailwind?” (Dec 12, 2024) by Jamie McGeever.
- Reuters – “Fed's Powell says the end of balance sheet drawdown process may be nearing” (Oct 14, 2025) by Michael S. Derby.
- Econovis – “Global Money Supply Dynamics: Trends and Challenges” (Q3 2023) by Ehsan Soltani & Alireza Soltani.
- Goldman Sachs – “Why the US money supply is shrinking for the first time in 74 years” (Aug 28, 2023) – Goldman Sachs Research, Manuel Abecasis.
- Reuters – “Markets ride $1 trillion global liquidity wave” (Feb 14, 2023) by Jamie McGeever.
- Yardeni Research – “Monthly Balance Sheets – Total Assets of Major Central Banks & S&P 500” (Dec 28, 2023 report).
Data Links
What's Your Reaction?
 Like
0
Like
0
 Dislike
0
Dislike
0
 Love
0
Love
0
 Funny
0
Funny
0
 Wow
0
Wow
0
 Sad
0
Sad
0
 Angry
0
Angry
0

Founder of Pattern Nexus. I research markets, macro, geopolitics, AI, history, ancient systems, and the patterns most people overlook. I’m also building Market Radar, a trading scanner designed to read pressure, risk, confirmation, and setup quality before chasing a move. Pattern Nexus is where I connect the dots between data, history, technology, and the bigger system playing out around us.















Comments (0)