

The Million-Dollar Economy: When Everybody Has More Dollars but the Dollar Buys Less
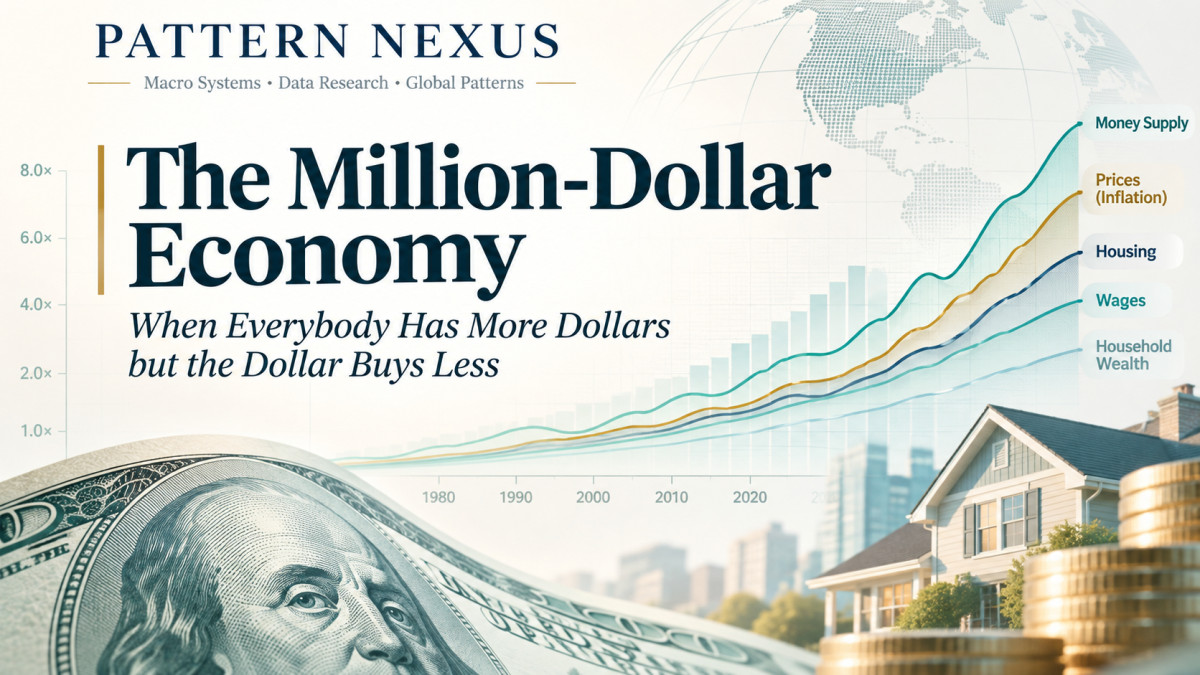
The U.S. money supply has expanded nearly fifteenfold since 1980, while consumer prices have quadrupled. Household wealth, wages, housing, and everyday expenses have followed very different trajector…
Jump to a section
PATTERN NEXUS • MACRO SYSTEMS • LONG-FORM RESEARCH
The Million-Dollar Economy: When Everybody Has More Dollars but the Dollar Buys Less
1980–2037 | Money Supply, Household Wealth, Wages, Housing, Everyday Prices, and the Next Nominal Threshold
By Christopher Grenke | Pattern Nexus | November 1, 2026 | Historical data through September 2026, 2025 SCF survey, and Q2 2026 household balance sheets
I've been trying to put a number on something that has been unfolding for generations. We keep crossing thresholds that used to represent extraordinary amounts of money. A million dollars was once a number most households could barely imagine. Today the average American family already has more than a million dollars in net worth, on paper. The typical family does not. Meanwhile, wages are larger, home prices are larger, grocery receipts are larger, the monetary aggregates are larger, and the amount of wealth represented by our financial system has expanded into the hundreds of trillions.
So what does a million dollars actually mean when the entire monetary denomination of the economy is expanding? Could a million dollars become as ordinary in 2037 as a six-figure house, a $10,000 salary, or a modest retirement account once looked to an earlier generation? And if those nominal figures keep rising, how much of that increase represents additional real purchasing power rather than more dollars assigned to the same limited resources?
I pulled the historical monetary, wage, household-balance-sheet, housing, and consumer-price data into the same model so we can follow the actual progression from 1980 through 2026. The interactive dashboard further down the page extends the arithmetic to 2037, with separate growth assumptions for consumer prices, median family wealth, and household income. The future figures are scenarios, not forecasts. [1–14]
Quick Read
- U.S. M2 expanded from about $1.57 trillion in September 1980 to $23.41 trillion in September 2026, an increase of roughly 14.9 times.
- Over the same September-to-September period, the CPI increased approximately 4.0 times. Money-stock growth and consumer inflation were not interchangeable.
- Federal Reserve household and nonprofit net worth rose from approximately $11.44 trillion in Q3 1980 to $195.87 trillion in Q2 2026, roughly 17.1 times.
- The 2025 Survey of Consumer Finances puts mean family net worth near $1.24 million but median family net worth at $215,900. The nominal millionaire average has already arrived; the median has not.
- To raise the median family net worth from approximately $216,000 in 2025 to $1 million in 2037 requires about 13.6% annual compound growth for twelve years. That's a demanding scenario, not a baseline assumption.
The Monetary Denominator Changes While the Numbers Look Familiar
Think about the way Americans talked about money forty or fifty years ago. Thousands described major personal expenditures. Tens of thousands described annual income or a house. Hundreds of thousands represented substantial wealth. A million dollars was a distant threshold. Now houses trade in the hundreds of thousands, retirement accounts can reach seven figures, companies regularly report multibillion-dollar investments, and government debt, financial-market capitalization, and household balance sheets are routinely measured in trillions.
The economy hasn't simply been doing more of the same transactions at bigger prices. The number of people, the amount of physical capital, technology, productivity, credit, property, financial claims, and financial infrastructure have all changed. Nominal denominations have increased because of a combination of economic growth, inflation, credit creation, asset repricing, saving, and changes in the financial system. The same dollar sign is being used to describe increasingly different economic objects.
That's the difficulty with talking about a future in which everyone is a millionaire. Do we mean one million dollars of annual wages? One million in bank deposits? One million of gross asset value? One million after liabilities have been subtracted? Or the average wealth of an economy divided across families? Each has its own historical record and its own required path to 2037.
A nominal threshold has two dimensions: how many dollars there are, and what those dollars command relative to actual goods, services, work, and productive assets. If the first moves much faster than the second, the headline number can become less remarkable without the population becoming proportionately richer.
From $1.57 Trillion to $23.41 Trillion in M2 — and $195.9 Trillion of Household Wealth
Start with the broad money stock. Federal Reserve M2 was approximately $1.574 trillion in September 1980. By September 2026 it reached approximately $23.414 trillion. That is an increase of 1,388%, or about 14.9 times its original level. During the same period the seasonally adjusted all-items Consumer Price Index increased from 83.9 to 336.298, roughly a fourfold increase. [1, 4]
Put all the series on a common 1980 baseline and that divergence is difficult to miss. In the chart, every line begins at 100. By 2026 the M2 line reaches about 1,488 while the general consumer-price line reaches about 401. New-home prices and wages occupy separate positions between those trajectories. This is not evidence that every extra dollar of M2 caused inflation. It is evidence that the broad quantity of money and the prices Americans pay are measuring very different things.
| Measure | 1980 | 2026 | Nominal multiple |
|---|---|---|---|
| M2 money stock | $1.574T | $23.414T | 14.9× |
| Household and nonprofit net worth | $11.44T (Q3) | $195.87T (Q2) | 17.1× |
| CPI-U, all items | 83.9 | 336.298 | 4.0× |
| Production/nonsupervisory hourly earnings | $6.95 | $32.60 | 4.7× |
| Median price of a new home sold | $64,900 | $393,300 | 6.1× |
Federal Reserve Financial Accounts offer another independent angle. Total net worth of households and nonprofit organizations rose from roughly $11.44 trillion in Q3 1980 to approximately $195.87 trillion by Q2 2026. The latter figure includes financial and nonfinancial assets less debt, and covers nonprofit organizations as well as households. The official release reports that this aggregate rose by $12.8 trillion in the second quarter of 2026 alone, with corporate-equity appreciation explaining most of the increase. That's the difference between a balance sheet and a cash register: a rise in the estimated market value of shares can expand aggregate net worth without someone printing $12.8 trillion of banknotes or transferring that sum into checking accounts. [2, 3]
In fact, the $195.9 trillion household-sector net-worth figure is more than eight times the size of M2. There's no contradiction. One series is the outstanding stock of selected liquid money claims; the other is an estimated net valuation of everything held on the household and nonprofit balance sheets after liabilities are deducted. They do not have to be equal, and they cannot be treated as though one can be divided into the other to produce an average account balance.
The Paycheck Keeps Getting Bigger. The Question Is What the Paycheck Buys.
Average hourly earnings among production and nonsupervisory employees in the private sector rose from $6.95 in September 1980 to $32.60 in September 2026. That's a 4.7-fold nominal increase across forty-six years. General consumer prices increased about fourfold over the same dates, meaning this particular wage measure gained some purchasing power against the overall CPI basket over the full period. It does not follow that every worker or every generation has become better off by the same margin. Occupation, age, education, housing tenure, region, working hours, health costs, taxes, and ownership of assets all change the actual household result. [4, 5]
And an hourly earnings average isn't the same statistic as household income. A household might have one worker or multiple workers. It may receive transfer payments, business income, dividends, or rent. Some adults work part-time. Earnings reflect people employed in a defined payroll segment; median household income reflects a household income distribution. I don't want to mix them into one invented 'average wage' simply because both end in a dollar sign.
The latest Census figure puts median household income at $87,460 in 2025. That's a large nominal number compared with prior generations, yet the correct test for living standards is how it relates to the goods, services, housing, debt payments, and financial security those dollars can sustain. A rising income figure can coexist with pressure in shelter, insurance, vehicle costs, and interest expense. [10, 11]
For the historical comparison, an hourly wage gives us a useful unit that doesn't change its definition halfway through the page: how many minutes of work are needed to buy one item? This does not solve every distribution problem, but it stops the argument from relying on price tags in isolation.
Milk, Gasoline, Bread, and Homes: The Unit-of-Labor Comparison
Start with a loaf of white bread. The BLS average was 51.1 cents per pound in September 1980. In September 2026 it was about $1.83. That's roughly 3.6 times the old price. A gallon of gasoline averaged about $1.26 in September 1980, versus roughly $4.48 in September 2026, also around 3.6 times as much. Whole milk is a different data problem: the continuous gallon series begins in 1995, when it stood near $2.46 in September. By September 2026 it was $4.11. I do not assign a fabricated 1980 gallon price to a series that wasn't collected consistently in that unit. [6–8]
Now compare the labor required. Bread cost roughly 4.4 minutes of the measured hourly pay in 1980, compared with 3.4 minutes in 2026. Gasoline required about 10.9 minutes of hourly pay for a gallon in 1980, compared with 8.2 minutes in 2026. Those particular goods became less expensive relative to that selected wage measure over the full interval despite higher sticker prices. This is exactly why nominal comparisons and real comparisons must be plotted together.
Housing tells a different story. Median new-house sale prices rose from about $64,900 in Q3 1980 to $393,300 in Q3 2026. Dividing those sale prices by the same earnings series gives an illustrative 9,338 working hours in 1980 versus roughly 12,064 hours in 2026. That's approximately 29% more labor hours at the selected hourly wage. Those aren't mortgage-payment affordability ratios and the homes sold are not identical in size, location, or quality. But it identifies an important difference: the median new-home price increased more rapidly than this wage series. [5, 9]
| Item | 1980 / first comparable observation | September 2026 | Labor needed, first → latest |
|---|---|---|---|
| White bread, one pound | $0.51 (1980) | $1.83 | 4.4 min → 3.4 min |
| Regular gasoline, one gallon | $1.26 (1980) | $4.48 | 10.9 min → 8.2 min |
| Newly sold house, median | $64,900 (Q3 1980) | $393,300 (Q3 2026) | 9,338 hr → 12,064 hr |
| Whole milk, one gallon | $2.46 (September 1995) | $4.11 | Not directly comparable without matching 1995 pay |
Retail price data are not constant-quality price indexes. Package composition, store selection, geography, product attributes, and purchasing habits change over long periods, which is why the BLS recommends category price indexes for rigorous changes in retail purchasing power. The average-price observations here are deliberately tangible examples rather than a substitute for a full inflation index.
The $10,000 Question: What Would It Take to Become $1 Million?
One way to describe the future is to say that $1 million in 2037 might feel like $10,000 did in 1980. That comparison captures a psychological change in the size of nominal numbers, but the CPI arithmetic shows it cannot be interpreted literally as equal purchasing power.
Take a basket of goods and services priced at $10,000 in September 1980. At the September 2026 seasonally adjusted CPI, an equivalent general basket would cost approximately $40,100. If the price level then rose 2.5% annually for eleven more years, that basket would cost around $52,600 in 2037. To get $10,000 in 1980 to the equivalent of $1 million in 2037 would require a 100-fold increase in the general price level across fifty-seven years, around 8.4% annual compound inflation over the entire period. That is dramatically faster than the observed price-level growth from 1980 to 2026 and far above the baseline future CPI scenario. [4]
Where the million-dollar framing becomes useful is not consumer inflation alone. It's the expanding nominal scale of assets and balance sheets. A family might own a home with a seven-figure market value and have relatively little spendable income. A pension claim or stock position can appreciate far beyond the cost of groceries. A large headline asset valuation can also be offset by debt. All three realities can exist at the same time.
Therefore, I separate nominal income, net worth, cash balances, asset prices, aggregate money, and real purchasing power. Without that separation, you can force any conclusion you want from the same set of dollar amounts.
The Average American Family Is Already a Millionaire on Paper
Here's where the hypothesis becomes very real. The Federal Reserve released its 2025 Survey of Consumer Finances on October 9, 2026. Mean family net worth reached approximately $1.24 million. Median family net worth was $215,900. The arithmetic mean is sensitive to households at the very top: extraordinarily wealthy families pull the average upward even though the middle family owns much less. The mean was roughly 5.7 times the median. [12, 13]
Mean net worth is assets minus debt, not $1.24 million in a bank account. It can include a residence, retirement savings, a business, investment holdings, and other property. Some families have large asset positions and modest liquid reserves. Others have significant wages but relatively little wealth accumulated. That makes the concept of 'everyone has a million dollars' surprisingly easy to misread.
Historical SCF-based nominal tabulations show average net worth around $189,000 in 1989 and about $1.23 million in 2025, with the median moving from roughly $47,000 to $216,000. That's a substantial nominal repricing across generations, but most households did not receive the same share of the increase. The rise in asset valuations disproportionately rewards existing ownership. The family that bought a house or accumulated equities decades ago participated in the repricing. A younger family buying in later confronts those prices as an entry cost. [13, 14]
The situation is even more interesting when the broader Federal Reserve household-balance-sheet series is considered. As of Q2 2026, nearly $196 trillion of net worth was allocated to the household and nonprofit sector, yet the typical family held a fraction of the average. Aggregate wealth expands at one rate, the mean responds to the entire distribution, and the median traces the midpoint family. One large rise in aggregate asset values does not guarantee a comparable rise in median wealth.
Pattern Nexus Interactive Dashboard: 1980–2037
The live model below puts the historical monetary stock, consumer-price level, selected wages, new-house prices, bread, and household wealth on comparable charts. It also lets you adjust consumer inflation, median family net-worth growth, and median household-income growth independently. The historical observations stop at the latest official series dates; everything beyond that point is compound-growth arithmetic. Change a slider and the model recalculates immediately. The entire dashboard is self-contained and does not send personal data or require an external charting service.
Data cut: November 1, 2026. Monthly observations from September 2026; new-home prices through Q3 2026; household and nonprofit balance sheets through Q2 2026; median household income and Survey of Consumer Finances from 2025. The illustrated 2037 outcomes are conditional scenarios, not estimates of likely returns.
2037: Three Different Paths to a Million-Dollar Economy
Now take the future seriously without assuming the answer. The 2037 date is eleven years after 2026, but twelve years after the 2025 family-wealth and household-income survey baselines. That one-year difference matters when compounding. Rather than use an unexplained 'million-dollar economy' projection, the model asks what annual growth rate is actually necessary for each outcome.
Path A — Nominal prices and wages rise; median wealth is still below $1 million
At 2.5% annual consumer inflation from the 2026 baseline, a $4.11 gallon of whole milk would arithmetically become about $5.39 in 2037. A $32.60 hourly wage growing at 3% annually becomes about $45.13. A median family net worth of $215,900 growing 3% annually from the 2025 survey becomes approximately $308,000 in 2037. The dollar figures are all larger, but the typical family is nowhere near the million-dollar threshold.
Path B — Asset valuations compound faster than paychecks
At 8% nominal median net-worth growth annually from 2025 to 2037, the median rises to roughly $544,000. That's a very large nominal increase in family wealth, yet still just over halfway to the seven-figure mark. At 5% annual growth in median household income, the 2025 Census baseline of $87,460 becomes approximately $157,000 by 2037. These two assumptions describe different economic channels; the model does not silently force wages to appreciate at the same rate as houses and investment portfolios.
Path C — The median family reaches $1 million
To move the median from roughly $215,900 in 2025 to $1 million by 2037 would require about 13.6% nominal annual compound growth for twelve consecutive years. Alternatively, to make median annual household income reach $1 million from $87,460 over the same period would require about 22.5% annual compound growth. Those are radically different propositions. The first is an aggressive asset-balance-sheet scenario; the second would be an extraordinary long-run income transformation. Neither follows merely because M2 has expanded over the last forty-six years.
| Metric | Latest observed baseline | Assumption | 2037 scenario |
|---|---|---|---|
| 1980 $10k purchasing-power equivalent | $40,100 (2026 CPI) | 2.5% CPI annually (11 yr) | ~$52,600 |
| Whole milk per gallon | $4.11 (2026) | 2.5% annually (11 yr) | ~$5.39 |
| Hourly earnings measure | $32.60 (2026) | 3% annually (11 yr) | ~$45.13 |
| Median household income | $87,460 (2025) | 5% annually (12 yr) | ~$157,100 |
| Median family net worth | $215,900 (2025) | 8% annually (12 yr) | ~$543,700 |
| Median family net worth | $215,900 (2025) | 13.6% annually (12 yr) | ~$1,000,000 |
| M2 money stock | $23.41T (2026) | 5% annually (11 yr) | ~$40.0T |
The percentage values above are mechanically applied to separate variables; they are not a joint forecast. In a real economy the paths would interact. A sustained inflation shock could change wage bargaining, asset discount rates, debt service, credit demand, and policy responses. A productivity shock could expand real output without comparable consumer inflation. A credit contraction could pull asset values down even while M2 remains historically large. These are not interchangeable outcomes.
How the Dollar System Expands Without Everything Rising Together
Modern money is mostly recorded as claims on balance sheets. When a commercial bank makes a new loan and credits the borrower's deposit account, it generally creates a deposit matched by a loan asset. That deposit can then move through payments, settlement, and financial markets. The banking system also destroys deposit money when loans are repaid. Central-bank operations, bank reserve supply, Treasury issuance, fiscal spending, nonbank financial transactions, and the public's portfolio preferences can all change the composition or quantity of monetary aggregates. M2 is only one window into that architecture.
The consequences do not arrive uniformly. New credit used to purchase existing property can push up asset valuations more directly than it expands the supply of physical houses. Fiscal transfers can support household spending. A technology-driven productivity improvement can increase output and reduce unit production costs. An oil disruption can raise prices even without broad monetary acceleration. Investors can reprice equities because expected future earnings change, not because households suddenly have additional checking-account balances.
That is why money stock and household net worth can expand at very different rates from wages and groceries. The same dollar may circulate through many transactions during the year, but financial-asset valuations represent capitalized expectations and claims on future cash flows, not a count of dollars stored somewhere. Liquidity conditions matter. Collateral values matter. Interest rates and discount rates matter. Ownership concentration matters. None of those mechanisms guarantees that M2 growth translates proportionately into CPI inflation.
Our monetary language tends to compress those distinctions into the word 'money.' That makes the world look as though it is becoming richer because the numbers attached to it are getting larger. In reality, a higher nominal valuation can represent genuine capital accumulation, inflation, changing expected returns, scarcity, leverage, or some combination of all five. To understand 2037, we have to observe which combination is dominating.
PN Lens: Follow the Denominators, Not the Milestones
The economy has been moving into larger nominal denominations for decades. Our aggregate financial balances and asset valuations can continue doing so. Whether the median family becomes a millionaire in the next eleven years is a separate empirical claim, with a much steeper required growth path than the headline average suggests.
I would follow five measures together: (1) the growth of M2 and broader credit; (2) household-sector net worth in the Z.1 accounts; (3) the mean-to-median family net-worth ratio; (4) real wages and median income, not just nominal paychecks; and (5) the cost of a home or a basket of goods in hours of work. One number rising does not tell you whether the population is accumulating purchasing power.
If asset values rise sharply while wages and median wealth lag, the aggregate economy becomes wealthier on paper but access to ownership can deteriorate. If wages and productivity rise faster than household costs, the same expansion of nominal dollar figures can accompany real progress. If money grows, asset markets rise, and CPI remains comparatively subdued, the distributional effect can be substantial even before broad consumer inflation catches up.
So the million-dollar economy is already here in one very specific statistical sense: average family net worth has crossed seven figures. Extending that threshold to the median by 2037 is possible as an arithmetic scenario, but it requires exceptional sustained nominal growth and would not automatically mean a comparable improvement in living standards. The real question isn't whether we'll use larger numbers. It's who will own the assets behind those numbers, how much work will be required to buy into them, and what proportion of the expansion will survive after purchasing power is accounted for.
FAQ
Does the average American already have a million dollars?
The 2025 Federal Reserve Survey of Consumer Finances reports mean family net worth around $1.24 million. The median is about $216,000. Averages are pulled up by high-wealth families. Net worth includes assets less debt; it is not spendable cash.
Does a 15-fold expansion in M2 imply prices should be 15 times higher?
No. M2 measures selected liquid monetary claims. Prices respond to demand, production, expectations, credit, velocity, imports, supply constraints, financial conditions, and the mix of activity. The CPI increased about fourfold across the September 1980–September 2026 comparison.
What is the inflation-adjusted value of $10,000 from 1980?
Approximately $40,100 in September 2026 using the seasonally adjusted CPI series. With hypothetical 2.5% annual inflation through 2037, that is approximately $52,600. It's not $1 million.
What annual growth is needed for median wealth to reach $1 million by 2037?
About 13.6% compounded annually from the 2025 median-family net-worth baseline. This is a threshold calculation, not an estimate of its likelihood.
Why use average retail prices and a CPI index in the same analysis?
The BLS item prices show tangible dollar amounts readers recognize. CPI is more suitable for measuring the changing cost of a broad, quality-adjusted consumption basket. Both are useful, but they answer different questions.
Does the interactive model update automatically with new government releases?
No. This first edition is a fixed, documented historical snapshot as of November 1, 2026. Slider adjustments update the 2037 arithmetic in the browser; new official observations require an intentional data refresh.
Sources and Methods
The linked primary record is consolidated here so the main article remains readable. Data are rounded for discussion; the dashboard retains the selected survey and source observations. The historical graphics use September observations for monthly series, Q3 readings for newly sold homes, annual observations for household income, and SCF survey years for family net worth. Household and nonprofit aggregate net worth is reported quarterly and its 2026 endpoint is Q2. Historical net-worth lines use SCF-based nominal tabulations, whereas the official 2025 release is used to corroborate the survey endpoint. All 2037 values are explicitly conditional.
- Federal Reserve, H.6 M2 money stock (M2SL)
- Federal Reserve, Z.1 household and nonprofit net-worth balance sheet, Q3 1980–Q2 2026
- Federal Reserve, Z.1 Q2 2026 recent developments
- BLS CPI-U, seasonally adjusted (CPIAUCSL)
- BLS average hourly earnings, production and nonsupervisory private employees (AHETPI)
- BLS white bread price (APU0000702111)
- BLS gasoline price (APU000074714)
- BLS whole milk gallon price (APU0000709112)
- Census/HUD median new-house sales price (MSPUS)
- Census median household income (MEHOINUSA646N)
- U.S. Census, Income in the United States: 2025
- Federal Reserve 2025 Survey of Consumer Finances release, October 9, 2026
- Federal Reserve SCF historical tables and methodology
- DQYDJ tabulations of nominal SCF mean and median net worth, 1989–2025
- Pattern Nexus archive: Everything Bubble III, markets priced in gold
Article overview
The U.S. money supply has expanded nearly fifteenfold since 1980, while consumer prices have quadrupled. Household wealth, wages, housing, and everyday expenses have followed very different trajectories. Using historical Federal Reserve, BLS, and Census data, I examine the expansion of nominal wealth and purchasing power, with an interactive dashboard modeling possible outcomes through 2037.
What's Your Reaction?
 Like
0
 Dislike
0
 Love
0
 Funny
0
 Wow
0
 Sad
0
 Angry
0

Nexus (Christopher)
Founder of Pattern Nexus. I research markets, macro, geopolitics, AI, history, ancient systems, and the patterns most people overlook. I’m also building Market Radar, a trading scanner designed to read pressure, risk, confirmation, and setup quality before ch…
Related research

The Polar Vortex Is Approaching a November Record: From September Extremes to an Early Reversal Forecast
Five September wind records have given way to an exceptionally weak Arctic circulation. PN checks 47 NASA autumns, the 1952 and 1968 warmin…
3 shared topics, 1 shared asset, same research avenue.
The Diesel Trap: Why the Oil War Is Bending Sanctions Before Winter
The October Russia-sanctions waiver adds a new policy chapter to the Pattern Nexus oil-war thesis. I connect the diesel bottleneck to emerg…
5 shared topics.
The World I’ve Been Mapping Is Taking Shape
I connect the developments now taking shape across AI infrastructure, private power, critical minerals, the Iran energy shock, digital doll…
3 shared topics, 2 shared assets.
Housing in 2026: Prices Are High, but the Market Is Barely Moving
The July Case-Shiller index reached another nominal high, but inflation, financing costs and weak sales tell a different story for the marg…
3 shared topics, 2 shared assets.
The QE Decade — Audio-Video Edition
Episode 8 of the weekly Pattern Nexus audio-video series turns Part 8 of Cycles of Power into a shorter story about how quantitative easing…
4 shared topics, 2 shared assets.
The Real Reason They Are Building Humanoid Robots: The End of Human Labor as the Foundation of the Economy
Humanoid robotics is not simply about building machines that walk, talk, and perform household chores. It is about creating a scalable phys…
5 shared topics.
The Housing Collateral Engine — Audio-Video Edition
Episode 7 of the weekly Pattern Nexus audio-video series turns Part 7 of Cycles of Power into a shorter story about how China's WTO entry, …
4 shared topics, 3 shared assets.
The Asian Liquidity Supercycle — Audio-Video Edition
Episode 6 of the weekly Pattern Nexus audio-video series turns Part 6 of Cycles of Power into a shorter story about how liberalized capital…
3 shared topics, 2 shared assets.
Comments (0)
Security Check
Please complete the captcha to verify you are human.