
Feb 18, 2026 Tape: AI Bid, Oil Risk Premium
The Feb 18 tape was clean: tech/AI led equities higher, VIX bled, oil carried a visible geopolitical risk premium, and the UST curve steepened. Here’s the mechanical read-through and the world-news drivers.
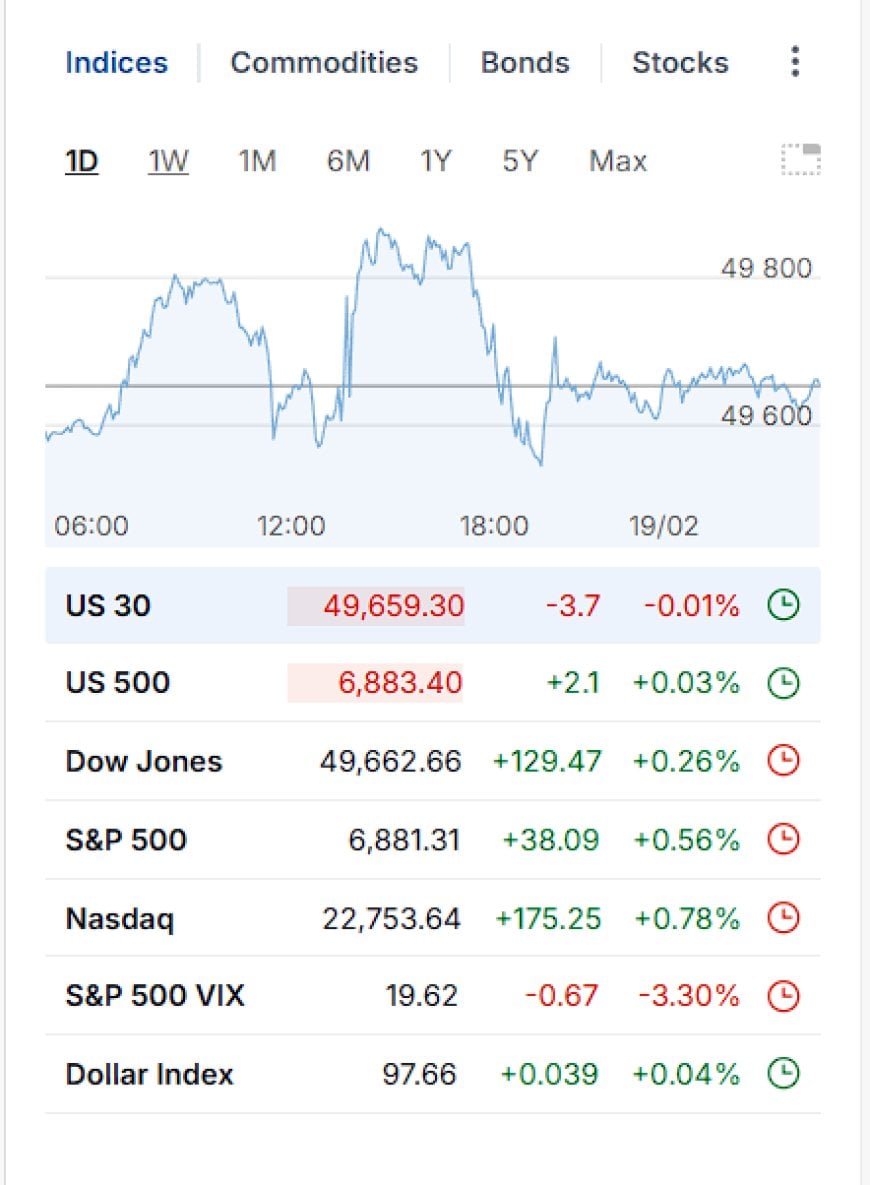


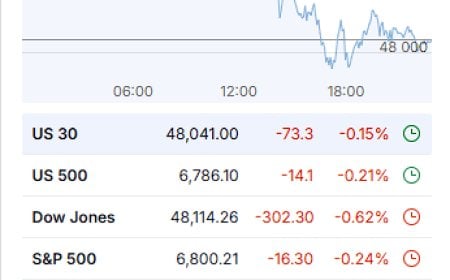
The Feb 18 tape was mechanically clean: U.S. equities finished green on AI/mega-cap leadership while volatility relaxed. Snapshot levels (captured at time of screenshot): S&P 500 +0.56% to ~6,881; Nasdaq +0.78% to ~22,754; Dow +0.26% to ~49,663; VIX ~19.62 (-3.30%); DXY ~97.66 (flat-to-up).
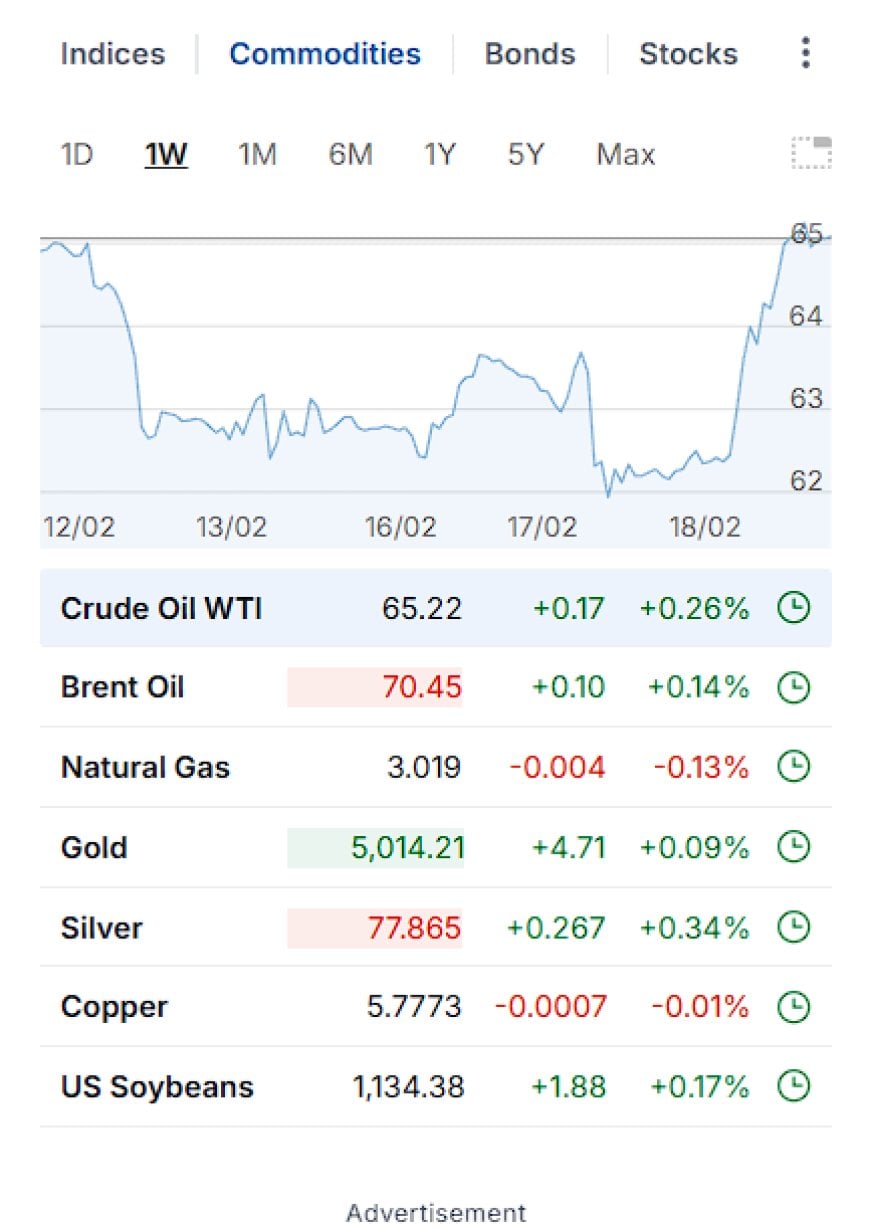
Crude traded like an insurance contract. WTI ~65.22 and Brent ~70.45 held a visible risk premium tied to U.S.–Iran escalation probabilities and chokepoint math (Hormuz). Energy leadership inside equities was the cross-asset tell.
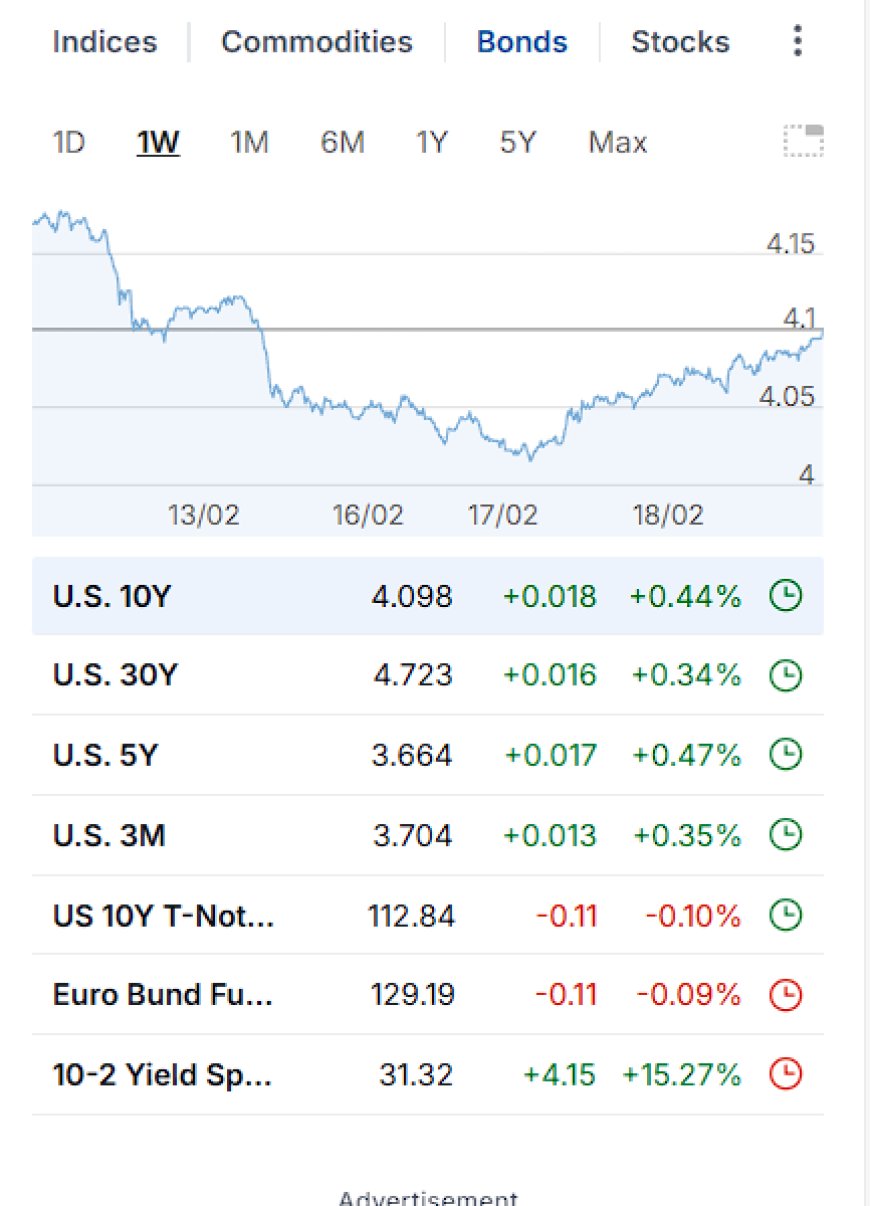
Rates moved higher across the curve with the 10Y around ~4.10%. Macro prints supported the “still-growing” frame: industrial production rose in January, and housing starts improved in the latest construction report.
Globally, Europe stayed risk-on (record STOXX 600 close) even as geopolitics stayed loud. FX had its own political-vol impulse: headlines about possible ECB leadership change stirred euro narrative risk. This is “politics prices the premium” in real time: headlines are narrative, but commodities, vol, and the curve are the truth serum.
The Tape in One Screen: Indices, VIX, Dollar
Before narrative, anchor to prints. The dashboard snapshot (timestamp-dependent, but internally consistent) shows: Dow ~49,662 (+0.26%), S&P ~6,881 (+0.56%), Nasdaq ~22,754 (+0.78%), VIX ~19.62 (-3.30%), DXY ~97.66 (flat-to-up). That’s “risk-on with controlled fear,” not “panic,” not “mania.”
Global Risk Map: Europe Records, Asia Follow-Through
The global tape confirmed the U.S. message: Europe stayed risk-on with a record STOXX 600 close, and defense-linked names remained firm, reflecting “war-duration realism” despite peace-talk optics. Asia followed the AI lead in subsequent sessions, but the commodity layer kept the geopolitical premium visible in the background.
The important point isn’t “who was up.” It’s that the market continued to separate: (1) growth-exposed equity leadership (AI) from (2) security/energy constraints (oil premium) from (3) policy credibility (rates/FX). That separation can persist until one constraint forces a repricing across the whole stack.
AI Bid: Why Tech Led and Volatility Fell
The proximate driver was AI leadership. Nvidia strength and adjacent AI complex follow-through pushed the major indices while the volatility bid softened. The deeper driver is index structure: mega-cap liquidity pulls the tape because passive flows follow market cap.
This is also why cross-asset confirmation matters. If AI leads while crude firms and yields rise, the market is effectively saying: “growth optimism now, inflation/geopolitics later.” The “later” is where regime shifts happen.
Vol & Positioning: What “VIX Down” Actually Means
VIX falling is not a moral judgment. It’s an insurance price. A down-VIX day says the market is pricing fewer near-term tail events or is willing to sell protection because realized volatility has been manageable.
- Benign regime: equities grind up, VIX bleeds, credit spreads stable, oil stable-to-soft.
- Premium regime: equities green, VIX down modestly, oil firm on headlines, rates edge up (term premium).
- Stress regime: VIX up even if equities flat, credit spreads widen, dollar strengthens, oil spikes or collapses depending on shock.
Oil Risk Premium: Hormuz Math, OPEC+, and “Insurance Pricing”
Oil was the geopolitical translator. Crude moved higher as traders weighed U.S.–Iran escalation risk and the convexity of chokepoints. Some market commentary explicitly described a multi-dollar risk premium embedded in the curve.
Add the supply-management layer: OPEC+ posture and compliance determine how much slack exists if a shock hits. When slack is thin, the premium becomes more sensitive. When slack is ample, the premium can fade quickly on de-escalation headlines.
Hard Assets: Gold/Silver Bid Inside a Green Tape
Metals holding up while equities are green tells you hedging demand hasn’t fully left the building. Gold firming with oil firm is often “uncertainty hedging” more than “inflation breakout.” Silver’s bid can reflect its hybrid nature: industrial optionality + monetary hedge.
- Gold: geopolitical hedge, real-rate sensitivity, and “system credibility” barometer.
- Silver: tracks both risk-on manufacturing narratives and risk-off monetary hedging.
- Copper: growth proxy; if copper lags while AI leads, the “real economy” is not confirming the equity story yet.
Rates + Macro: Steepening, Term Premium, and the Data Prints
Our bond dashboard shows yields higher across the curve (10Y ~4.10%, 30Y ~4.72%, 5Y ~3.66%), with the 10–2 spread widening to ~31 bps. The interpretive framework stays stable: identify whether the move is (a) growth optimism, (b) term premium / uncertainty, or (c) policy-path repricing.
crude ↑ → inflation expectations / uncertainty ↑
uncertainty ↑ → term premium pressure ↑ → long-end yields ↑
long-end ↑ with stable front-end → curve steepening (or de-inversion)
Now layer in the macro prints that keep the economy in “still functioning” mode:
- Industrial Production (Jan): production rose, manufacturing output improved, and capacity utilization ticked up (Fed release).
- Housing (New Residential Construction): housing starts improved to ~1.404M (SAAR) with permits ~1.448M (Census report).
Translation: the macro backdrop did not force risk-off today. So the market defaulted to the leadership it trusts (AI mega-caps) while pricing geopolitical uncertainty in the most efficient place (oil + term premium).
FX: DXY Flat, Euro Political Vol, and the “Policy Credibility” Layer
The dollar was quiet in the snapshot (DXY ~97.66), but FX narrative risk rose in Europe on headlines about potential ECB leadership change. FX cares about “policy credibility,” not gossip. But leadership uncertainty can still widen the distribution because it changes the market’s confidence about reaction functions.
Practical: if DXY is flat but long-end yields rise, financial conditions can still tighten. The tape can stay green for a while, then suddenly reprices when conditions cross a threshold.
World News Stack: The Market-Relevant Geopolitics (All Theaters)
“All world news” is infinite, so here’s the market-relevant stack: the set of stories that map directly into energy, sanctions, FX, defense posture, trade lanes, and policy credibility.
- Middle East / Iran: nuclear talks optics vs escalation language kept the crude premium alive; satellite imagery and security narratives stayed in focus.
- Russia–Ukraine: Geneva talks ended without breakthrough; “peace premium” remained fragile, defense posture stayed structurally bid in Europe.
- Europe policy credibility: ECB leadership headlines injected FX narrative risk even as equity indices stayed risk-on.
- Western Hemisphere leverage: U.S. security engagement with Venezuela matters because sanctions, oil flows, and migration/security form one linked constraint set.
- Middle East posture: U.S. troop movement headlines (Syria) add signal noise to regional balance expectations.
- US–China optics: reassurance signaling helps volatility at the margin, but trade/tech rivalry remains the structural regime.
- Trade alignment: Europe’s “strategic partnership” language toward China under tariff pressure is a major long-cycle signal for supply-chain control.
Micro Tape: ATOM Options as a Volatility Case Study
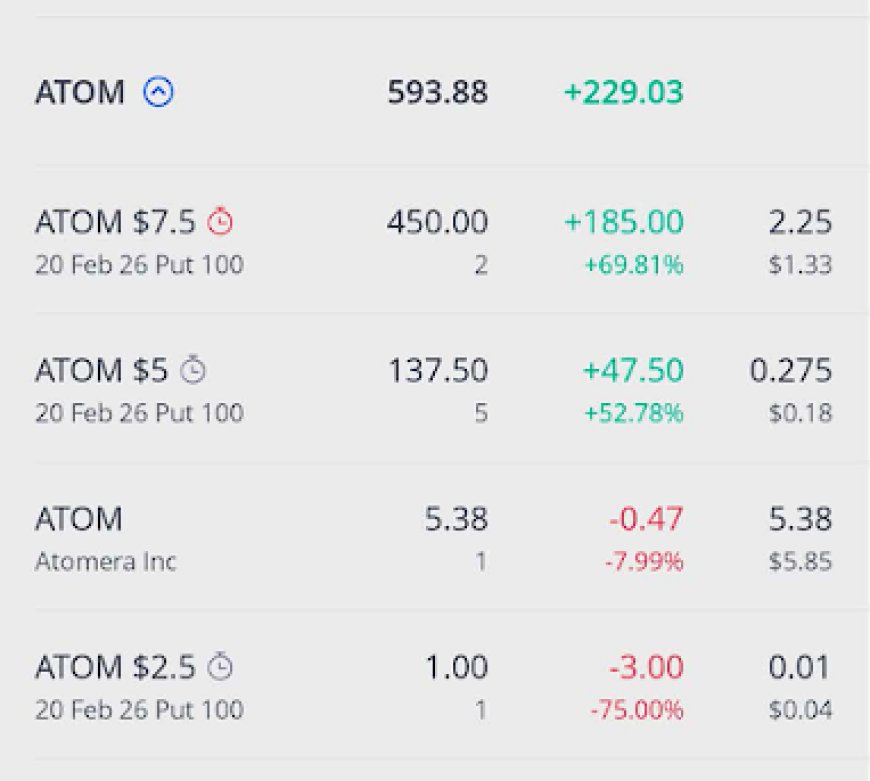
Our ATOM snapshot is a clean micro demonstration: the underlying was down ~8% (around 5.38), while near-dated puts marked sharply higher. That’s convexity doing what it’s designed to do: small-ish underlying moves can translate into outsized option P&L when time, strike, and volatility align.
- Directional layer: underlying down helps puts, hurts calls.
- Vol layer: if IV rises during the move, puts can gain even more (even without further underlying decline).
- Time layer: near expiry, gamma increases and P&L becomes more convex; small price moves matter more.
- Liquidity layer: thin names widen spreads; marks can swing; exits become execution problems, not “analysis problems.”
Scenario Tree + Next Catalysts (What Markets Will Reprice)
Markets rarely move on “today.” They move on what today implies about the next constraint set. After Feb 18, the constraint set is: policy path + inflation sensitivity + geopolitics.
- Containment holds: oil premium bleeds, VIX stays heavy, AI leadership continues, curve stabilizes.
- Premium widens: oil rises with headlines, term premium rises, curve steepens further, equities stay green until conditions tighten.
- Shock risk: VIX bids up with crude, dollar firms, credit spreads widen, equity leadership breaks.
Pattern Nexus Lens
FAQ
Sources
- Reuters (Feb 18, 2026): Wall Street ends higher, lifted by Nvidia and other AI stocks
- MarketWatch (Feb 18, 2026): Crude-oil futures rise on U.S.-Iran tensions
- Barron’s (Feb 18, 2026): Oil prices rise; U.S. warns military action remains an option
- Reuters (Feb 18, 2026): Lagarde’s possible early ECB exit leaves investors pondering replacements
- Reuters (Feb 18, 2026): Ukraine dissatisfied with talks; U.S. sees meaningful progress
- Reuters (Feb 18, 2026): STOXX 600 closes at record high; defense stocks gain; ECB focus
- Reuters (Feb 18, 2026): Satellite images show Iran repairing and fortifying sites amid U.S. tensions
- Reuters (Feb 18, 2026): Top U.S. commander makes surprise visit to Venezuela for security talks
- Reuters (Feb 18, 2026): Some U.S. troops departing Syria, official says
- Reuters (Feb 18, 2026): Xi offers reassurance over Sino-American exchanges
- Reuters (Feb 16, 2026): Taiwan parliament to tackle defence spending review
- Federal Reserve: Industrial Production and Capacity Utilization (G.17)
- U.S. Census Bureau: New Residential Construction (report PDF)
- U.S. Treasury: Daily Treasury Yield Curve Rates (Feb 2026)
- Reuters (Feb 18, 2026): Global Payments shares surge on results/forecast
- WSJ Live Coverage (Feb 18, 2026): Stock Market Today
Care este reacția ta?
 Îmi place
0
Îmi place
0
 Dezaprobat
0
Dezaprobat
0
 Iubire
0
Iubire
0
 Amuzant
0
Amuzant
0
 Wow
0
Wow
0
 Tristețe
0
Tristețe
0
 Înfuriați
0
Înfuriați
0

Founder of Pattern Nexus. I research markets, macro, geopolitics, AI, history, ancient systems, and the patterns most people overlook. I’m also building Market Radar, a trading scanner designed to read pressure, risk, confirmation, and setup quality before chasing a move. Pattern Nexus is where I connect the dots between data, history, technology, and the bigger system playing out around us.












Comentarii (0)