
Jobs on Pause: September 2025’s Delayed Report and the Great Employment Plateau
The delayed September 2025 jobs report shows 119k new jobs, 4.4% unemployment, and a labor market stuck in neutral—revealing the start of America’s Great Employment Plateau.
Jobs on Pause: September 2025’s Delayed Report and the Great Employment Plateau
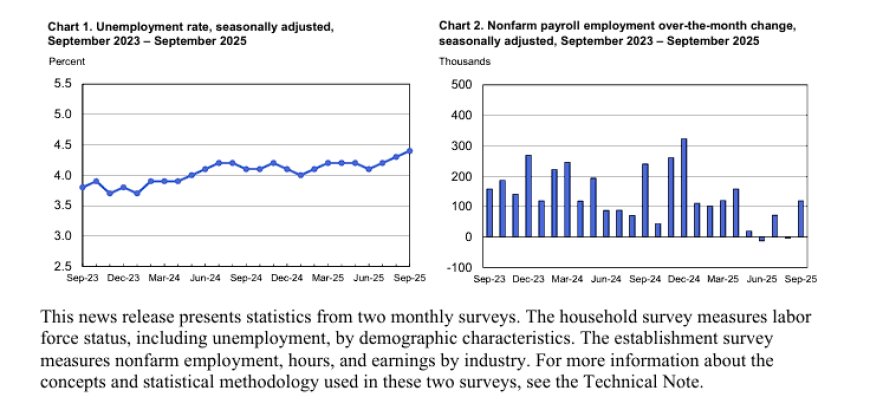
The official jobs report finally dropped after the shutdown: 119,000 new jobs, 4.4% unemployment, and a labor market that looks less like a boom or a bust and more like a system stuck in neutral.
What the September Jobs Report Actually Says
After a record government shutdown, the Bureau of Labor Statistics finally released the Employment Situation — September 2025. The topline numbers are simple enough: total nonfarm payrolls rose by 119,000 jobs, the unemployment rate “changed little” at 4.4%, and BLS explicitly notes that total employment has shown “little change since April”.
⚙️ The jobs machine is still running — but it’s idling. Since April, total payroll employment is barely moving in net terms.
On the household side, the number of unemployed people sits around 7.6 million, up from 6.9 million a year earlier. The unemployment rate has climbed from 4.1% to 4.4% over that same period. Long-term unemployed (jobless 27 weeks or more) are roughly 1.8 million, about 23.6% of all unemployed. Labor force participation is stuck at 62.4%, basically unchanged on the year.
In other words: the job market isn’t collapsing, but it’s not tightening anymore either. It’s drifting sideways.
The Signals Behind the Headline Numbers
It’s easy to look at +119k jobs and say, “See? The labor market is fine.” But when we step back and put this print into the broader pattern, a different story emerges: we’re in a late-cycle “no hire, more fire” phase, not a fresh expansion.
First, BLS revised prior months down. July was cut by 7,000 jobs, August was revised from +22,000 to –4,000. When you blend the revisions with September’s gain, payrolls have been effectively flat since April 2025.
Second, this release is a data patch, not a normal datapoint. Because of the shutdown, BLS explicitly notes that October’s Employment Situation report will not be published on its own. October establishment data will be folded into the November release, and the household survey wasn’t even collected for October. We’re flying with one eye closed.
🧩 Key pattern: Revisions are negative, momentum is flat, and the data pipeline itself is glitching. That’s what late-cycle looks like in an over-levered, policy-managed system.
Third, this jobs print is landing in a macro environment where headline inflation is still running at roughly 3.0% year-over-year, while average hourly earnings are growing at 3.8% year-over-year. That spread looks comforting on paper, but once you account for higher interest costs, insurance, taxes, and structural housing scarcity, the median worker doesn’t feel “ahead” in any meaningful way.
Where the Jobs Really Are (and Aren’t)
The most important part of this report is not the total number of jobs — it’s the composition of those jobs.
In September 2025, BLS highlights four big moves on the establishment side:
- Health care added +43,000 jobs (roughly in line with its 12-month trend).
- Food services & drinking places added +37,000 jobs.
- Social assistance added +14,000 jobs, with individual and family services alone adding +20,000.
- Transportation & warehousing lost –25,000 jobs, with warehousing at –11,000 and couriers & messengers at –7,000.
- Federal government employment fell another –3,000 and is down about 97,000 since January.

 Figure 3: Snapshot of net job changes by major industry, September 2025. Almost all net gains are in care, food, and safety-net services; logistics and federal employment shrink.
Everyone likes to talk about “the labor market” as a single thing. But this breakdown shows we’re really running two labor markets:
- A services + state-adjacent economy that keeps adding jobs tied to health, food, social programs, and local demand.
- A physical + logistics + federal stack that is either shrinking or treading water as efficiency, automation, and budget pressures bite.
🧵 This is exactly what you expect late in an AI-heavy, capital-intensive cycle: the physical throughput of the economy keeps rising, but the headcount required to move atoms and data grows much more slowly.
The rest of the major industries — mining, construction, manufacturing, wholesale trade, retail, financial activities, professional and business services — show “little or no change” in this release. That’s code for plateau.
Wages, Inflation, and Why Workers Still Feel Broke
On paper, this is the part of the report that’s supposed to reassure people: average hourly earnings for all employees rose by 0.2% on the month and 3.8% over the past year, to $36.67. For production and nonsupervisory workers, pay is up 3.8%–4.0% over 12 months as well, sitting around $31.53.
Meanwhile, headline CPI came in at 3.0% year-over-year for September, with core inflation also running at roughly 3.0%.

The textbook answer is: “Real wages are slightly positive. What are you complaining about?” But textbook real wages don’t pay:
- Mortgage and rent levels set at 3% money, not 4–5%.
- Insurance premiums that quietly outrun CPI.
- Higher interest costs on revolving debt and new loans.
- Structural shortages in housing and energy that never reset lower.
🧮 When you stack wage growth against housing, energy, taxes, insurance, and debt service, the margin for the median household rounds to zero. That’s why the “labor market is fine” narrative feels delusional to people living inside it.
The Great Employment Plateau and the AI Industrial Cycle
Zoom out from the monthly noise and look at the long-term chart of total nonfarm employment. It’s a nearly straight line up from the 1940s, punctuated by recessions and the 2020 pandemic cliff, followed by a vertical recovery spike and then a gentle glide higher.
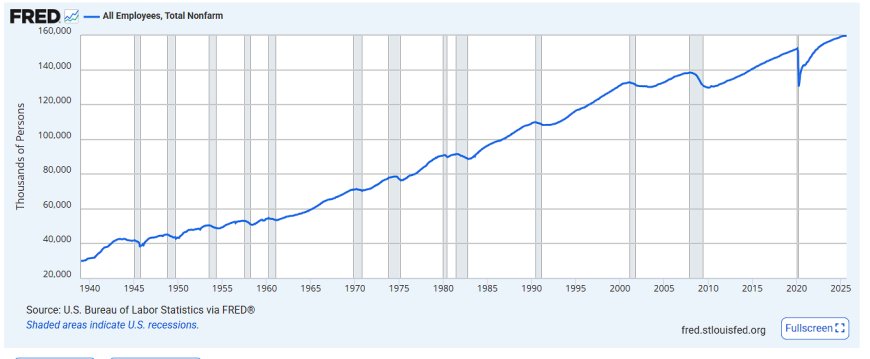
Now overlay the recent monthly changes — the bars from BLS Chart 2 — as a rolling average. You get a clear picture: the level of employment is high, but the incremental growth has faded. We’re not creating jobs at a pace consistent with the kind of credit expansion, asset pricing, and AI-industrial capex that’s underway.
That’s where this jobs print intersects with the broader Pattern Nexus framework:
- The neutral interest rate is sitting somewhere in that 3–4% band. The Fed held us above it for years; now they’re trying to sneak back toward it without detonating asset prices or the Treasury’s funding schedule.
- The AI-industrial build-out — data centers, power, chips, networks — is jobs-light but capital-heavy. It pulls materials, energy, and credit, but only directly hires a relatively small pool of engineers, technicians, and trades.
- That leaves the rest of the labor market stuck in a plateau: enough demand to keep service jobs and safety-net employment growing, but not enough dynamism to pull millions of workers into new productive roles.
🧠 The Great Employment Plateau is what it looks like when a monetary- and AI-driven expansion hits the physical and demographic limits of the system without ever flushing the excess leverage out.
In a classic cycle, this is the point where you’d expect either a clean recession (flush the bad debt, reset prices, start fresh) or a genuine productivity boom that pulls the labor market up with it. Instead, we get something stranger: an AI-powered capital cycle that pushes corporate margins and asset values higher, while the median worker experiences a slow gravitational pull downward.
The Pattern Nexus Lens: What This Jobs Print Means for 2026
So what does a +119k, 4.4% unemployment print actually mean when you plug it into the larger system?
First, it confirms that the labor market is no longer the constraint. Inflation has cooled to ~3%, unemployment has drifted higher, and job growth has flattened. The constraint now is the funding of the AI-industrial build-out and the Treasury’s balance sheet, not whether there are enough baristas and nurses.
Second, it increases the probability of some form of 2026-style QE / liquidity regime that is sold as “supporting the softening labor market” but is structurally about:
- Keeping long yields inside a tolerable band for a $40+ trillion Treasury pile.
- Backstopping credit markets tied to data-center and energy build-outs.
- Making sure asset prices don’t do a 2008-style air pocket while the AI-industrial cycle is mid-flight.
Third, it suggests the path of least resistance for policy is: slow cuts, quiet support, no formal admission of yield-curve control — all under the cover of “responding to a cooling labor market” and “maintaining full employment.”
🔍 If you want to know where policy is going next, stop asking, “How many jobs did we add this month?” and start asking, “How do you fund an AI-industrial build-out and a structurally larger state without detonating the bond market?”
In that framing, the September 2025 jobs report is not a shock or a surprise. It’s simply the first official confirmation that the U.S. labor market has quietly shifted from “post-pandemic boom” into the slow, grinding plateau phase of the next regime.
Data Sources & Further Reading
- U.S. Bureau of Labor Statistics – The Employment Situation — September 2025 (news release, HTML):
https://www.bls.gov/news.release/empsit.nr0.htm - U.S. Bureau of Labor Statistics – The Employment Situation — September 2025 (PDF, with official charts):
https://www.bls.gov/news.release/pdf/empsit.pdf - BLS Establishment Data (tables B-1, B-2, B-3, B-8):
https://www.bls.gov/news.release/empsit.toc.htm - BLS – Consumer Price Index Summary, September 2025:
https://www.bls.gov/news.release/cpi.nr0.htm - FRED – All Employees, Total Nonfarm (PAYEMS):
https://fred.stlouisfed.org/series/PAYEMS
Aká je vaša reakcia?
 Páči sa mi to
0
Páči sa mi to
0
 Nehodnotiť
0
Nehodnotiť
0
 Láska
0
Láska
0
 Zábavné
0
Zábavné
0
 Wow
0
Wow
0
 Smútiť
0
Smútiť
0
 Rozhněvaný
0
Rozhněvaný
0

Founder of Pattern Nexus. I research markets, macro, geopolitics, AI, history, ancient systems, and the patterns most people overlook. I’m also building Market Radar, a trading scanner designed to read pressure, risk, confirmation, and setup quality before chasing a move. Pattern Nexus is where I connect the dots between data, history, technology, and the bigger system playing out around us.














Komentáre (0)