

solar-activity-across-centuries-sunspot-flare-analysis
An extensive statistical analysis of more than 300 years of sunspot records, historical solar activity reconstructions, and modern NOAA GOES solar flare observations. This research examines long-term…
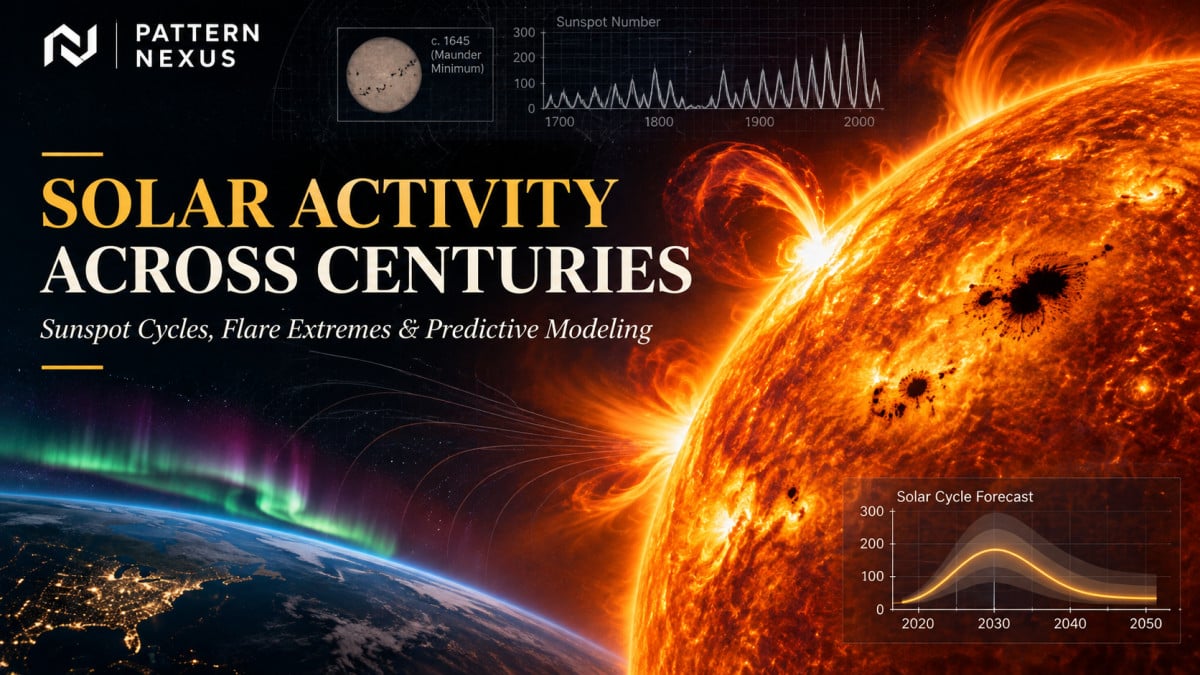
More than 300 years of sunspot records and modern GOES flare reports reveal predictable cycle structure alongside sharp, irregular flare extremes.
Solar Cycle 25 reached a smoothed peak of 160.9 in October 2024, 38% above Cycle 24. Across matching January–November windows, the M-or-stronger flare count declined from 834 in 2024 to 246 in 2026. The study tests outliers, regression relationships, and historical backtests, then forecasts sunspot and strong-flare activity into 2027.
Forecast boundary: November 2026 observations and projections are a dated snapshot through November 21 UTC. The forecast ranges are probabilities, not guarantees; this analysis does not establish solar causation of terrestrial weather.
11.0 years · Dominant period in monthly sunspot records
160.9 · Solar Cycle 25 smoothed peak in October 2024
3.93× · Fitted M+ flare rate at 100 vs. 50 sunspots
14.8 · Expected strong flares over the subsequent 30 days
01 · SOLAR RESEARCH
The current cycle in context
Cycle 25’s smoothed peak in October 2024 was 38% higher than Cycle 24’s. By October 2026 the monthly sunspot number had fallen to 45.7, down 60% from October 2025. The first 21 November days averaged 90.0, which materially raised the November estimate.
In the GOES science catalog, M-or-stronger flares fell from 834 in the January 1–November 19 window of 2024 to 246 in the matching 2026 window, a decline of 70.5%. The same windows contain 49 and 13 X-class events.
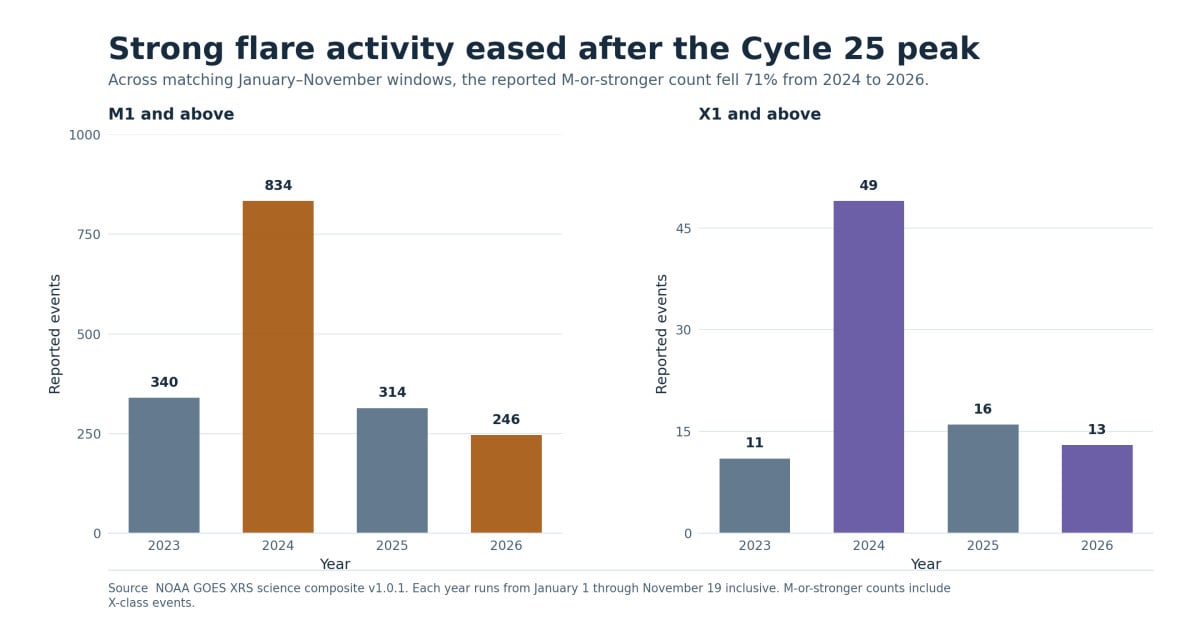
GOES events from January 1 through November 19
| Year | M or stronger | X class | Calendar days |
|---|---|---|---|
| 2023 | 340 | 11 | 323 |
| 2024 | 834 | 49 | 324 |
| 2025 | 314 | 16 | 323 |
| 2026 | 246 | 13 | 323 |
02 · SOLAR RESEARCH
Sunspots, cycle shape and deviations
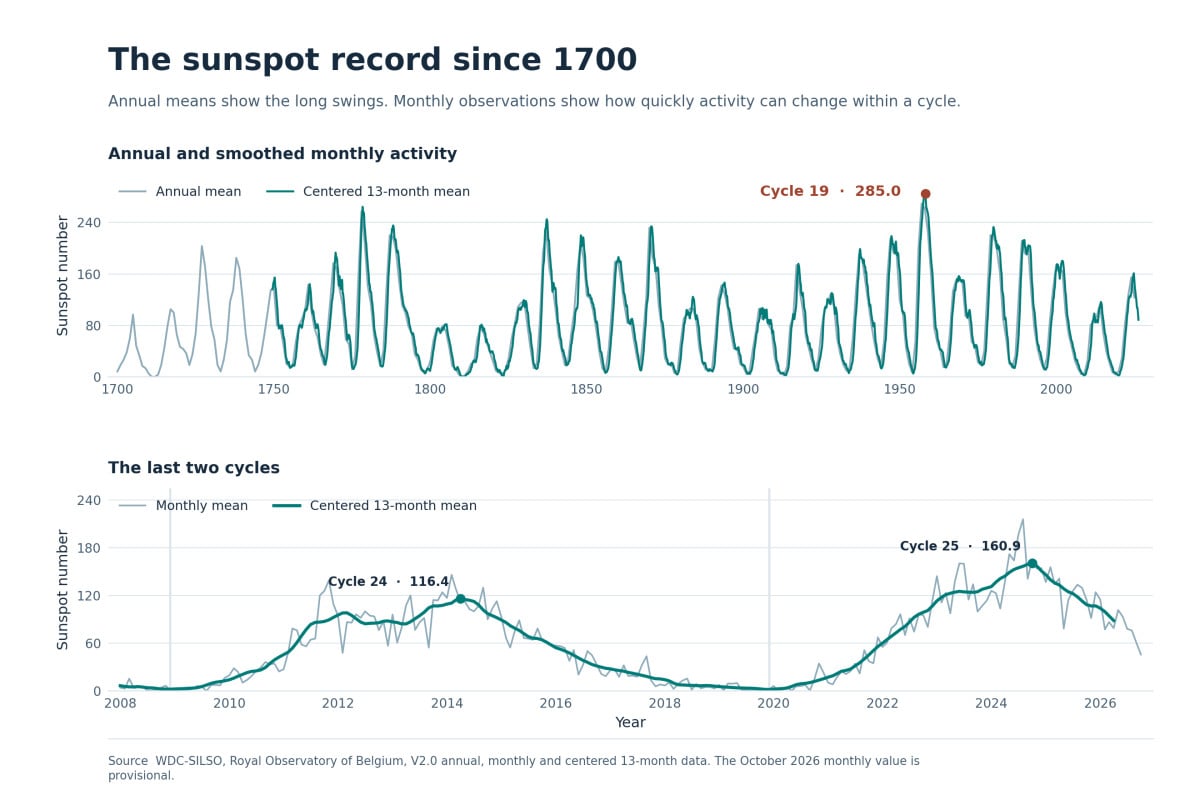
The highest completed-cycle peak was 285.0 in March 1958. Complete cycles lasted 9.0–13.6 years, with a median of 11.1 years. The 24 peak values exhibit substantial multi-decade variation. A linear trend was +4.6 sunspot-number units per century (p = 0.793).
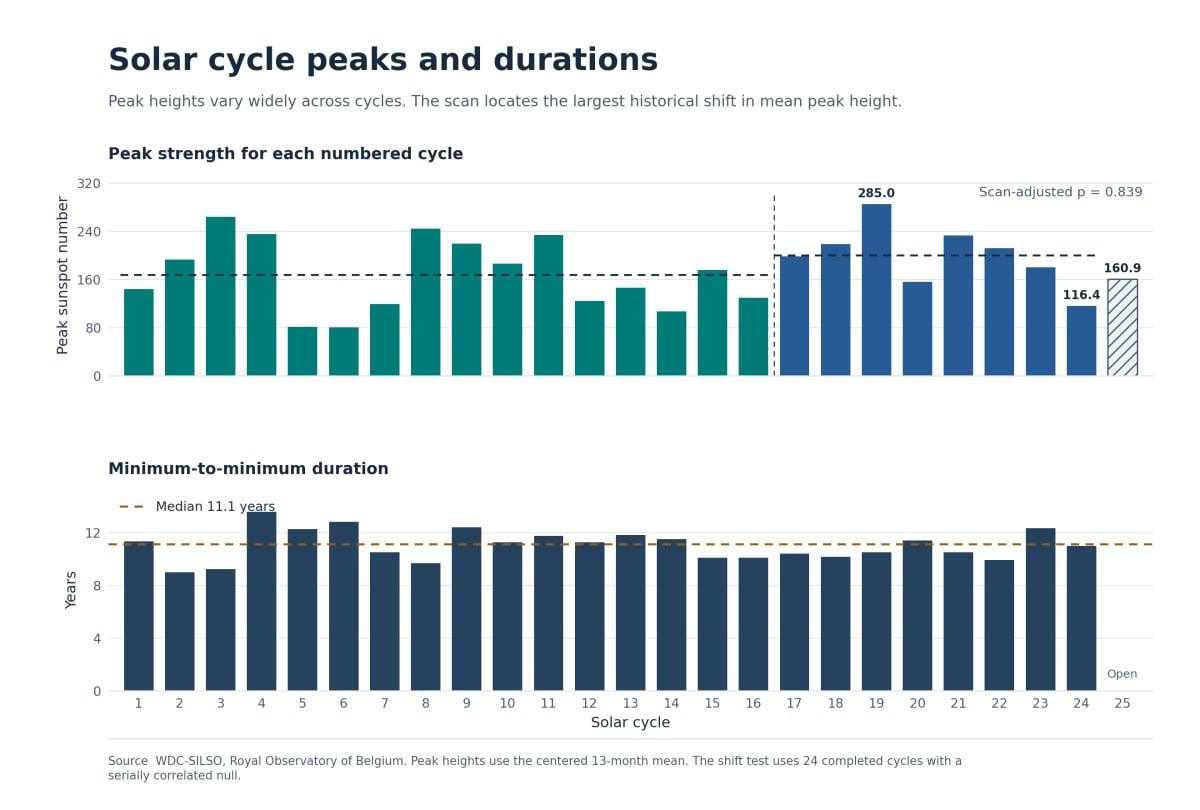
The strongest one-break candidate falls at Cycle 17, starting in 1933. Average peaks on either side were 168.0 and 200.1. The search-adjusted p-value of 0.839 provides weak evidence for a single persistent shift in the mean peak.
Selected solar cycles
| Cycle | Minimum | Peak month | Peak | Rise (years) | Duration (years) |
|---|---|---|---|---|---|
| 3 | Jun 1775 | May 1778 | 264.3 | 2.9 | 9.2 |
| 5 | Apr 1798 | Feb 1805 | 82.0 | 6.8 | 12.2 |
| 6 | Jul 1810 | May 1816 | 81.2 | 5.8 | 12.8 |
| 19 | Apr 1954 | Mar 1958 | 285.0 | 3.9 | 10.5 |
| 22 | Sep 1986 | Nov 1989 | 212.5 | 3.2 | 9.9 |
| 23 | Aug 1996 | Nov 2001 | 180.3 | 5.2 | 12.3 |
| 24 | Dec 2008 | Apr 2014 | 116.4 | 5.3 | 11.0 |
| 25 | Dec 2019 | Oct 2024 | 160.9 | 4.8 | Ongoing |
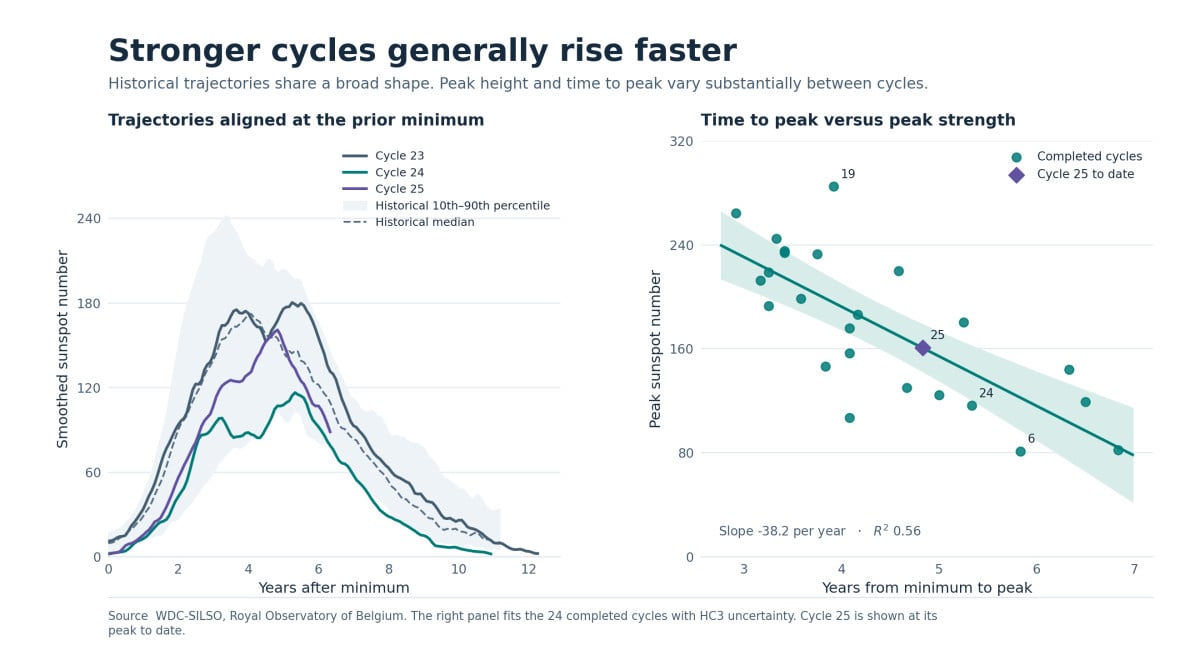
Across 24 completed cycles, each additional year from minimum to peak was associated with a 38.2-point lower peak (95% confidence interval 26.1–50.2, R² 0.56). This is the observed rise-time relationship often called the Waldmeier effect.
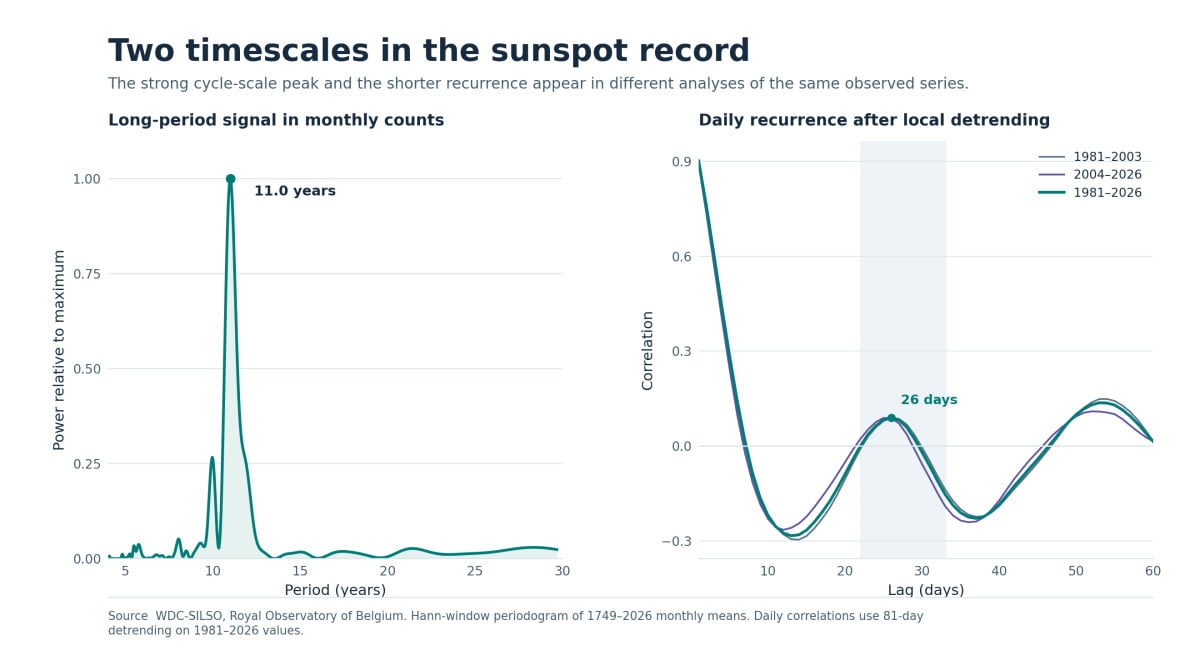
The daily residual correlation at its strongest 22–33 day lag was only 0.09 at 26 days. That gives a repeatable timing signal with limited day-to-day predictive power.
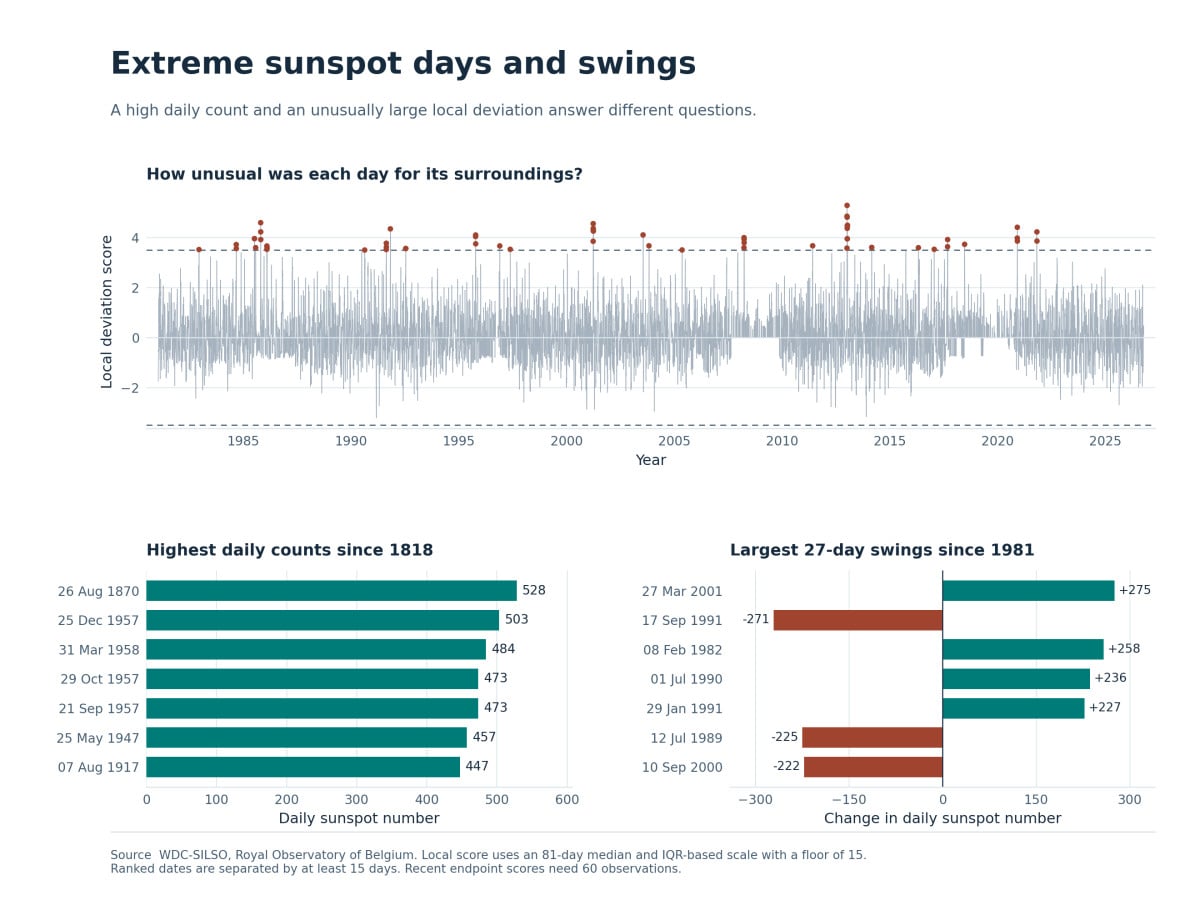
The highest raw daily number was 528 on Aug 26, 1870. Its historical SILSO row lists 1 observation. In the modern local comparison, Jan 5, 2013 reached 162 against a local median of 60. The largest negative local score was -3.22, below the chosen threshold in absolute magnitude.
Largest separated daily departures since 1981
| Date | Direction | Observed | Local median | Difference | Local score |
|---|---|---|---|---|---|
| Jan 5, 2013 | Above local median | 162 | 60 | +102 | +5.29 |
| Oct 22, 1985 | Above local median | 85 | 10 | +75 | +4.60 |
| Mar 27, 2001 | Above local median | 352 | 139 | +213 | +4.56 |
| Nov 29, 2020 | Above local median | 96 | 24 | +72 | +4.41 |
| Mar 4, 1991 | Below local median | 76 | 224 | -148 | -3.22 |
| Nov 26, 2013 | Below local median | 37 | 124 | -87 | -3.17 |
| Jan 27, 2004 | Below local median | 0 | 68 | -68 | -2.96 |
| Dec 6, 2000 | Below local median | 78 | 157 | -79 | -2.88 |
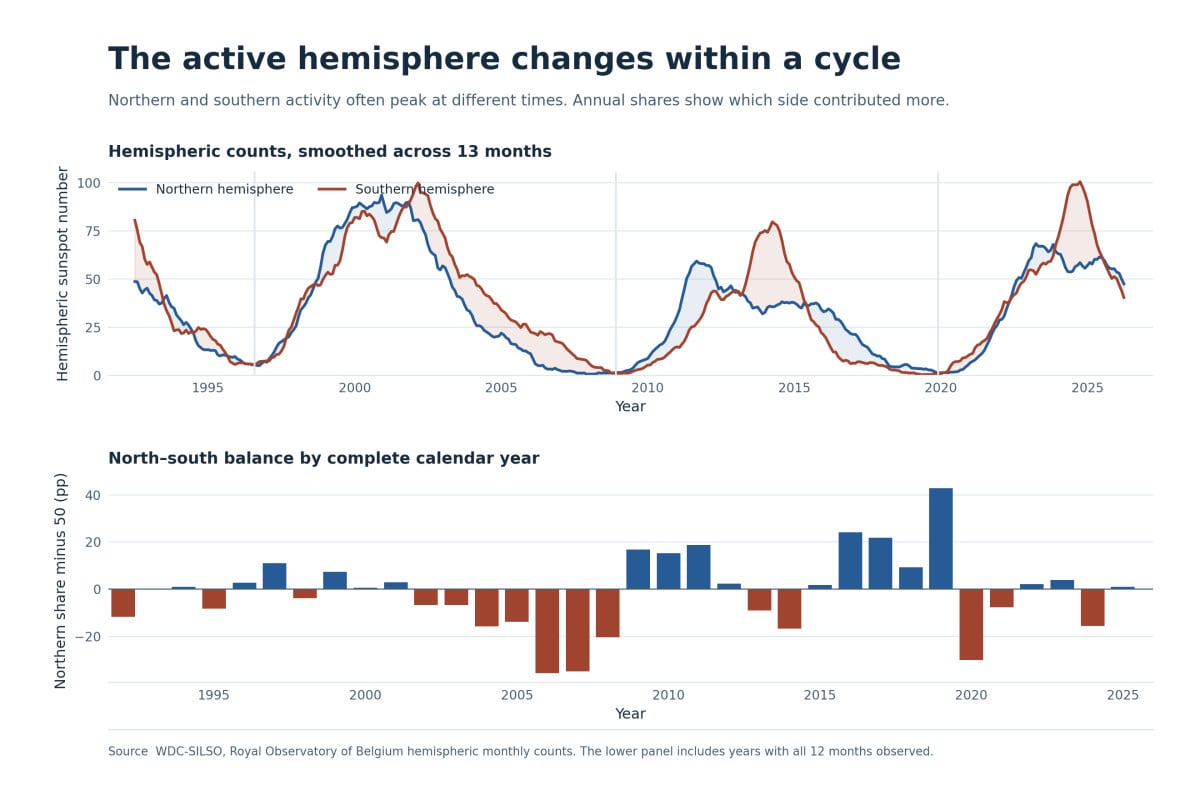
The southern hemisphere supplied 65.6% of the summed 2024 hemispheric sunspot number. In 2025 the northern share returned to 51.1%. The 13-month hemispheric maxima in Cycle 25 appeared in April 2023 in the north and October 2024 in the south.
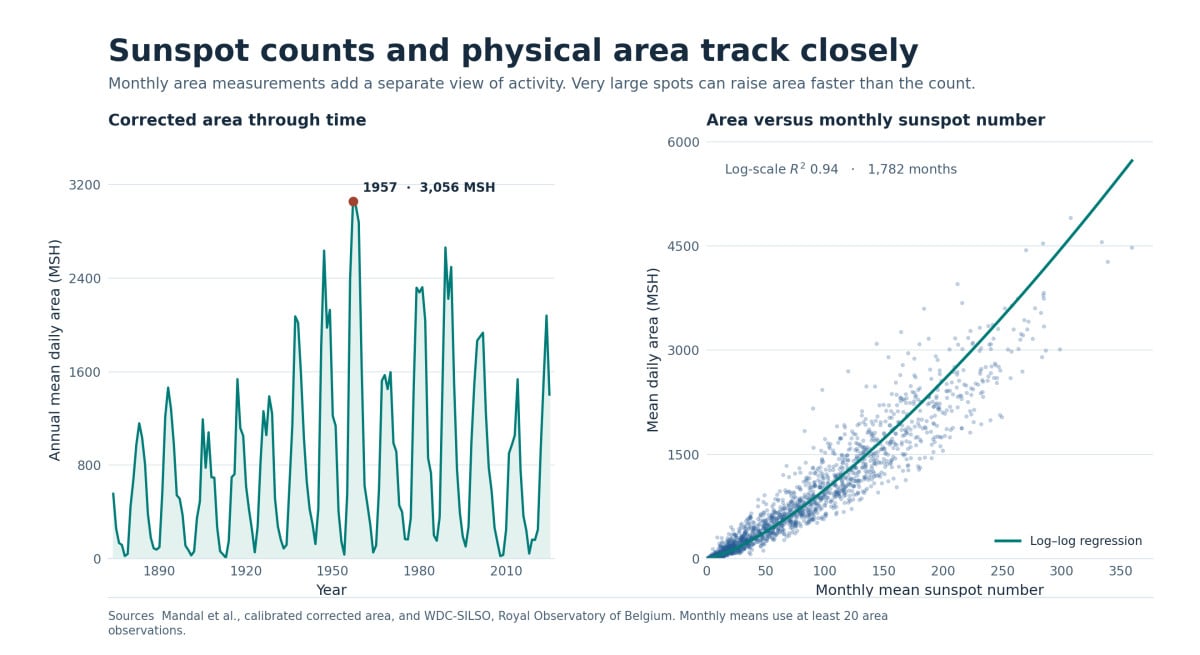
The log-transformed area regression explained 94.3% of the variation across 1,782 paired months. The largest daily corrected total area in the Mandal composite was 8,596 millionths of the solar hemisphere on Oct 29, 2003.
03 · SOLAR RESEARCH
Flare extremes and the sunspot relationship
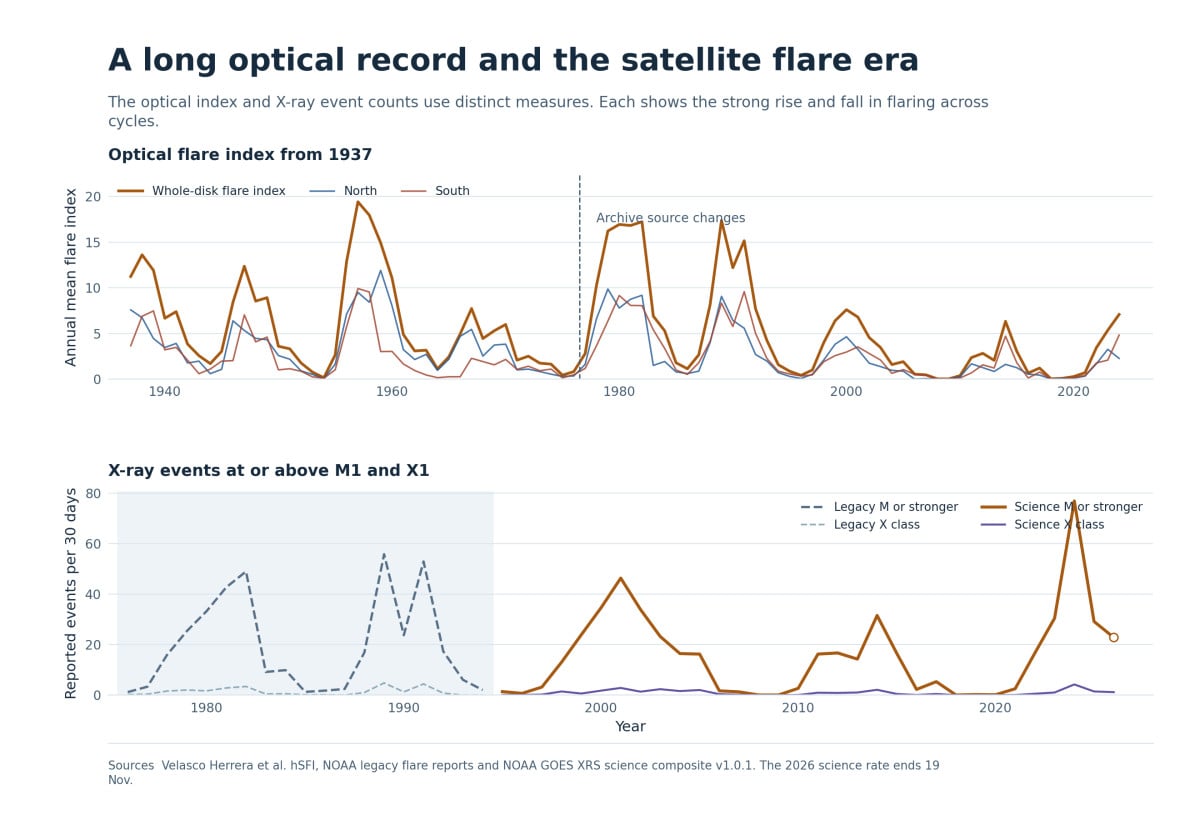
The H-alpha–based index reached its annual high of 19.42 in 1957. Its early Ondřejov segment and later Kandilli segment are shown with their source boundary. The NOAA analysis below uses 82,231 events in the recalibrated science catalog, including 6,072 M-or-stronger and 366 X-class events.
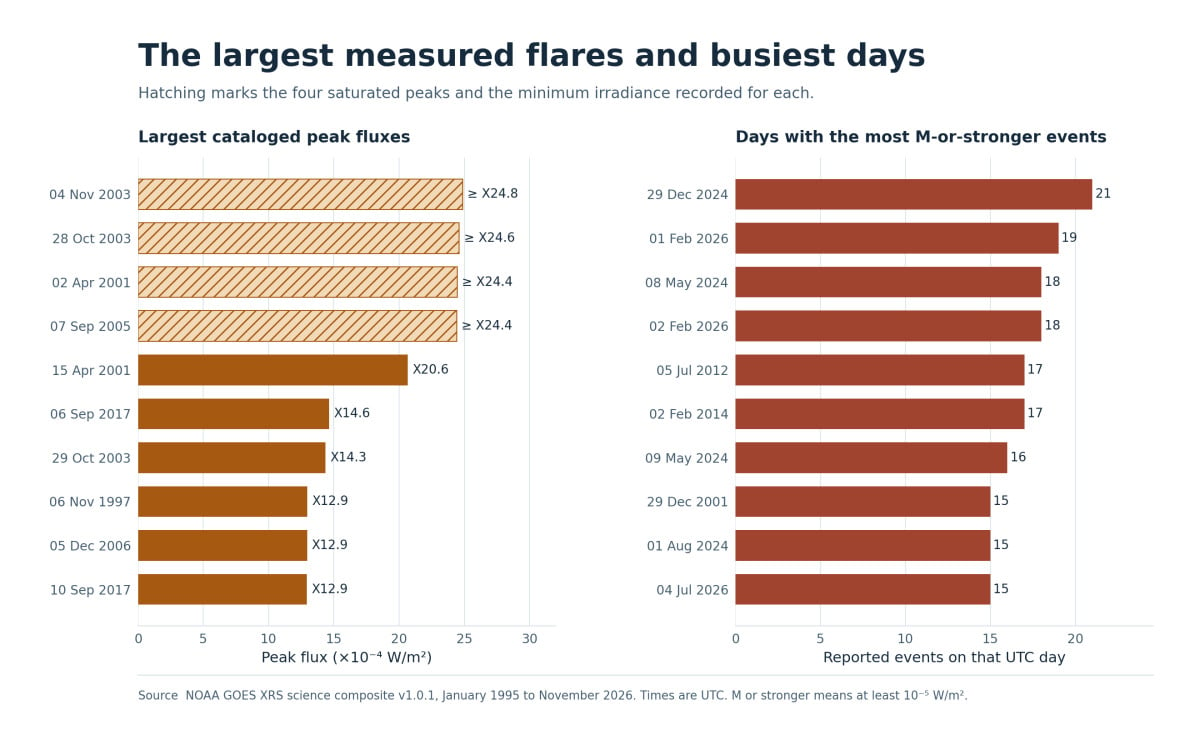
Nov 4, 2003 registered at least X24.8 in the science catalog. The largest unsaturated peak was X20.6 on Apr 15, 2001. The busiest UTC day was Dec 29, 2024, with 21 M-or-stronger events.
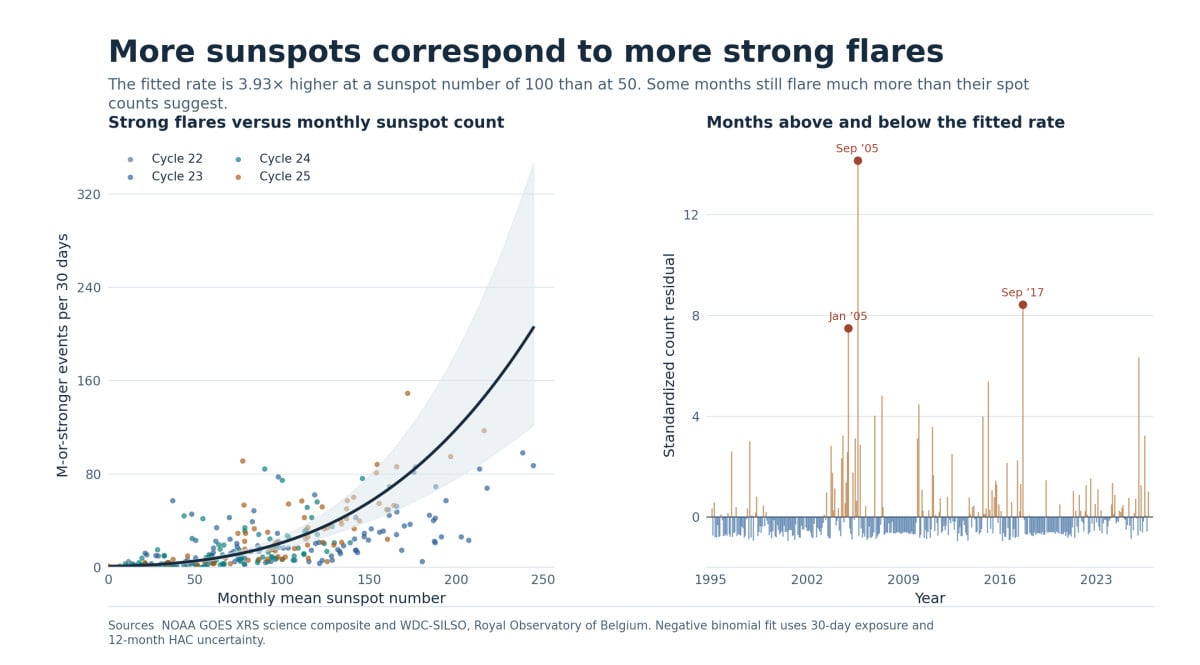
At a monthly sunspot number of 100, the fitted M-or-stronger rate is 3.93 times the rate at 50 (95% interval 3.16–4.90). Allowing separate baseline rates for Cycles 23–25 gives 3.83 times (95% interval 2.98–4.92). The cycle-specific effects at a fixed sunspot number had wide intervals.
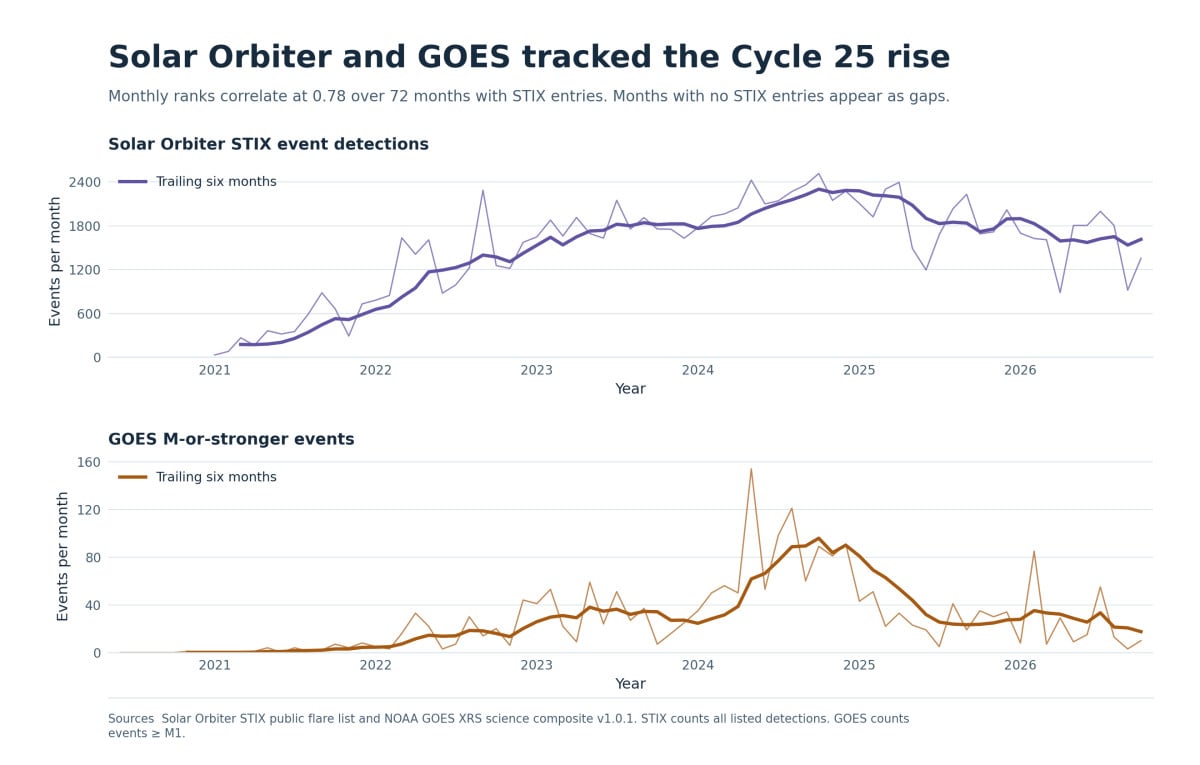
The strongest positive monthly departure, September 2005, logged 57 events against a fitted mean of 3.4. February 2026 had 85 against 11.4 even as the broad cycle was declining.
Strong flare months above the fitted rate
| Month | Sunspot mean | Observed M+ | Fitted M+ | Residual score |
|---|---|---|---|---|
| Sep 2005 | 37.2 | 57 | 3.4 | +14.15 |
| Sep 2017 | 43.7 | 44 | 4.3 | +8.43 |
| Jan 2005 | 48.1 | 47 | 5.2 | +7.49 |
| Feb 2026 | 77.4 | 85 | 11.4 | +6.34 |
| Mar 2015 | 54.5 | 43 | 6.4 | +5.38 |
| Jun 2007 | 21.3 | 12 | 1.7 | +4.83 |
04 · SOLAR RESEARCH
Forecasts and backtests
November sunspots and the next 12 months
The October-only model projected 46.0 for November. Using days 1–21 lifts the November estimate to 80.2 (80% range 69.4–95.6). The selected day-21 method had a historical holdout mean absolute error of 6.9 sunspot-number units. Its historical inputs use retrospectively released SILSO daily data.
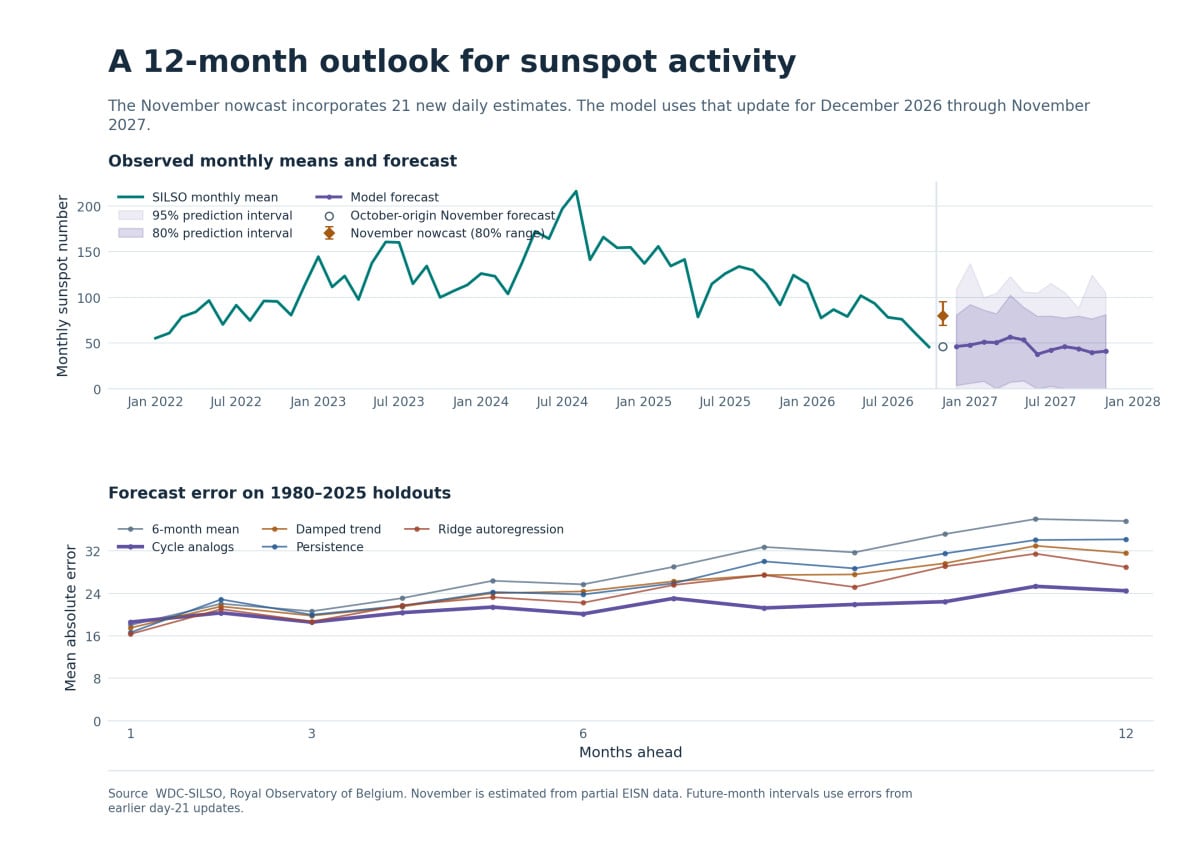
The cycle analogs model scored 24.5 mean absolute error at 12 months versus 34.2 for the last-value baseline. At one month its error was 18.6, with 16.3 for the ridge autoregression. Model selection used pre-1980 forecasts. The partial-month update has its own calibration and holdout evaluation.
November nowcast and subsequent monthly forecasts
| Month | Basis | Sunspot number | 80% range | 95% range |
|---|---|---|---|---|
| Nov 2026 | Partial-month estimate | 80.2 | 69.4–95.6 | 61.5–107.2 |
| Dec 2026 | Forecast | 46.2 | 3.7–80.7 | 0.0–108.9 |
| Jan 2027 | Forecast | 47.9 | 6.2–92.1 | 0.0–137.0 |
| Feb 2027 | Forecast | 51.0 | 8.3–86.1 | 0.0–99.9 |
| Mar 2027 | Forecast | 50.5 | 0.0–82.1 | 0.0–104.5 |
| Apr 2027 | Forecast | 56.4 | 7.3–102.5 | 0.0–122.8 |
| May 2027 | Forecast | 53.5 | 8.7–89.1 | 0.0–106.0 |
| Jun 2027 | Forecast | 37.8 | 0.0–79.3 | 0.0–104.9 |
| Jul 2027 | Forecast | 42.3 | 2.9–79.6 | 0.0–115.3 |
| Aug 2027 | Forecast | 46.1 | 0.0–77.5 | 0.0–105.3 |
| Sep 2027 | Forecast | 43.8 | 0.0–79.5 | 0.0–88.1 |
| Oct 2027 | Forecast | 39.6 | 0.0–76.5 | 0.0–124.4 |
| Nov 2027 | Forecast | 41.1 | 0.0–81.1 | 0.0–104.9 |
Sunspot model mean absolute error on the original monthly holdout
| Model | 1 month | 3 months | 6 months | 12 months |
|---|---|---|---|---|
| 6-month mean | 18.0 | 20.6 | 25.7 | 37.6 |
| Cycle analogs | 18.6 | 18.6 | 20.1 | 24.5 |
| Damped trend | 17.5 | 19.8 | 24.4 | 31.6 |
| Persistence | 16.6 | 20.0 | 23.8 | 34.2 |
| Ridge autoregression | 16.3 | 18.7 | 22.2 | 29.0 |
Probability of a strong flare day
The November 21 archive implies an 8.3% probability of at least one M-or-stronger flare on November 22 UTC. The model combines lagged daily sunspot counts with recent flare activity. The held-out Brier score was 0.095 across 3,287 days, 18% lower than the recent-rate baseline and 45% lower than the expanding climatology. A year-block bootstrap puts the latter skill estimate at 31% to 60%.
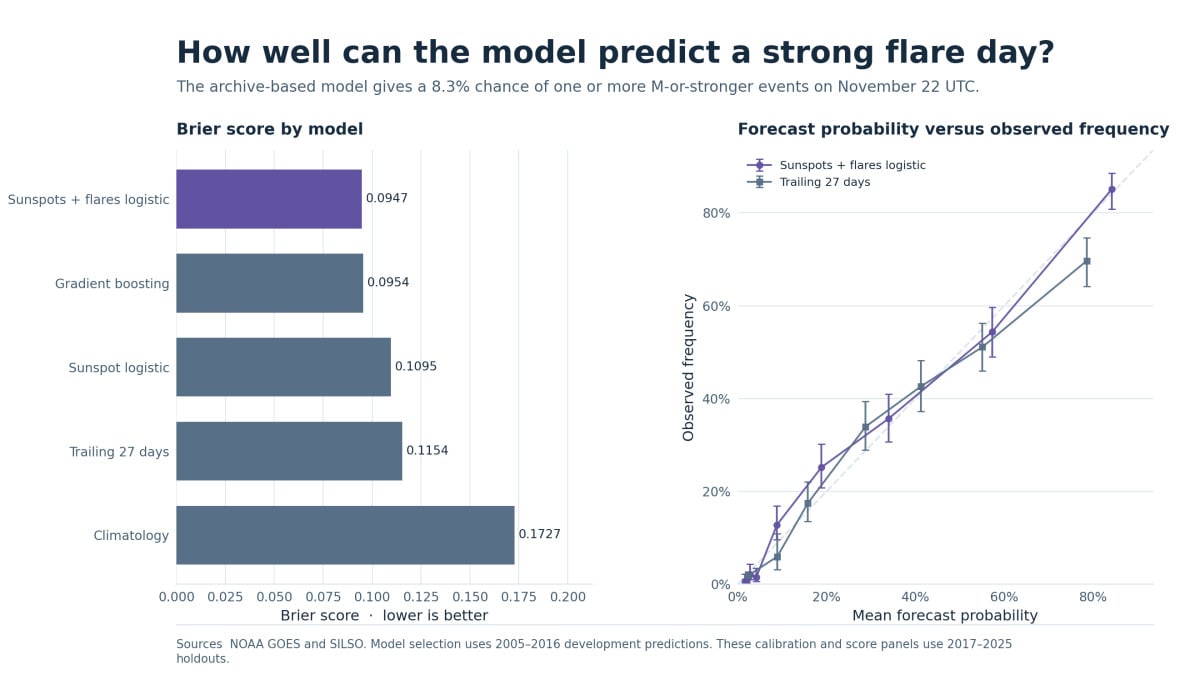
Holdout score for predicting at least one M-or-stronger flare
| Model | Brier score | ROC AUC | Average precision |
|---|---|---|---|
| Sunspots + flares logistic | 0.0947 | 0.914 | 0.760 |
| Gradient boosting | 0.0954 | 0.914 | 0.750 |
| Sunspot logistic | 0.1095 | 0.892 | 0.670 |
| Trailing 27 days | 0.1154 | 0.872 | 0.611 |
| Climatology | 0.1727 | 0.425 | 0.222 |
Strong flare counts over one week and one month
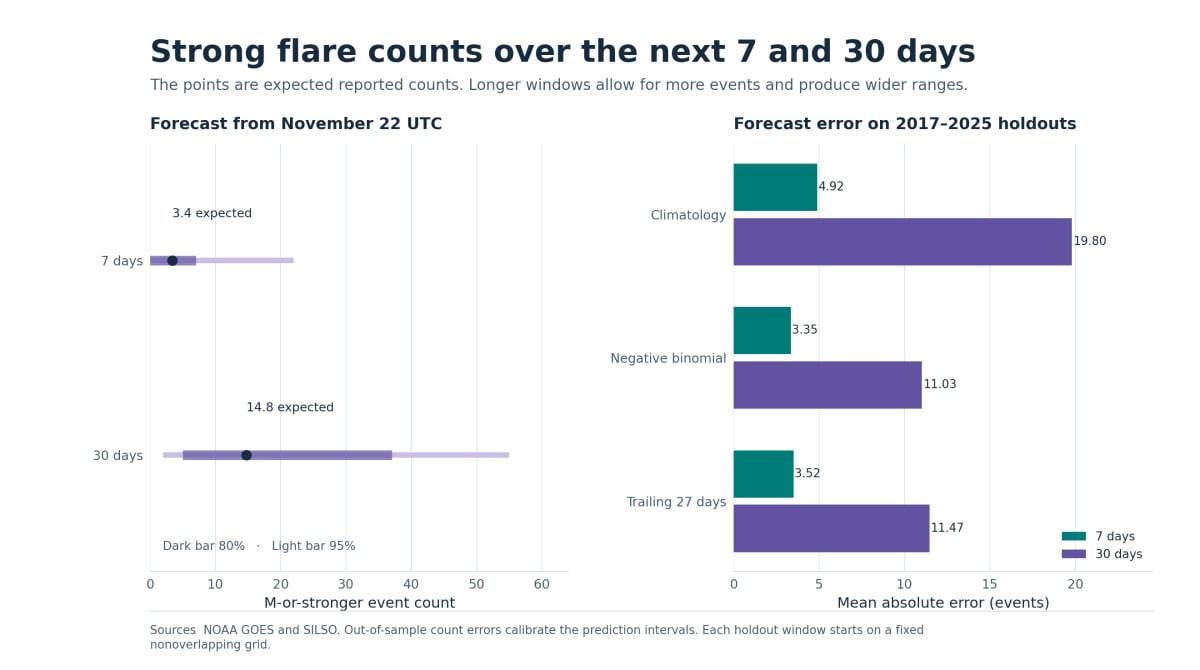
From the November 21 snapshot, the count models estimate 3.4 M-or-stronger events over the following seven days and 14.8 over 30 days. The respective 80% ranges are 0–7 and 5–37.
Strong flare count forecasts
| UTC forecast window | Expected count | 80% range | 95% range |
|---|---|---|---|
| Nov 22 – Nov 28 | 3.4 | 0–7 | 0–22 |
| Nov 22 – Dec 21 | 14.8 | 5–37 | 2–55 |
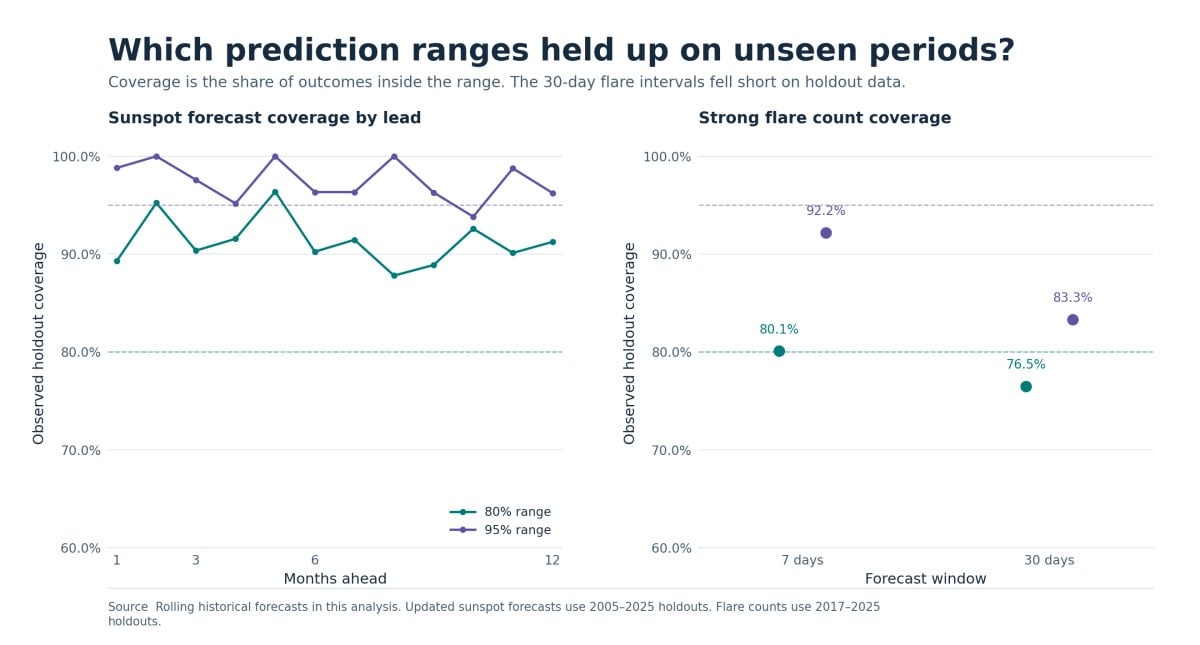
The far tails are uncertain. The nominal 95% 30-day flare range covered 83.3% of historical holdout windows. Its nominal 80% range covered 76.5%. The seven-day 80% range covered 80.1%.
05 · SOLAR RESEARCH
Early observations and isotope evidence
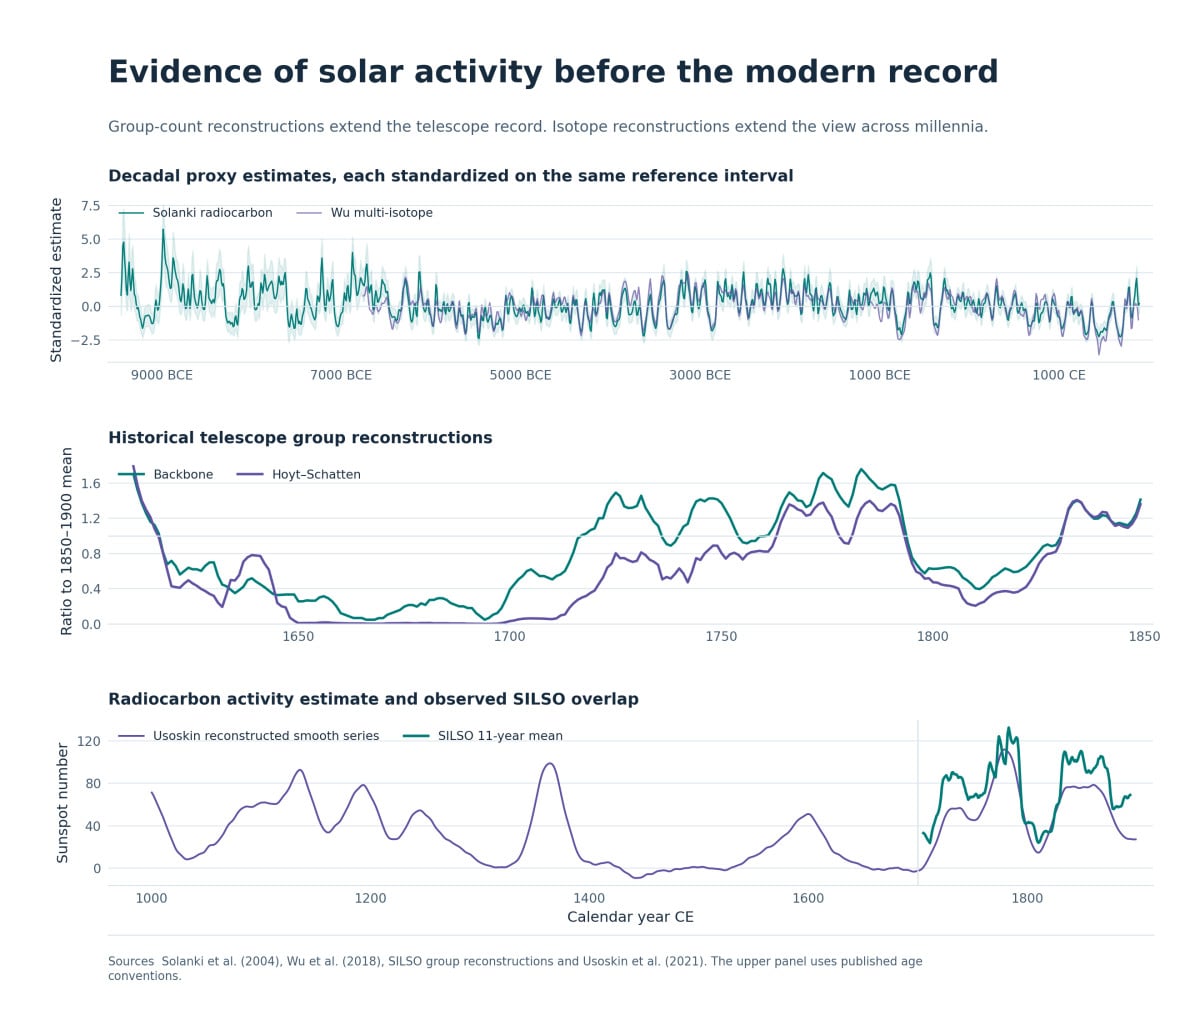
Decadal radiocarbon estimates in the archive extend back roughly 11,400 years before 1950. The Wu series combines radiocarbon and beryllium evidence. Historical group-count databases begin in 1610 and have sharply uneven observing coverage. Dated naked-eye sightings and early optical flares provide individual records. The modern forecast models are calibrated using the consistent SILSO and GOES series.
06 · METHODS & VALIDATION
Methods and validation
Observed changes and unusual events
- Sunspot cycle peaks use the published centered 13-month SILSO series between published minima. Cycle 25 is included descriptively and excluded from completed-cycle fits. The single-break scan searches splits with at least five cycles per side. Its p-value compares the largest scanned contrast with 20,000 Gaussian AR(1) simulations at the estimated lag-one correlation.
- Daily outliers use the difference from an 81-day centered median divided by the larger of 15 or the local interquartile range divided by 1.349. Flagging requires an absolute score of 3.5. The scale is robust and descriptive. It has no standard-normal probability interpretation. The ranked independent dates are separated by more than 14 days.
- Flares are assigned to the UTC date of peak irradiance. A strong flare has a peak of at least 10⁻⁵ W/m², and X class begins at 10⁻⁴ W/m². The catalog’s zero days represent zero reported events. Continuous instrument uptime would require minute-resolution flux coverage. The NOAA science archive supplies the historical fit. The SWPC snapshot supplies the final two days of predictive inputs.
- The monthly rate model uses the log of 1 + sunspot number / 50, with an exposure offset for the number of calendar days. Negative binomial dispersion accommodates clustering. Confidence intervals use a Bartlett HAC covariance with 12 monthly lags. The monthly residual table ranks upper-tail probability from the fitted retrospective model. Peaks and month-level fits do not imply an attribution to individual active regions.
Forecast validation
- Monthly sunspot models compare persistence, a trailing mean, damped trend, ridge autoregression and completed-cycle analogs. Development labels finish in 1979. Holdout origins begin in 1980 and targets finish by 2025. Cycle-analog candidates require an already completed comparison cycle and a six-month buffer for minimum recognition.
- The partial-month comparison evaluates four day-21 methods on 1950–1979 development and 1981–2025 holdouts. In the updated monthly model, the estimated last-month mean is substituted at each retrospective origin. Empirical error intervals are calibrated on 1981–2004 targets and checked on 2005–2025 holdouts.
- Day and count models use information through the prior UTC day. The day models compare climatology, a 27-day rate, logistic regressions and gradient boosting. Expanding annual fits are scored on 2005–2016 development and 2017–2025 holdouts. Each held-out calendar year enters training only after its predictions are issued. The historical runs use revised records as retrospective inputs.
- Seven- and 30-day count models predict the sum within each window, using nonoverlapping evaluation windows for each horizon. Candidate models use a climatological mean, the prior 27-day rate or a negative binomial regression. Earlier out-of-sample residuals provide count ranges scaled by the square root of 1 + forecast. Their observed coverage is reported above.
SOURCES
Primary data and sources
- Royal Observatory of Belgium, WDC-SILSO sunspot counts, cycle timing, and group reconstructions. V2.0 and EISN data · Cycle minima and maxima · Group number archives
- NOAA NCEI GOES XRS science flare report v1.0.1 and NOAA SWPC near-real-time primary feed. Science CSVs · Flare report documentation · Operational feed
- Velasco Herrera and colleagues, optical and hemispheric flare index. Article and data · Archived workbook
- Mandal and colleagues, corrected sunspot area. Calibration paper · Updated composite
- Solar Orbiter STIX flare records. Published STIX list
- Solanki, Wu and Usoskin isotope reconstructions. Solanki archive · Wu data · Usoskin data
The companion charts and models ZIP contains 17 individual figures, analysis tables, forecast scores, and the code used to recreate them.
This study reports solar-cycle structure, observed flare outliers, fitted historical relationships, and backtested forecasts. It does not claim that sunspot counts alone explain every extreme flare or establish a causal connection to polar-vortex dynamics.
Article overview
An extensive statistical analysis of more than 300 years of sunspot records, historical solar activity reconstructions, and modern NOAA GOES solar flare observations. This research examines long-term solar cycles, extreme outliers, deviations from historical patterns, changing relationships between sunspots and powerful flares, and evidence of structural shifts in solar behavior. Using regression analysis, spectral analysis, statistical modeling, and out-of-sample forecasting, the study evaluates Solar Cycle 25 against centuries of historical data and develops probabilistic projections of future solar activity. Includes detailed scientific charts, historical comparisons, anomaly detection, and predictive model performance.
What's Your Reaction?
 Like
0
 Dislike
0
 Love
0
 Funny
0
 Wow
0
 Sad
0
 Angry
0

Nexus (Christopher)
Founder of Pattern Nexus. I research markets, macro, geopolitics, AI, history, ancient systems, and the patterns most people overlook. I’m also building Market Radar, a trading scanner designed to read pressure, risk, confirmation, and setup quality before ch…
Related research

The Sun, Liquidity, and Financial Turning Points: The Regression Missed the Regime
A corrected Pattern Nexus analysis of solar cycles, liquidity, recessions, and financial tops from January 1987 through July 2026. The firs…
7 shared topics.
Polar Vortex Watch 2026–27: The Sun Quieted, the Vortex Hit a Record — Now the Real Test Begins
The early-season Arctic vortex has now crossed from unusual into a verified date-matched record at 10 hPa. At the same time, NOAA reports v…
4 shared topics, same research avenue.
Polar Vortex Watch 2026–27: Early Arctic Organization Is Now Pressing Historical Extremes
What started as an unusual late-August structural signal is becoming something much harder to dismiss. The 10-hPa Arctic winds have moved a…
4 shared topics, same research avenue.
Artemis II Launches: Reopening the Deep-Space Stack
Artemis II has launched, but the real story is bigger than a lunar flyby. This Pattern Nexus analysis breaks down why the first crewed SLS-…
4 shared topics, same research avenue.
The Sun, Money and the Global Core: What Survived a 375-Year Test
I rebuilt the solar-recession thesis around the dominant global financial core instead of a modern U.S. sample: Amsterdam and the guilder, …
4 shared topics.
The Polar Vortex Reversal Is Confirmed: Fourteen Records, the October Wave Transition, and the Thanksgiving Forecast Conflict
NASA now confirms fourteen consecutive date-matched Arctic 10-hPa wind lows and an early-November reversal, following five September high-w…
3 shared topics, same research avenue.
The Polar Vortex Reversed on November 10. NASA Has Confirmed It—Now We Track the Cold Delivery
NASA has confirmed an exceptionally early 60°N 10-hPa easterly reversal. This report separates analyzed observations from forecasts and tra…
3 shared topics, same research avenue.
The Space Buildout Is Becoming Real: Starship Reaches Orbit, Artemis Rewrites the Moon Plan, Orbital AI Goes Live, and Mars Infrastructure Expands
Since the September 23 Pattern Nexus space update, several themes that were still forecasts have crossed into hardware and operations. Star…
3 shared topics, same research avenue.
Comments (0)
Security Check
Please complete the captcha to verify you are human.