
The Everything Bubble: When Money Outruns Production
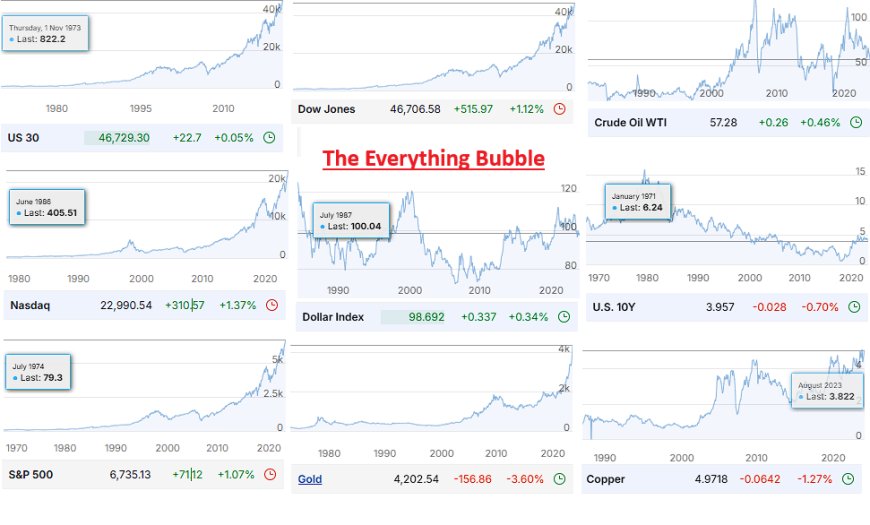
Since the 2000s, nearly every major asset has inflated together — stocks, commodities, yields, and metals. As money supply outruns real production, prices rise despite rising productivity. The “Everything Bubble” isn’t about growth — it’s about distortion.
The Everything Bubble: When Money Outruns Production
By Christopher Grenke • Pattern Nexus

Put the charts side by side—stocks, commodities, the U.S. 10-year, gold, the dollar index, oil, copper. Since the 2000s, nearly everything has inflated together. When every asset that defines the cost of living and the structure of the economy rises in tandem, that isn’t organic growth—it’s monetary distortion.
The core imbalance: money vs. product
Productivity keeps rising. We can farm, manufacture, and ship faster and cheaper than any generation before us. On fundamentals, more output at lower unit cost should push prices down over time.
Yet the opposite shows up at the register. The reason is simple: the expansion of money has outpaced the expansion of product. When claims (currency and credit) grow faster than real goods and services, the measuring stick shrinks and nominal prices rise—even as we get better at producing the thing being measured.
“Eggs should be cheaper” (and why they aren’t)
Take a basic good: eggs. With modern farming tech, logistics, and feed science, a dozen should cost less than it did a century ago. But the unit we price with—the currency—has been diluted. So the price you see reflects monetary conditions at least as much as supply and demand.
What the panels suggest
- Gold tends to move first. Historically, major gold advances often lead equity cycles by roughly 12–18 months. When gold runs, it’s frequently discounting policy and liquidity shifts before they show up in stock multiples.
- Oil is still the most tethered to real-world supply and demand, but its trend is ultimately translated through the same currency lens that prices everything else.
- Equities chase liquidity. When policy eases or expectations for easier policy rise, multiples expand faster than underlying productivity can justify, especially late-cycle.
- Yields & the dollar oscillate with policy and global flows, but across cycles the dominant signal is the same: the system repeatedly chooses liquidity over restraint.
The wealth illusion
Nominal portfolios rise, but the unit they’re denominated in is falling in purchasing power. That’s why it can feel like “wealth is up” while life seems more expensive. What looks like prosperity is often the shadow of debt and liquidity expanding faster than the real economy can keep up.
Implications for builders and owners
In a world where the measuring stick is unstable, assets with cash flow, scarcity, or utility matter. Two practical notes from the builder’s playbook:
- Cash-flow businesses priced on real customers and repeatable margins can be rational islands in an irrational sea—if you can operate them well.
- Real estate offers unique levers: you can live off equity gains, show losses on paper via depreciation, and still build net worth. The tax code is ~12–14,000 pages; the first few pages describe taxation—the rest are incentives and exceptions. Housing is explicitly incentivized, and programs like Section 8 create durable rent floors and scheduled adjustments.
So, are stocks “too high” if gold leads?
If gold is again front-running equities, indexes can float higher on liquidity and narrative even as productivity can’t plausibly service 60–70% valuation premia. That’s how bubbles persist: liquidity stretches the rubber band until something forces repricing—policy, profits, or both.
What to watch next
- Policy drift toward easier money (rate cuts, balance-sheet changes, liquidity facilities).
- Real-economy constraints (energy supply, freight capacity, labor participation) that translate liquidity into prices.
- Gold vs. broad equities: renewed gold strength ahead of equities has often signaled regime transitions.
Bottom line
When everything goes up together, it’s not that the world suddenly became scarce—it’s that our unit of account became abundant. The Everything Bubble is the spread between what we can really make and the claims we issue against it. Understand the spread, and you can position not just to protect wealth, but to build it—by owning and operating real assets in a system that keeps choosing liquidity.
Note: This article is for educational purposes and reflects personal analysis and opinion. It is not financial, tax, or legal advice. Consult a qualified professional for decisions specific to your situation.
Яка ваша реакція?
 Подобається
0
Подобається
0
 Неподобання
0
Неподобання
0
 Любов
0
Любов
0
 Смішно
0
Смішно
0
 Ух ти
0
Ух ти
0
 Сумно
0
Сумно
0
 Злий
0
Злий
0

Founder of Pattern Nexus. I research markets, macro, geopolitics, AI, history, ancient systems, and the patterns most people overlook. I’m also building Market Radar, a trading scanner designed to read pressure, risk, confirmation, and setup quality before chasing a move. Pattern Nexus is where I connect the dots between data, history, technology, and the bigger system playing out around us.

















Коментарі (0)