

The Fed Has Redrawn America's Private-Credit Map
New Federal Reserve tables connect private-credit loans with their vehicles and capital providers. PN follows pension and insurer ownership, fund borrowing, capital commitments, and the cash pressure…

Jump to a section
The Federal Reserve's October 16 research explains a substantial change in the Financial Accounts: private credit now has identifiable vehicles, loan instruments, and fund-share ownership. The September release also raised the measured business-debt-to-GDP ratio by roughly five percentage points in recent years, largely by improving classification and coverage.[1][2]
The latest published quarter is June 2026. In the private-debt-fund share table, private and state/local employee pension funds together hold $274.7 billion, or approximately 42.3% of the measured total. Life insurers hold $92.1 billion, about 14.2%.[3] My focus is how those institutions absorb a weaker investment outcome, meet commitments, and adjust their next financing decisions.
The loan measures a claim on a business and its ability to service debt.
Fund assets, borrowing, and investor shares form distinct financing layers.
Pensions, insurers, and other investors bear different obligations and constraints.
Distributions, existing commitments, and liquid resources determine when pressure appears.
01 · PRIVATE CREDIT AND FUNDING
A measurement revision changes the starting point
The important development happened in the September 2026 Financial Accounts release. The October research note explains the construction and its implications. Those dates are different from the observation date of the underlying assets and liabilities.[1][2]
Before the integration, much domestic private-credit borrowing was already present somewhere on business balance sheets. Corporate loans could sit among miscellaneous liabilities rather than within the measured debt instruments. Loans to noncorporate businesses could be attributed to depository lending. The new treatment identifies the originating vehicles and improves the classification of the claims.[1]
That changes the amount counted as business debt without requiring a matching burst of borrowing in September. It also improves our view of who financed the loans and which intermediaries sit between the original capital provider and the operating borrower.
The Fed estimates that including private credit raises the historical business-debt-to-GDP measure by around five percentage points in recent years. Its comparison also finds that the broad trajectory remains similar, including the decline from the 2020 peak.[1] A higher measured level therefore needs to be incorporated into analysis without turning the statistical revision into a new credit event.
For PN, this is useful because a financial system can become easier to map before it becomes easier to forecast. Better coverage improves the questions we can ask. It does not supply the date of the next default cycle or establish that an observed exposure will become a loss.
02 · PRIVATE CREDIT AND FUNDING
Start with the right loan total
The September 11 vintage of the new loan table records $1,539.9 billion outstanding in the second quarter of 2026. Of that, $1,120.8 billion is owed by nonfinancial corporations and $230.7 billion by noncorporate businesses. Other financial businesses and foreign borrowers account for the remaining categories.[4]
The two domestic nonfinancial categories sum to $1,351.5 billion. That is the appropriate borrower scope when discussing loans to U.S. nonfinancial businesses. Using the entire table total for that narrower claim would pull in other financial and foreign borrowers.
| Measure, 2026 Q2 | Amount | What is being counted |
|---|---|---|
| Total private-credit loans in the instrument table | $1,539.9bn | All borrower categories included in that table |
| Loans to domestic nonfinancial businesses | $1,351.5bn | Corporate plus noncorporate borrowers; PN sum |
| Financial assets of U.S. private debt funds | $935.0bn | One type of lending vehicle, including assets beyond private loans |
| Private-debt-fund shares in the ownership table | $649.5bn | The defined fund-share instrument, with its own cross-border coverage |
Sources: Federal Reserve tables F4.4.s, S124.8.s, and F522.3.s.[3][4][5]
These amounts are views of different instruments and sectors. They should not be added together as if each represents another pool of loans to operating businesses. A pension's fund interest, the fund's financing, and the business loan can all appear as valid claims at different points in the same financing chain.
The geography also needs care. The fund-share instrument covers shares issued by domestic private debt funds, plus foreign-fund shares held by U.S. residents. It excludes foreign-fund shares held by foreign residents.[6] It is neither a complete global fund universe nor simply a total owned only by U.S. households and institutions.
03 · PRIVATE CREDIT AND FUNDING
The pension and insurance connection is now visible
The latest ownership table puts state and local government employee pension funds at $186.0 billion and private pension funds at $88.7 billion. Combining the two gives the $274.7 billion pension total. Dividing by the table's $649.5 billion of shares produces approximately 42.3%.[3]
Households and nonprofits hold $144.6 billion, life insurers $92.1 billion, and rest-of-world investors $86.8 billion. State and local governments outside the separately identified pension category hold $28.3 billion; other financial businesses hold $23.0 billion.[3]
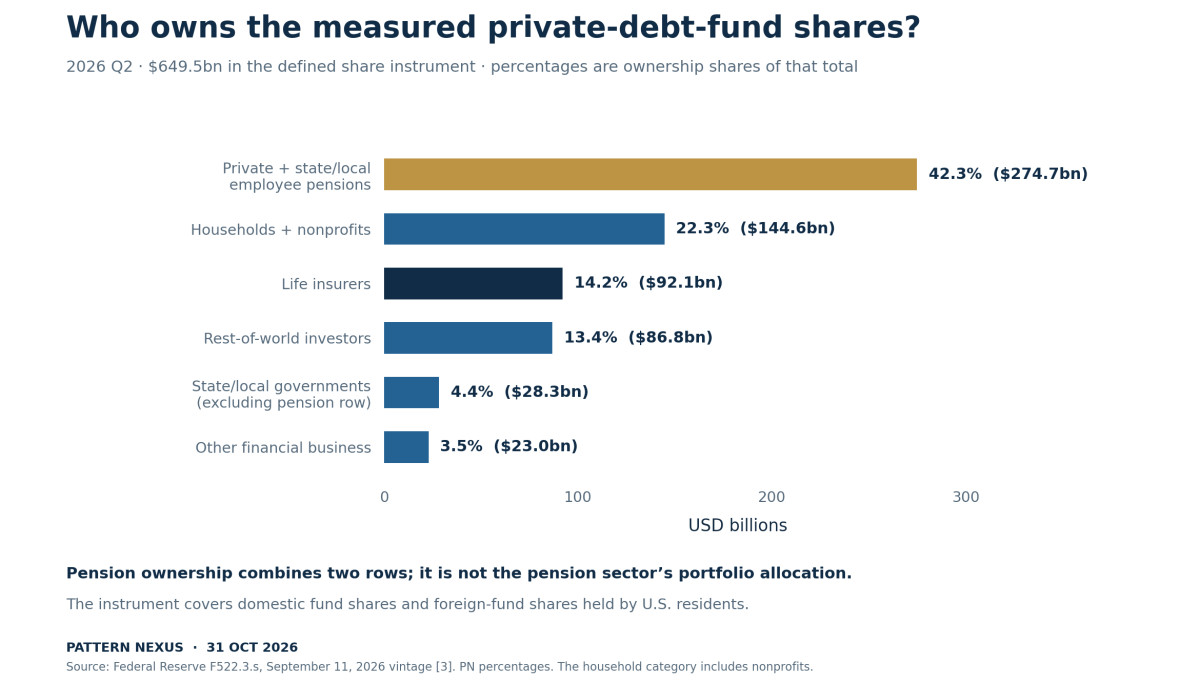
The funding relationship extends beyond a fund manager and its borrowers. Some of the equity capital belongs to institutions that make retirement payments, insure long-term obligations, or manage assets for households. Their constraints affect how much additional capital they can commit and how long they can wait for money to return.
That is the route I want to follow. A weaker outcome at a lending vehicle first changes the value or timing of an investment. The consequences then depend on the investor's wider portfolio, available liquidity, liabilities, and contractual commitments.
The table does not reveal every investor's terms or identify which pension owns which underlying corporate loan. It establishes a sector-level connection. Turning that connection into an institution-specific risk assessment requires another layer of evidence.
04 · PRIVATE CREDIT AND FUNDING
Ownership share is only the first denominator
The 42.3% figure answers who owns the measured private-debt-fund shares. It does not say that pension funds have 42.3% of their assets invested in private credit. The 14.2% insurer figure likewise describes the ownership of this instrument, rather than the allocation of the insurance industry's entire portfolio.
For an individual institution, I would need at least three denominators: the exposure relative to total assets, the possible loss relative to its available financial cushion, and the near-term cash demand relative to its liquid resources. A large position in dollars can be manageable in a large balance sheet. A smaller position can be consequential when cash resources are already committed elsewhere.
There is also an instrument boundary. This table measures private-debt-fund shares. It does not capture every way an insurer or pension could finance private borrowers, including direct loans and other instruments outside the fund-share category. Nor does it supply the investor composition of every BDC or interval fund.
Adding household pension entitlements to pension fund holdings would create another problem. Those are related claims at different levels of the system. Household exposure can be indirect through a pension without being a second, independent investment in the same underlying loan.
The useful question becomes more precise: how much exposure sits at each institution, which part can absorb losses, and which obligations require cash on a particular date? The new ownership table helps locate the institutions. Their own disclosures are needed to complete the assessment.
05 · PRIVATE CREDIT AND FUNDING
The fund balance sheet has several financing layers
For U.S.-domiciled private debt funds, the second-quarter sector table reports $935.0 billion in financial assets, $423.7 billion in liabilities, and $511.4 billion in shares. Published rounding leaves a $0.1 billion difference between the sum of those financing components and the asset total.[5]
The liabilities include $238.4 billion of loans. Depository loans account for $149.9 billion, with $88.6 billion classified as other loans and advances. A further $185.2 billion sits in miscellaneous liabilities.[5] The total liability figure cannot simply be labeled bank borrowing.
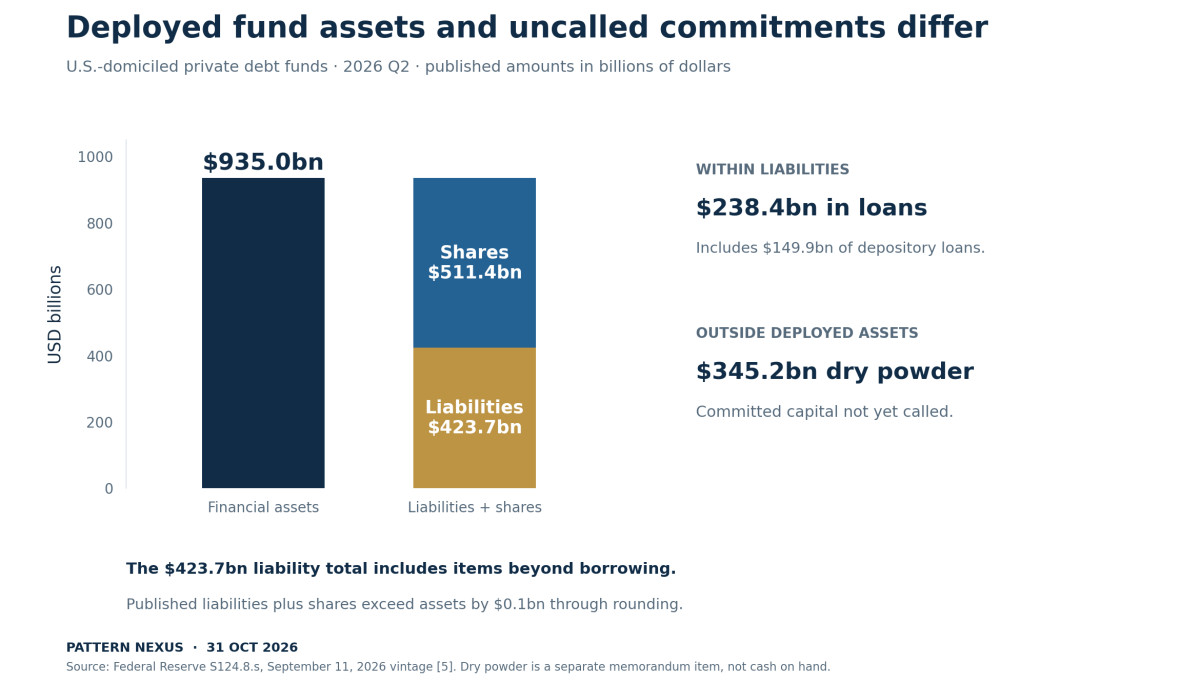
The capital structure determines the order in which pressure reaches different parties. Shareholders hold a residual interest. Fund lenders have separate contractual claims, potentially with collateral and covenants. An investment loss at the asset level does not automatically become an equal percentage loss for every funding source.
The asset composition also matters. This sector holds private loans alongside bonds, equities, deposits, and other claims. Treating the entire financial-asset total as a portfolio of identical senior direct loans would lose the detail the new tables were designed to provide.
The sector aggregate does not show the distribution of leverage among funds. Averages can combine lightly financed vehicles with others using more borrowing. They also combine liabilities with different maturities and protections. A reliable stress assessment would need the actual capital structure and asset mix of the fund being analyzed.
06 · PRIVATE CREDIT AND FUNDING
Banks can remain connected after lending moves elsewhere
Moving loan origination outside a bank does not require the bank to leave every part of the financing chain. It can lend to the vehicle that owns the corporate loan.
In her May 8 remarks, Vice Chair for Supervision Michelle Bowman described bank connections to nondepository financial institutions through revolving facilities and term lending. She also emphasized that the nonbank category contains institutions with very different activities and funding structures.[7]
The new fund balance sheet gives one concrete view of that connection through depository lending. It does not tell us which specific banks are exposed, whether a loan is drawn against investor commitments or portfolio assets, or how much additional lending is contractually available.
Those details determine the cash channel. A facility might help a fund bridge capital calls. Another arrangement might finance an investment portfolio. The collateral, maturity, lender protections, and ability to draw vary by agreement. A deterioration in one type of collateral need not have the same consequence for another facility.
There are two bank questions to monitor separately. The first concerns credit losses on outstanding exposure. The second concerns liquidity if funds draw existing facilities or need to refinance. A bank could face additional funding demand before it recognizes a loss, while a fund could face restricted financing without its bank lender suffering a principal loss.
The table identifies an exposure channel. Evidence of actual stress would come from drawings, maturities, covenant developments, collateral changes, and bank disclosures. It cannot be established from the existence of the relationship alone.
07 · PRIVATE CREDIT AND FUNDING
A portfolio loss and an investor loss can differ
Consider a simplified vehicle with $100 million in assets, $40 million of debt, and $60 million of investor equity. Assume the debt remains at $40 million, there are no fees or distributions, and any asset-value change passes directly into equity.
A 10% decline in the asset portfolio reduces assets to $90 million and equity to $50 million. The equity loss is $10 million, or 16.7% of the original $60 million. A 20% portfolio decline leaves $40 million of equity, a 33.3% decline in that equity interest.
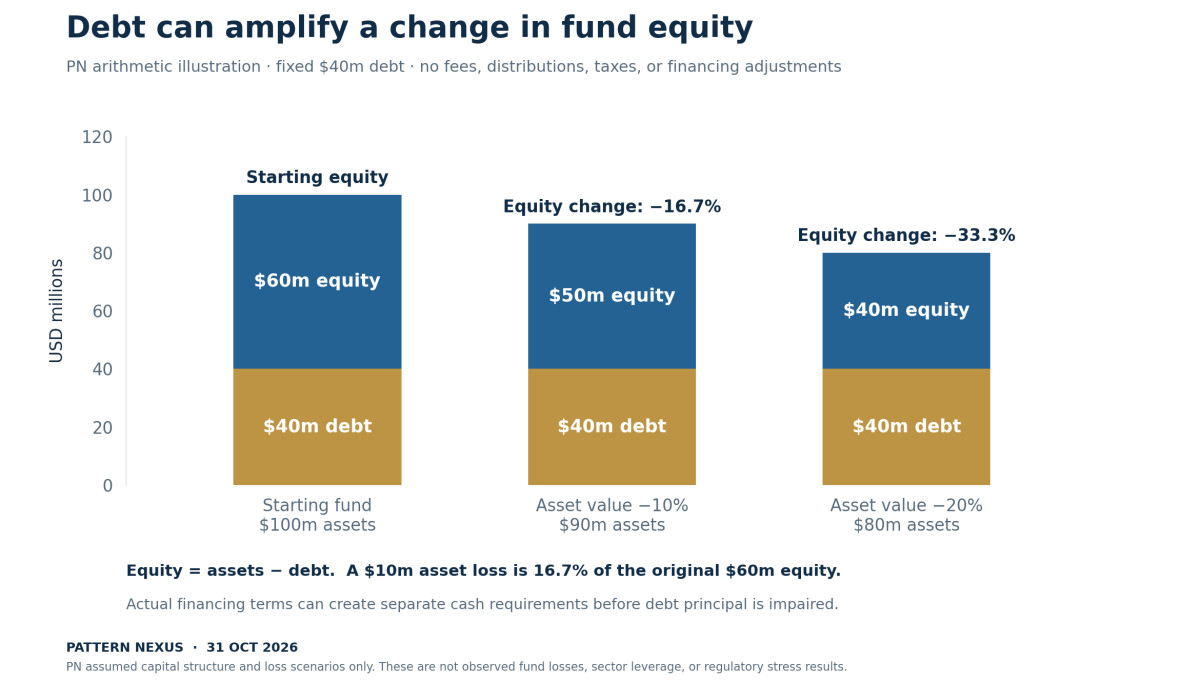
These are PN illustrations, with deliberately simple assumptions. They are not estimated losses for the Fed's fund sector, a named pension, or an insurer. Actual results depend on the fund's assets, financing, fees, valuation practices, and contractual structure.
The arithmetic explains why the underlying loan exposure and the investor's fund-share exposure should be kept separate. The equity can absorb a greater percentage decline than the portfolio. Creditors can remain whole across some range of asset losses, although a particular financing agreement may create cash or collateral requirements before that range is exhausted.
Now follow the equity loss to its owner. The effect on a pension depends on how large the position is relative to the plan and how its funding obligations are determined. The effect on an insurer depends on its broader assets, liabilities, capital position, and applicable treatment. Applying the portfolio decline directly to every downstream institution would bypass all of those steps.
This is why a map of ownership is valuable but insufficient. It shows where to examine the next balance sheet. It does not make the intervening capital structures disappear.
08 · PRIVATE CREDIT AND FUNDING
Committed capital can be a future demand for cash
Private debt funds commonly raise commitments and draw the money over time. Investors typically cannot redeem at will before the fund ends. The Fed's sector description distinguishes deployed assets from capital that has been committed but remains uncalled.[8]
The U.S. private-debt-fund table reports $345.2 billion of dry powder as a separate second-quarter memorandum item, outside the financial assets shown above.[5] It is not an additional $345.2 billion of cash already sitting in fund bank accounts. It is also not a forecast that the entire amount will be called immediately.
An institutional investor therefore needs to manage both its existing investment and the cash it may still owe under the commitment. The investment can be illiquid while the remaining commitment creates an obligation to supply cash according to the agreement.
The IMF's 2024 analysis identified capital calls as a potential liquidity channel for pension funds and insurers.[9] That is historical analytical context, rather than evidence of a new October 2026 funding emergency. The current Fed table supplies a newer view of the uncalled commitments associated with this domestic fund sector.
Capital calls should not be described as automatic demands to replace every dollar of a loan loss. Calls can fund new investments, expenses, or other permitted uses; the rights and limits come from the agreement. A particular investor's unused commitment and notice terms are necessary inputs.
The mechanism becomes consequential when planned cash receipts weaken while existing commitments continue. A well-funded investor can absorb that variation. A tightly budgeted investor may need to change another part of its portfolio or reduce its willingness to make new commitments.
09 · PRIVATE CREDIT AND FUNDING
Slower distributions can move the pressure upstream
A lending fund can pay investors from interest, principal repayments, asset sales, and other realizations, subject to its financing and distribution arrangements. The investor may have included those expected receipts in its own cash plan.
When receipts arrive later than expected, the investor can face a timing problem even if the underlying investment still has substantial value. A fund extension, delayed refinancing, or slower realization can affect the cash schedule without first producing an enormous reported loss.
Here is a hypothetical cash budget for an institutional investor over one planning period. It begins with $150 million of liquid resources, expects $100 million of distributions, must meet $150 million of existing capital calls, and faces $60 million of other net cash outflows. That leaves a $40 million cushion.
If distributions are only $20 million while the other assumptions remain unchanged, the same budget ends $40 million short. The $80 million reduction in distributions consumes the cushion and creates a separate $40 million financing need.
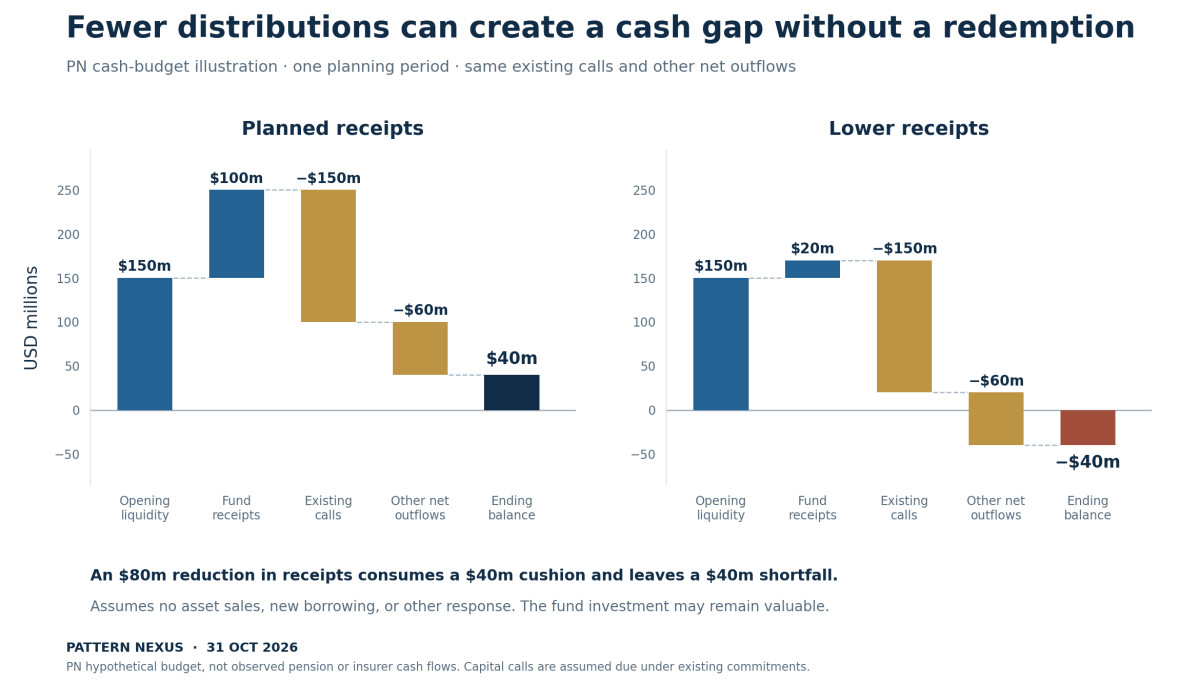
This example contains no assumed investor redemption from a closed-end fund. The pressure arises because the asset owner expected cash to return while other obligations came due. It also assumes no new borrowing, portfolio sales, or other management response; those would change the result.
That is my main forward-looking hypothesis: a period of weaker private-credit cash generation could first become visible through asset-owner liquidity decisions and smaller future commitments. Potential observations include secondary sales, greater reliance on liquid holdings, or reduced allocations to the next fund vintage.
None of those responses would, by itself, prove distress. An investor can sell a fund interest as ordinary portfolio management. The stronger evidence would be a documented combination of lower distributions, due commitments, reduced liquidity, and an unusually costly response.
10 · PRIVATE CREDIT AND FUNDING
Redemption risk depends on the vehicle
PN's earlier BCRED liquidity-mismatch article, published March 3, examined the interaction of redemption requests and limited exit capacity.[10] That work concerns a different funding structure from the traditional commitment-based private debt fund described above.
Interval funds are legally closed-end funds, but they offer periodic repurchases of a limited portion of shares. The SEC's investor bulletin explains that requests can exceed the offer and be prorated.[11] Publicly traded BDC shares, periodic-repurchase products, and traditional private fund interests therefore have different exit mechanics.
The Fed's May 2026 Financial Stability Report documented stronger redemption requests in certain semi-liquid private-credit vehicles. At that time, it assessed the financial-stability risks from further requests as limited and manageable, while identifying a possible effect on future credit availability.[12] That dated assessment should not be relabeled as an October guarantee.
| Structure | Main investor exit or funding issue | Financial question |
|---|---|---|
| Traditional private debt fund | Capital is committed; ordinary redemption is generally unavailable | Can investors meet calls while waiting for distributions? |
| Interval fund | Periodic, limited repurchase offers | How much requested liquidity can the offer satisfy? |
| Perpetual-life nontraded BDC | Repurchases depend on its program and terms | How do accepted repurchases compare with inflows and available liquidity? |
| Exchange-traded BDC | Investors can generally sell shares in the market | How does market pricing affect financing and investor outcomes? |
The common label “private credit” does not supply a common withdrawal promise. Applying the redemption behavior of one structure to all of them would produce the wrong stress model. Equally, locked capital does not eliminate investor-level cash obligations elsewhere in the chain.
11 · PRIVATE CREDIT AND FUNDING
Retirement exposure does not imply an immediate benefit cut
For a defined-benefit pension, the household's claim is a promise calculated under the plan, rather than a direct ownership interest in each investment. The Fed's sector descriptions distinguish those entitlements from defined-contribution balances and the assets held by the pension itself.[8]
A weaker investment outcome can affect a plan's funding position and future contribution decisions. The size and timing depend on plan rules, valuation methods, employer finances, and the rest of the portfolio. It does not follow that one fund markdown produces an equal reduction in the next benefit payment.
That leaves a possible longer route into public finances. If a public plan eventually needs additional contributions, its sponsor may have to accommodate that need alongside other budget demands. Whether that happens, and on what scale, requires plan-specific funding and cash-flow evidence. The national ownership percentage cannot establish it.
Life insurers also have to be analyzed through their own balance sheets. A fund-share position is one asset among many. Its duration, liquidity, and capital implications need to be considered alongside the obligations the insurer has written and the resources available to meet them.
The household category adds another caution. The Fed combines households and nonprofits in the ownership table. It does not identify a uniform pool of small retail investors. Direct fund-share ownership and indirect exposure through an institution can also have very different financial consequences.
The research opportunity is to connect these layers carefully. “Pensions own the funds” is a starting observation. The next step is identifying which plans or insurers have a meaningful exposure, which cash obligations are approaching, and what resources can absorb a delay or loss.
12 · PRIVATE CREDIT AND FUNDING
The improved map still contains estimates
The Fed constructed the new sectors using confidential SEC Form PF data and additional sources. Private debt funds are not simply available as one preexisting, perfectly identified category: classification uses information about strategies, names, and other databases. Some annual reports are imputed and interpolated into quarterly observations.[1]
Borrower-sector allocations also involve estimation where direct borrower detail is unavailable. The published intermediation chain is a sector-level statistical construction. It does not identify an exact loan-by-loan path from every beneficiary to every borrower.
The value of the improvement remains substantial. We can distinguish the private debt fund from its investors and from the loan it makes. We can also see related instruments that were previously omitted or attributed elsewhere. The uncertainty belongs in the precision of the conclusions, rather than being a reason to ignore the tables.
Quarter-to-quarter share values need similar discipline. The measured fund-share total fell from $689.4 billion at the end of 2025 to $649.5 billion in June 2026.[3] The difference alone is not an investment return or a measure of redemptions. The Financial Accounts distinguish transactions, revaluations, and other changes in volume.[13]
Likewise, a reported stock of outstanding loans is not a period's lending flow. Growth in that stock does not reveal gross originations, refinancing, repayments, or losses without the corresponding information.
For this article, the October publication is the news event, the September release is the statistical vintage, and June is the latest observed quarter used in the tables. Keeping those dates attached prevents the appearance of an October real-time balance sheet that the sources do not provide.
13 · PRIVATE CREDIT AND FUNDING
Three paths to watch
The following are conditional paths, not probability-weighted forecasts. A single institution could move between them as its cash position or investment outcomes change.
| Path | Conditions | Likely place to look first |
|---|---|---|
| Patient funding absorbs losses | Modest impairments, sufficient liquidity, manageable commitments | Lower returns and selective portfolio adjustments |
| Cash planning becomes restrictive | Distributions disappoint while commitments and other outflows remain due | Asset-owner liquidity, secondary sales, and smaller new commitments |
| Financing pressure compounds credit deterioration | Asset losses interact with tighter facilities, refinancing needs, or repurchase demand | Credit agreements, bank drawings, fund liquidity, and borrower refinancing terms |
The first path is economically plausible because patient capital can hold difficult assets through a period when other lenders might have to sell. A lender may also restructure a loan with a borrower and recover more over time than an immediate sale would produce.
The second path is the one I think deserves more attention. It can develop without a dramatic run on a traditional fund. An investor that needs more readily available assets may become less willing to commit to another illiquid vehicle. The effect could emerge in future fundraising and the supply of refinancing rather than in today's redemption statistics.
The third path requires additional triggers. A valuation decline alone does not establish a facility breach, and a drawdown alone does not establish a bank loss. The concern would become stronger if deteriorating credit, constrained cash, and contractual financing pressure appeared together.
That combination would matter for the next borrower seeking capital. A business can face more expensive or less available financing because its lender's funding becomes constrained, even if the business itself has not yet missed a payment. Establishing that connection would require lending and borrower evidence, rather than an inference from ownership shares.
14 · PRIVATE CREDIT AND FUNDING
The next reporting cycle can test the argument
I would track the loan, fund, asset-owner, and bank layers with separate measures. That keeps a change in valuation from being mistaken for a cash movement or a change in investor behavior.
| Layer | Evidence to monitor | What would strengthen the cash-pressure thesis |
|---|---|---|
| Borrower | Cash interest, amendments, refinancing terms, nonaccruals | Weaker cash servicing and longer repayment schedules |
| Fund | Cash distributions, available liquidity, commitments, financing maturities | Lower cash sent to investors while funding needs persist |
| Pension or other capital provider | Contributions, benefits and other outflows, uncalled commitments, liquid assets | A narrowing cash cushion and a costly portfolio response |
| Insurer | Relevant asset disclosures, liquidity, liability behavior, capital | Exposure becoming material relative to resources and obligations |
| Bank | Outstanding loans, undrawn facilities, drawings, collateral, credit performance | Funding demand or credit deterioration beyond routine variation |
| New lending | Fundraising, commitments, deal terms, borrower access | Smaller funding capacity translating into tighter financing |
The strongest evidence would connect several consecutive steps. A fund reports lower distributions; an investor documents a liquidity response; subsequent commitments fall; lending capacity becomes more restrictive. That sequence would support the mechanism much more strongly than a single prominent default.
The thesis would weaken if distributions remained dependable, investors maintained ample liquid resources, and new commitments continued without unusual financing costs. It would also weaken if apparent pressure proved to be ordinary portfolio rotation with no effect on available credit.
Loss allocation deserves its own test. Investor markdowns, fund borrowing, and bank credit performance should be observed separately. A period of lower investor returns with stable lender performance would show the capital structure absorbing losses as intended.
No single national exposure ratio can replace those checks. The new tables provide a better starting map and a consistent vocabulary for comparing evidence as it arrives.
PATTERN NEXUS VIEW
The Pattern Nexus view
The Fed has made the intermediation chain more visible. Business borrowing can now be connected to identifiable lending vehicles and the institutions financing them. The next analytical step is to follow both the value of those claims and the timing of the cash they generate.
My working view is that the less obvious transmission route runs through the capital provider's next decision. An institution waiting longer for distributions may still be solvent and may still expect eventual recovery. It can nevertheless become more selective about making another commitment.
That response can reach the real economy through the next loan or refinancing. The sequence could be gradual: weaker cash realization, more conservative portfolio budgeting, less fresh committed capital, and tighter borrower terms. Each link is observable in principle, and each needs evidence.
This extends the PN liquidity framework into the ownership chain. Aggregate funding can look substantial while the usable cash available to a particular institution becomes constrained. The relevant questions are who must pay, when payment is due, which assets can supply the money, and what financing remains available.
The new map does not establish an impending collapse. It gives us a clearer way to identify the balance sheet where the next financial constraint might appear.
READER QUESTIONS
Reader questions
Did the Fed uncover five percentage points of newly issued debt?
The revision improves the classification and coverage of existing borrowing in the historical accounts. It should not be interpreted as a matching amount of new loans issued when the tables were released.[1]
Do pension funds have 42.3% of their assets in private credit?
That percentage is the combined pension ownership share of the defined private-debt-fund share instrument. An individual pension's allocation requires its own total assets and exposure disclosures.
Is every private-credit fund exposed to the same redemption pressure?
The exit terms differ. Traditional commitment-based funds generally lock up capital, while interval and other periodic-repurchase vehicles offer constrained exit arrangements. The financing model must match the actual vehicle.
Is dry powder cash already held by the fund?
In the private-debt-fund table it is committed but uncalled capital, reported separately from the deployed financial assets. It represents potential future funding under the agreements, rather than cash already received.
Would a fund loss immediately cut someone's pension?
A defined-benefit promise, the pension's investments, and its contribution requirements are separate parts of the analysis. Effects depend on the plan's finances and rules. A fund loss alone does not establish an immediate benefit change.
Can there be a cash problem without a run on a closed-end fund?
Yes. An investor can receive less cash than planned while its commitments and other obligations remain due. The hypothetical cash budget demonstrates that timing channel without assuming a redemption right.
Does the new dataset predict which institution will fail?
It maps sector-level claims and improves measurement. Institution-specific conclusions require exposures, contracts, liquidity, capital, and cash-flow information that the aggregate tables do not supply.
METHOD AND EVIDENCE
Method and evidence boundaries
Research cutoff: October 31, 2026. Reported financial stocks use the Federal Reserve's September 11, 2026 release and observations through 2026 Q2. The October 16 research note generally illustrates its discussion with year-end 2025 data. Historical research and May assessments retain their dates.
Figure 1 calculates ownership percentages using $649.5 billion as the denominator. Pension holdings combine the private pension and state/local employee pension rows. Rounded holder values sum to $649.5 billion; rounded domestic and foreign issuer components sum to $649.6 billion. No extra exposure is inferred from that $0.1 billion rounding difference.
Figure 2 describes U.S.-domiciled private debt funds. Its domestic scope differs from the share instrument and from all-vehicle private-credit loan totals. Liabilities are not all loans. Dry powder remains a separate memorandum item. Published asset, liability, and share totals can differ by $0.1 billion through rounding.
Figures 3 and 4 are PN arithmetic illustrations. Their leverage, losses, cash receipts, and obligations are assumed inputs. They are not observed sector losses, pension budgets, forecasts, regulatory stress tests, or recommendations about portfolio allocation.
The loss and liquidity mechanisms, conditional paths, and proposed sequence into future lending are PN analysis. The source tables identify connections; they do not establish that the adverse paths are currently occurring. No failure probability, price target, or spending multiplier is assigned.
SOURCES
Research and Data Sources
Federal Reserve tables and technical descriptions establish the measured claims and their scope. Dated official research supplies context. PN calculations, hypotheses, and illustrative scenarios are identified separately.
- Federal Reserve Board — Brinkman and coauthors. Introducing Private Credit into the Financial Accounts of the United States. October 16, 2026. Integration methodology, historical debt revision, estimation limits, and sector-level intermediation. Its examples generally use 2025 Q4.
- Federal Reserve Board. Financial Accounts Guide — Release Highlights. 2026 Q2 release, September 11, 2026. Introduction of new private-credit sectors and instruments; historical data beginning 2012 Q4.
- Federal Reserve Board. F522.3.s — Private debt fund shares. September 11, 2026 vintage; through 2026 Q2. Investor and issuer amounts. Ownership percentages are PN calculations from the 2026 Q2 column.
- Federal Reserve Board. F4.4.s — Private credit loans. September 11, 2026 vintage; through 2026 Q2. Loan instrument by borrower and holder sector; domestic nonfinancial subtotal is a PN sum.
- Federal Reserve Board. S124.8.s — Private debt funds. September 11, 2026 vintage; through 2026 Q2. U.S.-domiciled private debt fund financial assets, liabilities, shares, and separate dry-powder memorandum item.
- Federal Reserve Board. Financial Accounts table descriptions — Instruments. September 11, 2026 vintage. Scope of private credit loans and private debt fund shares, including cross-border coverage.
- Michelle W. Bowman / Federal Reserve Board. When Regulation Reshapes Markets: The Migration of Corporate Lending. May 8, 2026. Attributed description of nonbank diversity and connections with banks through loans and facilities.
- Federal Reserve Board. Financial Accounts table descriptions — Sectors. September 11, 2026 vintage. Commitment-based private debt fund structure and the treatment of pension entitlements and plan types.
- International Monetary Fund. Global Financial Stability Report, Chapter 2 — The Rise and Risks of Private Credit. April 2024; historical analytical context. Capital-call liquidity channel, multilayer financing, and limits to risk assessment; no current crisis inferred.
- Pattern Nexus. BCRED Redemptions Spike: The Private Credit “Liquidity Mismatch” Goes Live. March 3, 2026 publication metadata. Related public PN work on redemption and repurchase capacity; this article separately examines traditional fund commitments.
- SEC Office of Investor Education and Advocacy / Investor.gov. Investor Bulletin: Interval Funds. September 25, 2020; accessed October 31, 2026. Periodic limited repurchase offers and possible proration; educational staff publication.
- Federal Reserve Board. Financial Stability Report — Funding Risks, including Developments in Private Credit. May 2026; dated assessment. Semi-liquid vehicle redemption developments and the contemporaneous assessment of risks and credit availability.
- Federal Reserve Board. Financial Accounts — Explanatory Notes. September 2026 release framework. Distinguishes outstanding stocks, transactions, revaluations, and other changes in volume.
Public research on credit, capital providers, and the cash obligations connecting them. This article is available free, without a premium or registration gate.
Article overview
New Federal Reserve tables connect private-credit loans with their vehicles and capital providers. PN follows pension and insurer ownership, fund borrowing, capital commitments, and the cash pressures that could shape the next lending cycle.
What's Your Reaction?
 Like
0
 Dislike
0
 Love
0
 Funny
0
 Wow
0
 Sad
0
 Angry
0

Nexus (Christopher)
Founder of Pattern Nexus. I research markets, macro, geopolitics, AI, history, ancient systems, and the patterns most people overlook. I’m also building Market Radar, a trading scanner designed to read pressure, risk, confirmation, and setup quality before ch…
Related research

The Diesel Trap: Why the Oil War Is Bending Sanctions Before Winter
The October Russia-sanctions waiver adds a new policy chapter to the Pattern Nexus oil-war thesis. I connect the diesel bottleneck to emerg…
5 shared topics, same research avenue.
The Oil War Is Becoming a Global Economic War
An extensive Pattern Nexus reconstruction linking the Iran/Hormuz disruption with Ukrainian refinery attacks, diesel shortages, Saudi pipe…
5 shared topics, same research avenue.
Fed Just Hiked Into a 5% 10-Year: Why the Next Liquidity Cycle May Arrive Faster
The Federal Reserve just raised the federal-funds target to 3.75%–4.00% while the 10-year Treasury closed at 5.01%, the 30-year at 5.35%, a…
6 shared topics.
QE 2026, Phase Two: When the Long End Forces Duration Control
The Fed already ended QT and expanded Treasury holdings through bill-focused reserve-management purchases, but that repaired the reserve la…
5 shared topics, same research avenue.
August CPI Just Activated the Fed’s One-Hike Option—and Deepened the Long-End Trap
August CPI rose 0.4% on the month and 3.4% from a year earlier, while core CPI rose a hotter-than-expected 0.3% even as its annual rate eas…
5 shared topics.
The Capital Ladder: Where $100 to $1 Trillion Places You in the Global and American Wealth System
A deep Pattern Nexus regression and data analysis mapping where net worth levels from $100 to $1 trillion place an individual within the gl…
6 shared topics, same research avenue.
Fed Minutes: The Cut Trade Broke Because Inflation Has More Than One Engine
The June 16–17 FOMC minutes, released July 8, show a Fed that held rates steady but removed the easy easing bias. The deeper signal is that…
5 shared topics.
What If the 6–7% Treasury Yield Trade Is the Trap?
A lot of smart money is starting to position for a 1970s-style inflation repeat where the 10-year Treasury yield spikes toward 6% or 7%. Th…
5 shared topics, same research avenue.
Comments (0)
Security Check
Please complete the captcha to verify you are human.