

Ample Reserves, Uneven Liquidity
Aggregate reserves can support rate control while funding conditions differ by institution. PN examines October research, overnight-rate distributions, Treasury cash, reserve management, and settleme…
Jump to a section
The New York Fed's October 15 reserve-demand estimate described aggregate reserves as abundant. Research published by Federal Reserve staff the following day showed why bank-to-bank lending can reveal distributional frictions that a broad reserve total or headline fed funds rate does not capture.[1][2]
The current evidence calls for a more detailed funding dashboard. It does not establish a hidden banking crisis. My working view is that an emerging access problem could appear first in the price and timing of marginal borrowing, even while the largest market segment and the aggregate reserve assessment remain calm.
Aggregate reserve supply is assessed against demand and rate sensitivity.
Balances and funding needs differ across institutions.
Counterparties, collateral, and operating terms determine the available channel.
Funds must arrive through settlement before the obligation is due.
01 · RESERVES AND MARKET FUNDING
Ample is a relationship between supply and demand
A reserve total is a stock of balances. Whether it is ample depends on how that supply compares with demand and how sensitive overnight rates become when the supply changes.
The New York Fed's reserve-demand-elasticity research estimates that sensitivity. Its October 15 update reported an estimate very small and statistically indistinguishable from zero, consistent with abundant reserves. The feature is a research estimate, rather than an official determination by the FOMC or the Federal Reserve System.[1]
That is useful evidence about the aggregate market. It does not describe every bank's cash position, every dealer's financing capacity, or every institution's ability to obtain settlement funds at a particular hour.
In his March discussion of reserve management, Roberto Perli described an ample system in which individual banks can still borrow to smooth reserve distribution and manage intraday positions.[12] Ordinary intermediation and modest rate variation are compatible with an ample framework. The analytical task is to identify when that variation becomes persistent, costly, or difficult to accommodate.
My starting point is therefore two questions. Is the total supply sufficient for effective rate control? And can the institutions that need funds obtain them on workable terms? The first question gives the system-wide context. The second helps locate a possible constraint within it.
Those questions require different evidence. A falling aggregate balance is worth monitoring, but it is not enough to establish scarcity. A higher rate paid by one institution may reflect its own circumstances, rather than a shortage across the entire banking system.
02 · RESERVES AND MARKET FUNDING
The latest overnight rates show a range of prices
The October 28 implementation note maintained interest on reserve balances, or IORB, at 3.90%, the standing repo rate at 4.00%, and the federal funds target range at 3.75%–4.00%, effective October 29.[4]
The latest overnight observations retrieved from the New York Fed's API are for October 29. EFFR was 3.88%, two basis points below IORB. SOFR was 3.94%, four basis points above it. The published 99th-percentile rates were 3.94% for fed funds and 4.02% for SOFR.[5]
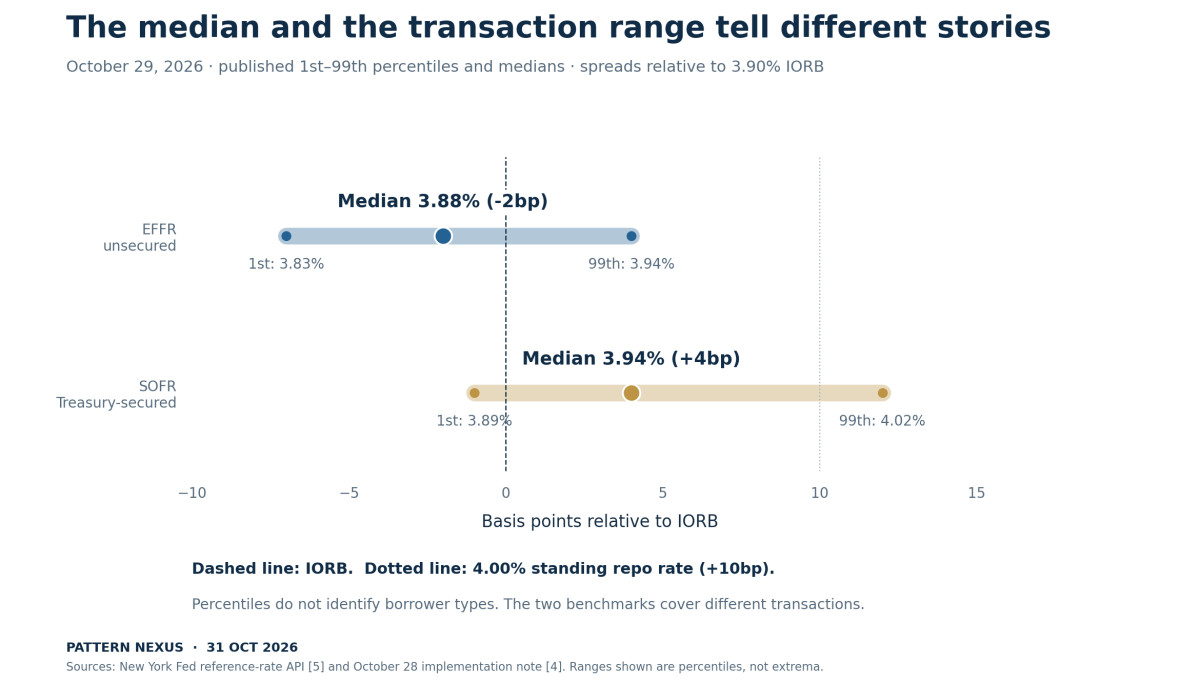
The range is part of the information. A median tells us where the middle of transaction volume trades. Percentiles show more of the price distribution, although they still do not identify which institutions face which terms.
EFFR and SOFR also cover different transactions. EFFR measures overnight unsecured federal funds borrowing. SOFR measures the cost of overnight borrowing secured by Treasury securities.[6][7] Their relative prices can reflect collateral supply, intermediation, balance-sheet costs, and different participants. A positive SOFR spread to IORB is not, by itself, a finding of banking-system scarcity.
The 99th percentile is neither the maximum rate nor a statement that every borrower in a particular category paid that price. A SOFR percentile above the standing repo rate also does not identify the reason for that trade or prove that an eligible counterparty was unable to use the Fed operation.
The observation date matters. Overnight reference rates are published for the prior business day. The API's SOFR averages and index can carry a later date than the underlying overnight-rate observations. Mixing those records would give the impression of a newer transaction print than the data actually contain.
03 · RESERVES AND MARKET FUNDING
Who trades can change what the headline tells us
The October 16 FEDS Note, by Sriya Anbil, Sebastian Infante, and Zeynep Senyuz, separates fed funds activity by lender and borrower type. It describes a market dominated by Federal Home Loan Bank lending and borrowing by U.S. branches of foreign banks, alongside a smaller domestic interbank segment.[2]
FHLBs cannot earn IORB. Lending below that rate can still provide them a return on balances that would otherwise be unremunerated. An eligible bank borrowing below IORB can earn a spread, subject to its own costs and constraints. That transaction can be attractive without being driven by an urgent shortage of liquidity at the borrower.
Domestic bank borrowing can have a different purpose. It may be used to manage a cash need or a change in reserve distribution. The research finds that lending between banks is more sensitive to reserve positions than the nonbank-lender segment. Its empirical figures include a sample running from October 2015 through January 2024.[2]
This is a historical research result published in October 2026, rather than a new daily measure proving that small banks are currently under stress. Its contribution is diagnostic: the same headline market contains transactions motivated by different incentives.
That limits how much reassurance a single rate can provide. A stable aggregate rate can coexist with a change in a smaller segment. It also limits how much alarm we should infer from an isolated transaction. We need to know the participants, volumes, persistence, and context.
04 · RESERVES AND MARKET FUNDING
A median can stay put while a smaller segment gets more expensive
The New York Fed calculates EFFR as a volume-weighted median of eligible reported overnight transactions.[6] A median is useful for summarizing a market, but it does not have to move whenever a minority of trading volume becomes more expensive.
Consider a PN illustration with $100 billion of volume. Assume $90 billion trades eight basis points below a reference rate and $10 billion trades five basis points above it. The volume-weighted median is eight basis points below the reference rate.
Now keep the $90 billion segment unchanged, but raise the smaller segment's price to fifteen basis points above the reference. The median stays where it was, even though the smaller segment's rate has increased by ten basis points.
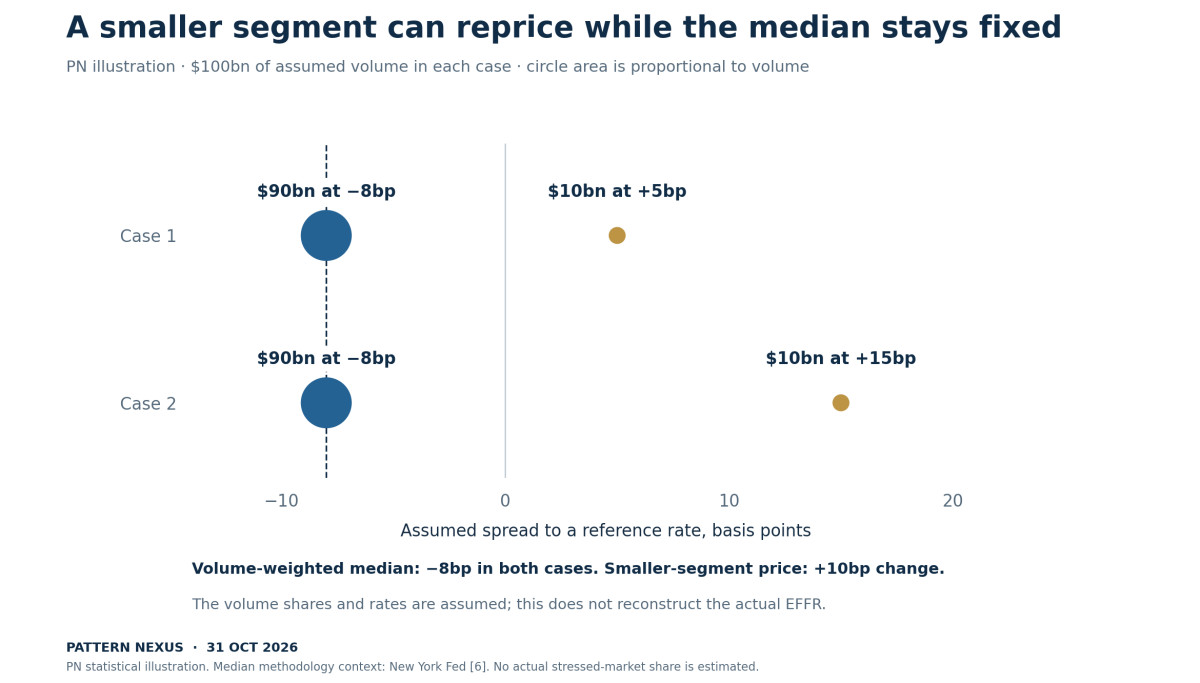
These are assumed volumes and spreads. They do not reproduce the October 29 EFFR calculation or estimate the size of a stressed domestic bank segment. The example demonstrates a property of the statistic, rather than an empirical finding about current market conditions.
The practical response is to examine more than the median. Published percentiles and volumes can add context. Institution-level or participant-level data would be more informative still, where available. A public dashboard cannot infer the identity of a borrower from a rate percentile alone.
This is the angle I think deserves closer attention: a smaller segment can provide an early signal without yet moving the central price of the largest segment. To turn that possibility into a current conclusion, the signal needs to persist and be supported by evidence about actual funding demand or constraints.
05 · RESERVES AND MARKET FUNDING
The reserve decline needs a balance-sheet explanation
The October 29 H.4.1 release reports Wednesday reserve balances of $2.895 trillion for October 28. Its weekly-average measure was $2.894 trillion, down $68.837 billion from the preceding week's average.[3] Those are different observations, even though the rounded levels are close.
In the weekly-average comparison, the Treasury General Account rose $47.725 billion. Other nonreserve deposits rose by a net $15.743 billion, calculated from the published deposit and TGA changes. Changes in currency, reverse repos, other absorbing factors, and reserve-supplying factors complete the reconciliation.[3]
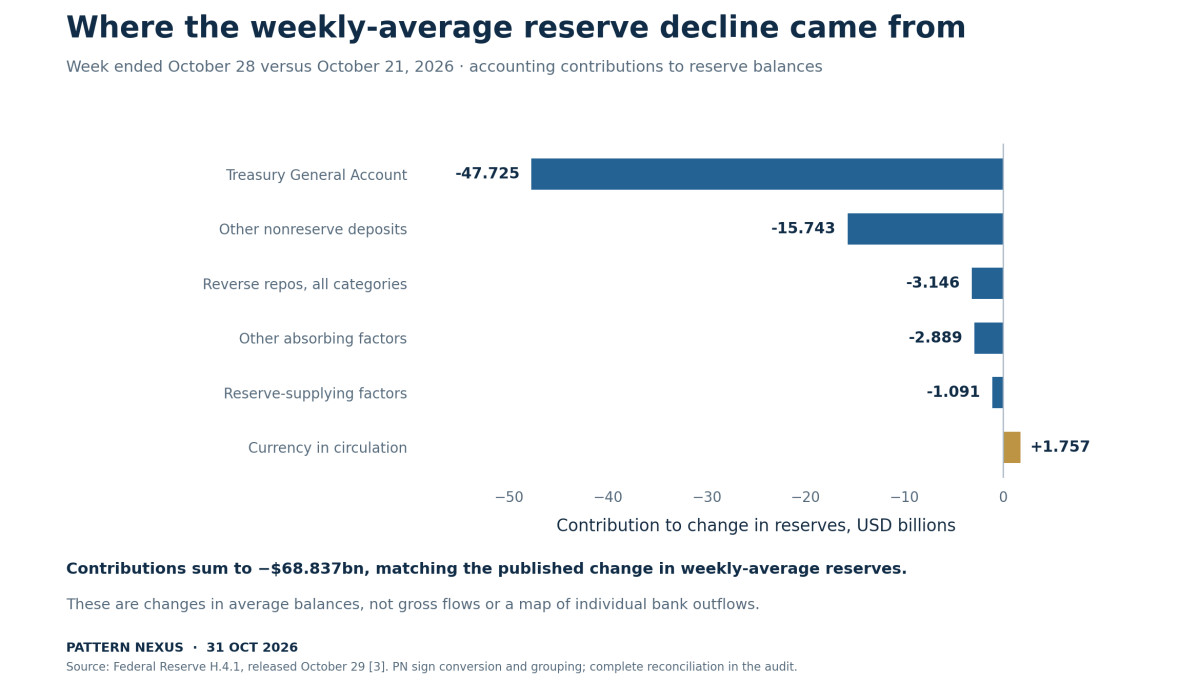
The chart translates those published changes into their contributions to reserve balances. It is an accounting reconciliation of changes in weekly averages, not a record of gross cash flows or an estimate of which individual banks lost reserves.
A reserve decline does not automatically mean quantitative tightening has restarted. A movement between liabilities on the Fed's balance sheet can change reserves while the relevant securities policy remains unchanged. Treasury balances, currency, and deposits held by other entities all matter.
The October 15 reserve-demand estimate predates this October 28 balance-sheet observation. It should not be treated as a real-time test of that later week's conditions. The correct approach is to use the earlier aggregate assessment as context and then monitor how prices and market behavior respond to subsequent changes.
For this week, the balance sheet explains the reserve movement. It does not establish that the movement caused a distributional funding problem. That additional claim would require additional evidence.
06 · RESERVES AND MARKET FUNDING
Treasury cash and reverse repo need their own definitions
Treasury cash management can move reserve supply independently of a new monetary-policy decision. When a payment to Treasury is funded from a bank deposit, settlement can reduce the bank's reserve balance and increase the TGA, holding other factors constant. Treasury spending in the other direction can add reserves and customer deposits.
The aggregate result depends on the financing path and the other changes occurring at the same time. If a money fund reallocates from the Fed's overnight reverse repo operation into bills, the reserve effect need not match a bill purchase funded directly from a bank deposit. A one-variable rule cannot describe every combination.
The reverse-repo line also needs a scope check. On October 28, H.4.1 shows $325.837 billion of total reverse repos, of which $325.661 billion belongs to foreign official and international accounts. The remaining “Others” category is $176 million.[3] The large total should not be described as the domestic money-fund ON RRP buffer.
This is a recurring problem with liquidity summaries. Several different accounts can be compressed into one familiar label, and the resulting number is then assigned a role it does not actually measure.
PN's Liquidity Framework & Market Plumbing follows reserves, Treasury flows, collateral, repo, and intermediary capacity together.[13] The current data reinforce the need to preserve those separate definitions. A useful aggregate signal still needs a map of the transactions and institutions behind it.
07 · RESERVES AND MARKET FUNDING
Plenty in total does not guarantee access at one bank
Reserve balances are held within the banking and settlement system. They are not a pool that every household, company, or investment fund can draw from directly. A customer's bank deposit and its bank's reserve balance are different claims.
When funds move between banks, reserve balances can move as part of settlement. That redistributes the existing aggregate pool. Bank lending also involves the creation of deposits and subsequent funding and settlement requirements; it should not be modeled as a bank handing its reserve account directly to a household borrower.
Now consider a deliberately simple three-bank illustration. The system has $100 billion of reserves: Bank A holds $80 billion, Bank B $15 billion, and Bank C $5 billion. Assume each bank wants an internal $20 billion buffer. Total reserves exceed the combined desired buffers, but two banks are below their own targets.
If Bank A is willing and able to transfer only $10 billion through the modeled lending relationships, with $5 billion reaching each of the other banks, the balances become $70 billion, $20 billion, and $10 billion. Aggregate reserves remain $100 billion. Bank C remains $10 billion below its desired buffer.
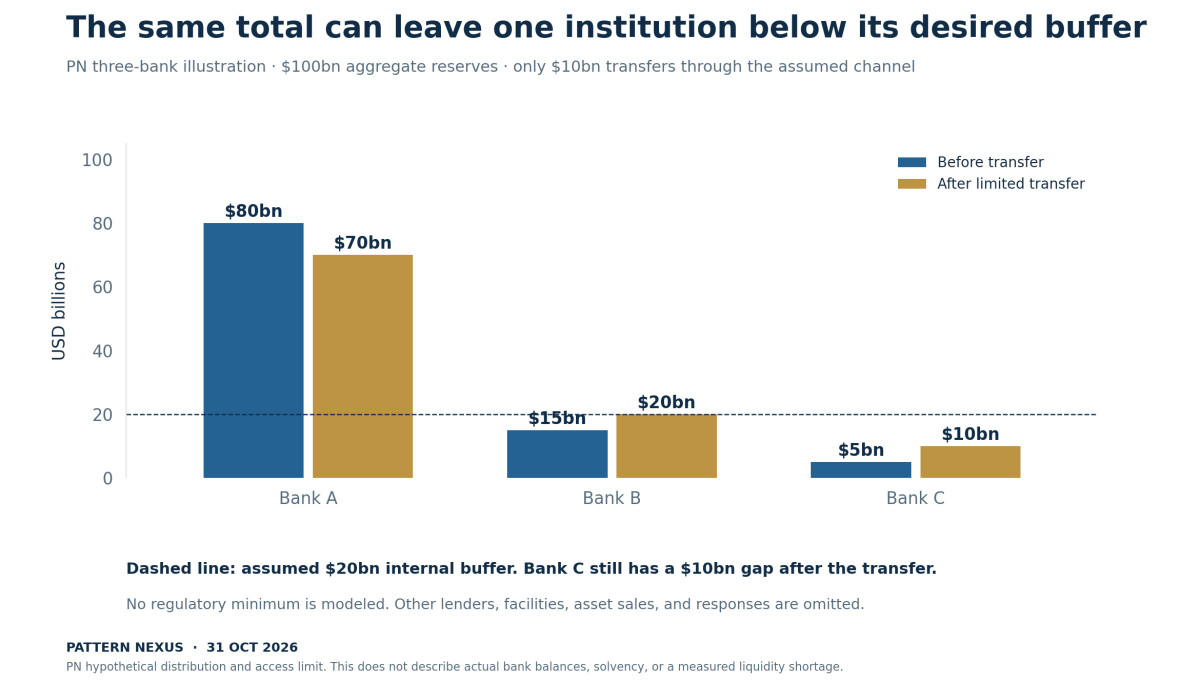
The assumed buffer is not a regulatory reserve requirement, and the transfer limit is not estimated from real banks. The example isolates an access constraint. It deliberately leaves out other banks, central bank borrowing, collateral sales, and management responses that could resolve the gap.
In an actual market, the constraint might involve a credit limit, the price a lender requires, collateral, operational readiness, or payment timing. Which explanation applies cannot be read from the aggregate total. Nor does being below an internal target establish insolvency.
The question is whether available channels can redistribute or supply liquidity before obligations become due, and at what cost. That is the link between an aggregate reserve assessment and the experience of a particular institution.
08 · RESERVES AND MARKET FUNDING
A standing facility works through eligibility and settlement
The standing repo operation provides an important financing channel, but its operation has specific terms. The New York Fed's current FAQs identify eligible counterparties and securities, two daily operation windows, a 4.00% rate, and same-day settlement through the tri-party platform.[10]
Counterparty status also requires legal, operational, and technical setup. The eligibility page specifies institutional and balance-sheet criteria, together with arrangements to receive cash in the tri-party market.[11] The published rate is therefore one part of the transaction.
A firm that is not directly eligible may depend on a bank or dealer to intermediate the funding. That intermediary has to be able and willing to do so. Eligible collateral, available balance sheet, counterparty relationships, and the time remaining before a payment is due can affect the terms.
This helps explain why a standing operation can support rate control without mechanically fixing every private transaction at its rate. It also explains why a trade above that rate does not identify one unique cause. The borrower, collateral, timing, and operational path need to be examined.
Facility usage needs context in both directions. Occasional use can be consistent with the intended functioning of an ample framework. Low use does not establish that every institution has plentiful access to every funding channel. More informative evidence would combine take-up, market rates, timing, collateral, and conditions facing the relevant borrowers.
For the current article, there is no institution-specific claim that an eligible bank was denied funding. The mechanism is an explanation of what must be checked before drawing such a conclusion.
09 · RESERVES AND MARKET FUNDING
Reserve support is adjustable, and the current purchase pace is zero
The Fed retains authority to add securities when appropriate to maintain ample reserves. That authority is different from a commitment to purchase a fixed amount every month.
For October 15 through November 13, the New York Fed's operational schedule lists approximately $14.6 billion of reinvestment purchases and no reserve-management purchases.[8] Reinvestment and an additional reserve-management purchase are separate operations; the planned reinvestment amount should not be relabeled as a fresh $14.6 billion reserve expansion.
In September, Perli explained that reserve-management purchases had been set to zero since mid-August as the Desk revised its supply outlook and assessed market conditions. He also said the amounts could be adjusted again as those conditions evolved.[9]
The October implementation note continues to authorize appropriate purchases of bills and, if needed, other Treasury securities with short remaining maturities. It also directs Treasury principal rollover and agency principal reinvestment into bills.[4] That describes the operating framework; it does not override the published monthly schedule.
The important forecast question is what would prompt another adjustment. A changed reserve-supply outlook, a change in reserve demand, and a sustained deterioration in relevant money-market conditions would provide different kinds of evidence.
It would be premature to infer a restart date from one weekly reserve decline. It would be equally misleading to treat the current zero pace as a permanent promise. The documented framework is conditional, and the next schedule and market response should be checked together.
10 · RESERVES AND MARKET FUNDING
A June operational event shows a third source of pressure
Reserve supply and distribution are not the only issues. Funds also have to arrive when the settlement system needs them.
In his September speech, Perli described an operational issue at DTCC at the end of June. A faulty trade submission prevented transactions from settling and cash from returning to member banks. Deposits held by DTCC at the Fed stayed higher, producing an unexpected, short-lived reduction in bank reserve balances.[9]
He also said the ample framework accommodated the surprise without broader disruption and cautioned against drawing sweeping conclusions from the event. The episode is evidence that settlement timing can affect reserve availability. It is not evidence that the same problem is ongoing or that the framework failed.
The analytical implication is broader than that single incident. A balance can exist somewhere in the system while remaining unavailable to the institution expecting it at a particular time. Operational delay can therefore resemble a cash need even when the underlying assets and claims remain intact.
That creates three different monitoring problems: a system-wide quantity problem, a distribution or access problem, and a timing or operational problem. They can interact, but they call for different evidence and potentially different responses.
Adding reserves can help with a quantity shortfall. An access constraint may require an effective financing relationship. An operational delay requires the relevant transactions and settlement processes to work. A diagnosis that treats all three as the same event can miss the mechanism that actually needs attention.
11 · RESERVES AND MARKET FUNDING
The first effect on credit could be selective
A bank facing less dependable funding may become more cautious about a new commitment before it stops making payments. A dealer may require different terms to intermediate collateral. Another institution with stronger access may continue operating normally.
That is a conditional transmission channel, not a claim that the October observations already demonstrate broad credit contraction. The mechanism would run from a funding cost or timing problem into a balance-sheet decision, then into the terms offered to the next borrower.
It could appear as a wider financing spread, a smaller line, a greater collateral requirement, or more conservative liquidity management. Each outcome has other possible explanations, including borrower credit quality and ordinary changes in risk appetite. Establishing a reserve-distribution contribution would require evidence connecting the steps.
Adding settlement balances does not instruct a lender to approve a particular corporate loan. The lender still evaluates capital, credit risk, collateral, profitability, and funding.
The potential early signal is therefore unevenness. One funding segment can become more expensive while another remains stable. One type of borrower can face tighter terms while an aggregate benchmark barely changes. Tracking that variation is more useful than declaring all financing conditions easy or tight from a single reserve number.
The thesis would gain support if persistent funding differences were followed by documented changes in lender behavior. Without that sequence, it should remain a mechanism to monitor rather than a conclusion about the current economy.
12 · RESERVES AND MARKET FUNDING
Three paths through the next funding cycle
The paths below are conditional scenarios. They carry no assigned probabilities and are not predictions of a particular institution's failure.
| Path | Evidence that would fit | Interpretation to test |
|---|---|---|
| Ordinary redistribution | Brief calendar-related rate variation, functioning funding channels, quick normalization | The ample framework is accommodating routine needs |
| Persistent access constraint | Repeated pressure in particular segments while aggregate measures stay calm | The distribution and intermediation channels need closer examination |
| Broader reserve tightening | Greater aggregate rate sensitivity alongside persistent funding pressure | System-wide supply may be moving closer to a more binding part of demand |
The first path deserves real weight. A functioning market can price temporary needs and move funds without a policy change. A rate movement around a reporting date that reverses promptly can be consistent with ordinary balance-sheet management.
The second path is the central research question in this article. It would be supported by concentration: recurring pressure among particular participants or funding channels, accompanied by evidence that access or intermediation is becoming more restrictive. A calm headline median would not rule it out.
The third path requires broader confirmation. A more negative reserve-demand-elasticity estimate, changes in the relationship between rates and reserve supply, persistent funding pressure, and an operational response would provide a stronger case than a weekly balance decline alone.
An operational interruption can cut across all three. Its timing, duration, and resolution need to be identified before it is interpreted as a change in reserve demand or borrower credit quality.
13 · RESERVES AND MARKET FUNDING
A dashboard that can test the argument
The dashboard should preserve the definition and observation date of each measure. A monthly estimate, a weekly average, a Wednesday stock, and a daily overnight rate are complementary observations, rather than one synchronized print.
| Measure | What it helps assess | Reading error to avoid |
|---|---|---|
| Reserve-demand elasticity | Aggregate rate sensitivity to reserve changes | Treating it as a test of every bank's access |
| EFFR relative to IORB | Headline unsecured overnight pricing | Assuming the median describes every participant |
| Published percentiles and volumes | More of the transaction-price distribution | Identifying borrower types from a percentile alone |
| SOFR relative to IORB and other repo rates | Secured funding and collateral-market conditions | Attributing every spread to reserve scarcity |
| H.4.1 reserves and other accounts | Accounting sources of changes in balances | Mixing daily stocks, weekly averages, and gross flows |
| Standing repo terms and use | Availability and use of a defined channel | Treating the posted rate as universal access |
| Purchase schedules and reinvestment | The actual operating plan | Turning retained authority into a fixed purchase forecast |
| Participant disclosures and settlement events | Access constraints and payment timing | Converting an isolated event into a system-wide diagnosis |
The strongest support for the access thesis would join several observations: persistent pressure in a relevant segment, evidence about the borrowers or intermediaries involved, and a documented financing or liquidity-management response.
The thesis would weaken if the apparent pressure normalized quickly, funding remained readily available, and participant evidence showed ordinary calendar effects. Broader reserve tightening would be a different conclusion requiring broader evidence.
The public data have a limit. Published rates and percentiles do not provide a live map of each domestic bank's reserve position and transactions. The historical research identifies useful channels; a public monitor has to be candid about which of those channels it can observe directly.
PATTERN NEXUS VIEW
The Pattern Nexus view
The reserve pool is one part of the liquidity system. Its distribution, the agreements connecting institutions, and the timing of settlement determine how that liquidity can be used.
The October research provides a concrete reason to examine who is trading beneath the headline fed funds rate. The balance sheet adds the fiscal and account-level movement. The operating documents explain where additional funding can enter and which participants can use it directly.
My working view is that the next useful warning could be a persistent difference in access before it becomes an obvious aggregate shortage. That would show up through prices, timing, financing relationships, and subsequent behavior. It is a testable hypothesis, not something established by the word “uneven” in a headline.
The same discipline applies to reassurance. Aggregate reserves can be abundant and the framework can work well, as the available research and operating accounts describe. The task is to keep watching the channels through which a particular institution obtains the funds it needs.
That is the addition to the PN liquidity map: quantity establishes the system's capacity; distribution and access determine where the next constraint might emerge.
READER QUESTIONS
Reader questions
Can reserves be ample while one bank needs to borrow?
Yes. Aggregate supply can be sufficient for rate control while individual banks redistribute balances to meet their own needs. Borrowing by itself does not establish a system-wide shortage.
Does a stable EFFR mean every bank has the same funding conditions?
No. EFFR is a volume-weighted median. A smaller segment can change price without moving that median. The hypothetical example illustrates that statistical property.
Does the latest reserve decline prove that QT restarted?
No. Changes in the TGA, currency, reverse repos, and other Fed accounts can move reserve balances. The current securities directives and purchase schedules must be checked separately.
Is SOFR above the standing repo rate proof that the backstop failed?
A transaction's eligibility, collateral, counterparty, timing, and settlement path need examination. A percentile above the posted rate does not identify one cause or establish that a particular eligible institution could not obtain funds.
Are reserve-management purchases continuing at a fixed monthly pace?
The October 15–November 13 schedule lists no reserve-management purchases and approximately $14.6 billion of reinvestment purchases. Future amounts depend on the Desk's assessment and published schedules.[8]
Are the three-bank and median charts real market data?
They are PN illustrations with explicitly assumed inputs. The October 29 rate distributions and the H.4.1 weekly-average reconciliation are the empirical figures.
What would make the distributional concern more convincing?
Repeated pressure in a relevant funding segment, evidence about the participants' constraints, and a documented response in financing or liquidity management. A one-day rate movement or one aggregate reserve decline is insufficient.
METHOD AND EVIDENCE
Method and evidence boundaries
Research cutoff: October 31, 2026. Overnight-rate data use October 29 effective dates from the New York Fed API snapshot. H.4.1 was released October 29 and reports October 28 Wednesday stocks and weekly averages. The reserve-demand update was released October 15. The empirical FEDS Note was published October 16 and draws on historical research samples.
Figure 1 displays published 1st and 99th percentiles with the volume-weighted median, expressed relative to the 3.90% IORB rate. These are percentile ranges, not minimum-to-maximum trading ranges. EFFR and SOFR measure different markets. Spread arithmetic uses 100 basis points per percentage point.
Figure 3 uses changes in weekly-average balances throughout. Its non-TGA deposit contribution is the total nonreserve-deposit change less the TGA change. “Other absorbing factors” combines Treasury cash holdings and other liabilities and capital. The contributions reconcile to the published $68.837 billion reserve decline.
Figures 2 and 4 use assumed inputs. Neither estimates an actual constrained bank, the share of stressed trading, or a regulatory buffer. The data audit preserves the observed inputs, calculation rules, dates, and illustrative assumptions. The New York Fed's API documentation supplies the retrieval framework.[14]
Distributional pressure, downstream credit effects, and the three future paths are PN analysis. No hidden institution, impending failure, fixed reserve-scarcity threshold, or probability of intervention is inferred. Historical research results and a dated aggregate assessment are kept separate from current observations.
SOURCES
Research and Data Sources
Official reserve, reference-rate, and operating documents establish the observed conditions. Dated research describes market structure. PN arithmetic and illustrations are identified separately.
- Federal Reserve Bank of New York — research feature. Reserve Demand Elasticity. October 15, 2026 update; accessed October 31. Dated qualitative aggregate reserve assessment. Research estimate, not an official FOMC or Federal Reserve System estimate.
- Federal Reserve Board — Sriya Anbil, Sebastian Infante, and Zeynep Senyuz. Ripples in the Reserve Pool: Unveiling Liquidity Signals from the Federal Funds Market. October 16, 2026. Participant differences and historical evidence on distributional frictions. Empirical figures include an October 2015–January 2024 sample; not a current bank-level stress reading.
- Federal Reserve Board. H.4.1 — Factors Affecting Reserve Balances. Released October 29, 2026; October 28 stocks and weekly averages. Observed reserve balances and their accounting factors. Wednesday stocks and changes in weekly averages are kept separate.
- Federal Reserve Board. Implementation Note issued October 28, 2026. Effective October 29, 2026. Target range, IORB, standing repo rate, rollover and reinvestment instructions, and conditional purchase authority.
- Federal Reserve Bank of New York. Markets Data API — latest reference rates. Snapshot retrieved October 31, 2026; overnight observations effective October 29. EFFR and SOFR medians, percentiles, and volumes; raw snapshot preserved in the audit.
- Federal Reserve Bank of New York. Effective Federal Funds Rate. Methodology page, accessed October 31, 2026. Unsecured-market scope, volume-weighted median, and prior-business-day publication.
- Federal Reserve Bank of New York. Secured Overnight Financing Rate. Methodology page, accessed October 31, 2026. Treasury-secured overnight financing scope; different from unsecured federal funds.
- Federal Reserve Bank of New York. Treasury Securities Operational Details. October 15–November 13, 2026 purchase period. Approximately $14.6bn planned reinvestment purchases and no reserve-management purchases for the stated period.
- Roberto Perli / Federal Reserve Bank of New York. Supplying Ample Reserves. September 22, 2026. Attributed explanation of the mid-August purchase pause, conditional reserve management, and the resolved end-June DTCC operational episode.
- Federal Reserve Bank of New York. FAQs: Standing Repurchase Agreement Operations. September 16, 2026 FAQ; accessed October 31. Counterparties, securities, operation windows, rate, and same-day settlement mechanics.
- Federal Reserve Bank of New York. Standing Repo Counterparties. Current eligibility and setup requirements, accessed October 31, 2026. Legal, operational and technical setup, eligibility criteria, and tri-party arrangements; inclusion is not evidence of stress.
- Roberto Perli / Federal Reserve Bank of New York. Reflections on the Early Days of Reserve Management Purchases and the Maintenance of Ample Reserves. March 26, 2026. Dated description of ample reserve conditions, individual bank borrowing, intraday management, and adaptive reserve supply.
- Pattern Nexus. Liquidity Framework & Market Plumbing. Public research hub, accessed October 31, 2026. Related PN flow map across reserves, Treasury flows, collateral, repo, and intermediary capacity; interpreted as PN analysis.
- Federal Reserve Bank of New York. Markets Data APIs — documentation. Documentation last updated June 12, 2026; accessed October 31. Public API retrieval framework and reference-rate records.
Public research on reserves, financing access, and the settlement system connecting them. This article is available free, without a premium or registration gate.
Article overview
Aggregate reserves can support rate control while funding conditions differ by institution. PN examines October research, overnight-rate distributions, Treasury cash, reserve management, and settlement timing to identify the next constraints to watch.
What's Your Reaction?
 Like
0
 Dislike
0
 Love
0
 Funny
0
 Wow
0
 Sad
0
 Angry
0

Nexus (Christopher)
Founder of Pattern Nexus. I research markets, macro, geopolitics, AI, history, ancient systems, and the patterns most people overlook. I’m also building Market Radar, a trading scanner designed to read pressure, risk, confirmation, and setup quality before ch…
Related research
Treasury’s Long-Bond Relief Could Bring a Faster Refinancing Cycle
Treasury’s larger long-end buybacks can improve trading today. PN follows the actual cash payments, September maturity data, and replaceme…
5 shared topics, 1 shared asset, same research avenue.
The Treasury Market Is Changing Its Gatekeepers
Treasury clearing deadlines are approaching. PN examines who gains from netting and cross-margining, how access and funding terms shape the…
4 shared topics, 1 shared asset, same research avenue.
Fed Just Hiked Into a 5% 10-Year: Why the Next Liquidity Cycle May Arrive Faster
The Federal Reserve just raised the federal-funds target to 3.75%–4.00% while the 10-year Treasury closed at 5.01%, the 30-year at 5.35%, a…
6 shared topics, 2 shared assets, same research avenue.
August CPI Just Activated the Fed’s One-Hike Option—and Deepened the Long-End Trap
August CPI rose 0.4% on the month and 3.4% from a year earlier, while core CPI rose a hotter-than-expected 0.3% even as its annual rate eas…
4 shared topics, 1 shared asset, same research avenue.
Two Economies, One Balance Sheet: The Unstable Barbell of 2026
Reserve support has returned, but real long rates, fiscal supply, and an AI-energy capital wave are splitting the U.S. economy between capi…
7 shared topics, 1 shared asset, same research avenue.
Treasury Turns Long-Bond Buybacks Into a Yield-Control Test
Treasury said it will raise maximum liquidity-support buybacks in the 10-to-20-year and 20-to-30-year nominal coupon sectors from $2 billio…
5 shared topics, 1 shared asset, same research avenue.
From Liquidity Storm to Chokepoint War: Auditing 472 Pattern Nexus URLs — What Landed, What Missed, and What Comes Next
I audited the public Pattern Nexus record across 472 unique URLs and the saved full-text article export, then rebuilt the major calls from …
4 shared topics, 1 shared asset.
The Dollar Fortress — Audio-Video Edition
Episode 2 of the Pattern Nexus Audio-Video series explains how Bretton Woods, the Marshall Plan, capital controls, the IMF, the World Bank,…
4 shared topics, 1 shared asset.
Comments (0)
Security Check
Please complete the captcha to verify you are human.