

September CPI: Inflation Is Running Hot—and the Oil Work Explains Why
September CPI rose 0.6% for the month and 3.7% over the year, with gasoline responsible for more than half the monthly increase. I connect the report to the earlier Pattern Nexus oil, inventory, diesel and fertilizer research, explain the damage to real wages, and update the Fed and liquidity sequence.
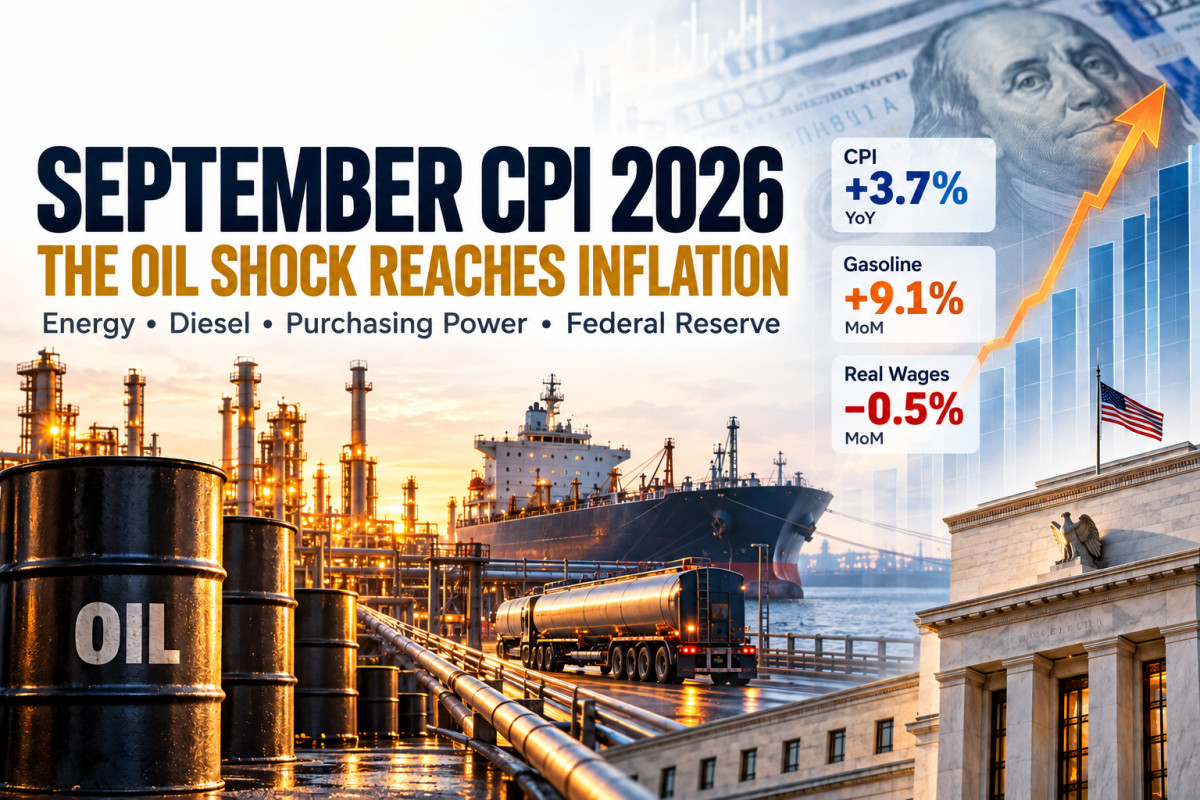
September CPI rose 0.6% for the month and 3.7% over the year, with gasoline responsible for more than half the monthly increase. I connect the report to the earlier Pattern Nexus oil, inventory, diesel and fertilizer research, explain the damage to real wages, and update the Fed and liquidity sequence.
Jump to a section
PATTERN NEXUS | ECONOMIC DATA DASHBOARD
September 2026 Inflation Snapshot
Energy inflation is accelerating while household purchasing power declines. The oil shock is now appearing directly in consumer prices.
Oil supply disruptions and depleted inventories are pushing fuel costs higher. Those costs move through transportation, production and household spending. Inflation remains elevated while the Federal Reserve maintains restrictive policy, increasing pressure on debt and refinancing.
Data: September 2026 CPI and real earnings, Bureau of Labor Statistics; EIA October 2026 Short-Term Energy Outlook. Sources and notes.
The oil shock is reaching the consumer basket
- The energy pressure is showing up in the CPI basket. September headline inflation rose 0.6% for the month and 3.7% over the year. Gasoline alone supplied more than half the monthly increase. [1]
- The upstream problem remains visible. The latest IEA and EIA reports describe tight diesel supplies and depleted inventories. Those are the pressure points the earlier PN oil research followed. [4] [5]
- Households are losing purchasing power. Real average hourly earnings fell 0.5% in September. A larger paycheck can still buy less when essential prices move faster. [3]
- The next stage still depends on transmission. Core CPI stayed firm, while grocery prices eased slightly. Fuel inflation is here; a broader food-price wave remains a risk to monitor. [1] [2]
I am not surprised inflation is running hot. We have spent months following the oil routes, the inventory drawdowns, the refining constraints and the pressure moving through diesel. When the machinery that produces and delivers physical goods becomes more expensive to operate, that cost eventually lands somewhere. September’s inflation report shows a substantial part of it landing in the consumer basket.
The useful question now is how far the pressure travels, how much purchasing power it takes out of households, and how the Federal Reserve responds while the financing system is already carrying higher costs. That is the connection running through my oil work and the previous CPI update. I want to bring those pieces together, because looking at the inflation report by itself leaves out the process that produced it.
Data through October 14, 2026. This update covers September prices, released October 14.
Follow the physical supply chain into prices, household demand and liquidity
The six numbers that matter in this release
Headline CPI
+0.6% in September
The monthly increase accelerated from August.
Annual CPI
+3.7%
The twelve-month headline rate rose from 3.4%.
Gasoline
+9.1% in one month
More than half of the overall monthly rise came from gasoline.
Core CPI
+0.3% again
The annual rate increased to 2.6%.
Real hourly pay
−0.5% in September
Average hourly purchasing power fell.
U.S. diesel
$6.29 per gallon
EIA’s September average; a separate series from CPI fuel oil.
The headline accelerated, and energy did most of the lifting
The Bureau of Labor Statistics reported a 0.6% monthly increase in the Consumer Price Index, following 0.4% in August. The annual rate rose from 3.4% to 3.7%. Energy increased 5.2% in September, and gasoline rose 9.1%. BLS attributes more than half the monthly all-items increase to gasoline. That is a very specific composition: a large fuel shock is pushing the aggregate higher. [1]
| Measure | August monthly | September monthly | September annual |
|---|---|---|---|
| Headline CPI | +0.4% | +0.6% | +3.7% |
| Core CPI | +0.3% | +0.3% | +2.6% |
| Energy | +2.1% | +5.2% | +20.4% |
| Gasoline | +3.9% | +9.1% | +34.2% |
| Fuel oil | +10.1% | +15.3% | +74.2% |
| Shelter | +0.3% | +0.4% | +3.2% |
| Food | +0.1% | 0.0% | +2.5% |
| Food at home | 0.0% | −0.1% | +1.8% |
Source: BLS September 2026 CPI release. Monthly changes are seasonally adjusted; annual changes are not seasonally adjusted. Categories overlap. “Core” excludes food and energy; “food at home” means groceries. [1] [2]
Look at the difference between fuel and food. Gasoline and fuel oil rose sharply, while the grocery index declined slightly. A claim that everything suddenly accelerated would miss what the report actually says. The immediate inflation impulse is concentrated in energy, with additional firmness elsewhere. That gives us a clearer starting point for asking what reaches the rest of the economy next.
The oil articles already described the route into inflation
In The Oil Cushion Is Breaking, published June 1, I followed the buffer between disrupted supply and forced repricing. Storage, emergency reserves and alternative routes can keep deliveries moving while the underlying system becomes less flexible. That breathing room changes the timing of a shock. It also makes the condition of the inventories important even when a price chart temporarily settles down. [8]
The Oil Inventory War Machine, published August 2, examined the same problem through location, product availability and delivery time. A barrel in storage only helps if it can reach the refinery or customer that needs it. The relevant question is whether the system can replace the missing flow at a usable cost. [10]
Then The Oil War Is Becoming a Global Economic War, published September 21, connected the Gulf disruption with Russian refining and the diesel market. Different conflicts can converge on the same fuel supply, affecting freight, construction and agriculture. September CPI gives us another observation consistent with the fuel-price leg of that framework. It does not identify the exact share attributable to each conflict. [13]
For readers following the monetary side, the sequence continues through the August CPI update and the September Fed-hike follow-up. Those pieces connect the inflation pressure to restrictive financing and the possibility of a later liquidity response. This release belongs inside that existing sequence. [11] [12]
The latest energy reports still show a constrained system
The IEA’s October 14 report estimates that observed global oil stocks ended September 509 million barrels below end-February. In September alone, on-land inventories fell 113 million barrels while oil on water rose 103 million. It also reports global diesel exports about 700,000 barrels per day below a year earlier, with losses from Russia and the Middle East only partly offset elsewhere. [4]
That distinction between land storage and oil in transit matters. A cargo can exist in the global inventory count while still requiring transport, unloading and processing before it supplies a particular customer. A smaller fall in the aggregate does not automatically mean the immediately available buffer has recovered. [4] [10]
EIA’s October outlook reports September U.S. retail averages of $4.35 a gallon for gasoline and $6.29 for diesel. East Coast distillate inventories were 32% below their five-year seasonal average. EIA also raised its fourth-quarter Brent forecast to $105 a barrel, while projecting lower prices during 2027. That outlook used inputs finalized October 1 and excludes subsequent market events, including the October 2 G7 announcement. [5]
Those figures describe different parts of the same problem: consumer fuel prices, regional product availability and the cost of securing replacement supply. A truck, a farm or a contractor needs a usable product delivered on time. Higher U.S. production and profitable export opportunities can coexist with expensive fuel for American customers, because domestic producers and refiners operate inside globally connected markets.
Core inflation added another month of pressure
Core CPI increased 0.3% in September, matching August, while its annual rate rose from 2.4% to 2.6%. Shelter rose 0.4%, services excluding energy rose 0.4%, and core goods increased 0.3%. Communication prices declined 0.2% after August’s 2.3% increase, yet the aggregate core reading remained firm. The previous month’s communications jump therefore cannot explain away the whole September result. [1] [2]
The earlier CPI article identified persistence as the next test. September supplied another firm monthly core reading. Using the published rounded monthly changes, July–September core inflation ran at approximately 3.2% annualized, compared with about 2.0% over June–August. The equivalent headline rates rose from about 0.4% to 4.5% as June’s decline left that three-month window. These are approximate momentum calculations, not forecasts. [2] [11]
| Three-month window | Headline, annualized | Core, annualized |
|---|---|---|
| June–August 2026 | About 0.4% | About 2.0% |
| July–September 2026 | About 4.5% | About 3.2% |
The new information is that recent core momentum strengthened alongside the energy shock. CPI alone cannot tell us how much of each service or goods increase came from fuel, wages, margins, tariffs or another input. The transmission argument needs continued evidence from costs and pricing. The Fed also defines its 2% inflation objective using PCE prices, so a core CPI rate should not be treated as the same measurement. [14]
The fertilizer and food risks operate on a different clock
The Fertilizer Strait, published July 24, examined how energy and fertilizer costs could affect later production and food access. Nitrogen fertilizer depends heavily on natural gas; farming and distribution depend on fuel, machinery, transport and financing. Those inputs enter at different points in the growing and delivery cycle. A disruption today can affect purchasing decisions or application rates before it affects a harvest. [9]
September grocery CPI fell 0.1%, and the overall food index was unchanged. That is the current observation. It means the broad U.S. grocery basket did not experience a new monthly price surge in this release. The forward food risk still has to be tested against fertilizer availability, actual farm costs, planting, weather, inventories and crop outcomes. [1] [2]
Businesses also have choices before every higher input becomes a higher shelf price. They can use inventory, absorb costs in margins, change suppliers or reduce output. Buyers can cut purchases. Strong harvests and restored shipping can relieve pressure. The reason to keep watching fertilizer is that some decisions are made months before the food is sold, and later improvement in the input market may arrive after those decisions.
Real wages show why hot inflation can weaken demand
The companion BLS earnings release makes the household effect clear. Average hourly earnings rose 0.1% in September, while CPI rose 0.6%. Real average hourly earnings consequently fell 0.5% for the month and were 0.7% below a year earlier. Real average weekly earnings also fell 0.5% during September. These are aggregate averages, but they show purchasing power being squeezed. [3]
A household still has to get to work, keep the lights on and maintain the property. When those costs absorb more of the paycheck, something else has to give. That can mean fewer discretionary purchases, deferred repairs, lower saving or greater reliance on credit. Higher essential prices can therefore weaken demand in other parts of the economy.
This is how inflation and slowing activity can develop together. The economy does not need an accelerating consumer boom for a supply disruption to raise fuel costs. The cost increase can become one of the reasons spending weakens afterward. The IEA’s latest forecast also has global oil demand declining during 2026, which is consistent with the need to examine demand damage alongside supply constraints. That remains a forecast. [4]
The Fed has already used the hike option
The August CPI article put the possibility of another hike directly into the framework. The Fed subsequently raised its target range by a quarter point to 3.75%–4.00% on September 16. September CPI now adds a larger headline increase and another firm core month to the evidence policymakers will assess. Further tightening remains possible; this report alone does not determine the next decision. [6] [11]
The policy problem has two sides. Higher rates can restrain spending, credit and the willingness to pass on further price increases. They can help prevent a supply shock from becoming embedded in expectations and repeated pricing decisions. But they also increase financing costs for businesses and households already paying more for essential inputs.
A rate hike cannot quickly replace refinery capacity or make a disrupted shipping route dependable. Its influence works largely through financial conditions and demand. That is why the composition of this report matters: the Fed is responding to inflation whose largest immediate contributor came through fuel, while core persistence gives it an additional reason to stay restrictive.
Hot CPI can prolong the pressure that eventually creates a liquidity problem
In the September hike follow-up, I focused on the interaction between policy tightening and the long end of the Treasury market. Mortgages, long-duration investment and refinancing depend on more than the overnight policy rate. Borrowers encounter the full financing structure as debt matures or projects need funding. Persistent inflation can make relief harder even as cash flow weakens. [12]
The debt effect develops through time. Old fixed-rate borrowing can remain insulated until it matures, while new borrowing faces current market rates. Unexpected inflation can reduce the real value of existing nominal claims, but refinancing at a higher yield can raise the cash cost of carrying debt. The interaction matters for households, businesses and the government.
This is also why I keep the price of money and the supply of reserves in the same picture. The September implementation note explicitly permits Treasury-bill purchases and, if needed, purchases of other Treasuries with three years or less remaining maturity to maintain ample reserves. Those operating instructions coexist with the higher policy-rate target. They are not an announced program to suppress long-term yields. [7]
My expectation remains that sufficiently serious funding or market stress would draw a public liquidity response. The next steps depend on the stress that actually develops. Repo support, reserve-management purchases and a broader duration-purchase program have different purposes and effects. September CPI strengthens the case for sustained inflation pressure; evidence of a financial break would have to come from the financing system itself.
Watch the supply recovery, the pass-through and the financing
The IEA reports a recovery in Gulf crude supply during September, alongside continued product-market constraints. That recovery matters. A sustained improvement in production, usable inventories, refining and delivered fuel costs would weaken the case for another prolonged inflation impulse. The important test is whether improvement reaches the products and customers under pressure. [4]
| What I am watching | Evidence of continuing pressure | Evidence of relief |
|---|---|---|
| Physical fuel supply | Further product-stock draws, expensive delivered diesel, repeated disruption | Reliable flows, rebuilt inventories and lower delivered product costs |
| Core inflation | Repeated firm readings across more categories | Sustained moderation in the monthly and multi-month trend |
| Food production costs | Persistent fertilizer and fuel stress during important buying and application windows | Improved input access, adequate application and strong crop outcomes |
| Household purchasing power | Further weakness in real earnings and essential-cost pressure | Wages outpacing prices over a sustained period |
| Financing | Restrictive long yields combined with deteriorating credit or funding conditions | Orderly refinancing, stable funding and lower inflation pressure |
The case for prolonged pressure strengthens if fuel remains expensive, core inflation stays firm and real incomes keep falling. It weakens if supply recovers enough to rebuild buffers while inflation momentum and financing conditions improve. Both paths can be evaluated through observable developments. There is no reason to turn a useful structural framework into a claim that every future outcome is already settled.
The next scheduled CPI release covers October and is due November 10 at 8:30 a.m. Eastern. Between releases, delivered fuel prices, product inventories and funding conditions help show which parts of the chain are moving. [1]
The upstream pressure is becoming a household expense
September’s report makes the connection easier to see. Gasoline supplied more than half the monthly inflation increase. Core remained firm. Real hourly purchasing power fell. The energy reports still show strained product supply and depleted buffers. These observations fit the route I have been following through the oil work, with the later food and financial consequences still dependent on what happens next. [1] [3] [4] [5]
I am watching whether the system can restore usable supply before the cost travels further, and whether households and borrowers can absorb the combination of expensive essentials and restrictive financing. Inflation can stay uncomfortable while the economy underneath it becomes weaker. That is why this CPI update belongs alongside the oil, diesel, fertilizer and liquidity research. The consumer price is one stage of a much longer process.
Questions readers may have
Why is September CPI an October release?
The reference month is September. BLS published the report on October 14, 2026. The October price report is scheduled for November 10. [1]
Does core CPI include gasoline?
Core CPI excludes food and energy. Fuel costs can still affect a business selling a core good or service, but the direct energy purchase is excluded. A firm core reading alone does not establish how much indirect energy pass-through occurred.
Does this release confirm a grocery-price shock?
The grocery index fell 0.1% in September. The fertilizer article describes risks that must be assessed through input availability, farm decisions and later production. This release does not establish that a broad grocery-price surge has arrived. [1] [9]
Does this mean another hike or QE is certain?
The report keeps further tightening in the policy debate. A later liquidity response depends on funding and financial conditions. The September implementation note allows short-Treasury purchases for ample reserves; it does not announce a new long-duration QE program. [6] [7]
Sources and notes
- U.S. Bureau of Labor Statistics. Consumer Price Index — September 2026. October 14, 2026.
- U.S. Bureau of Labor Statistics. September 2026 CPI Table A and expenditure categories. October 14, 2026.
- U.S. Bureau of Labor Statistics. Real Earnings — September 2026. October 14, 2026.
- International Energy Agency. Oil Market Report — October 2026, public highlights and analysis. October 14, 2026.
- U.S. Energy Information Administration. Short-Term Energy Outlook — October 2026. October 2026; model inputs finalized October 1.
- Federal Reserve. FOMC statement: target range raised to 3.75%–4.00%. September 16, 2026.
- Federal Reserve. Implementation note: ample reserves and short-Treasury purchases. September 16, 2026; effective September 17.
- Pattern Nexus. The Oil Cushion Is Breaking: Hormuz, Inventories, and the Liquidity Shock Hiding Inside Energy. Published June 1, 2026.
- Pattern Nexus. The Fertilizer Strait: Why the 2027 Food Shock May Already Be Forming. Published July 24, 2026.
- Pattern Nexus. The Oil Inventory War Machine: How Long the Global Buffer Can Hold. Published August 2, 2026.
- Pattern Nexus. August CPI Just Activated the Fed’s One-Hike Option—and Deepened the Long-End Trap. Published September 11, 2026.
- Pattern Nexus. Fed Just Hiked Into a 5% 10-Year: Why the Next Liquidity Cycle May Arrive Faster. Published September 17, 2026.
- Pattern Nexus. The Oil War Is Becoming a Global Economic War. Published September 21, 2026.
- Federal Reserve. What is inflation, and how does the Federal Reserve evaluate changes in the rate of inflation?. Methodology reference.
Official releases supply the reported measurements. The connections, outlook and monitoring framework are Pattern Nexus analysis. PN article dates above are displayed publication dates; the linked articles may include later updates.
Monthly CPI changes are seasonally adjusted; twelve-month changes are not seasonally adjusted. Three-month annualized calculations use the compounded product of the three published monthly factors, raised to the fourth power, minus one. Published monthly values are rounded, so calculations from unrounded index levels can differ. The charts show reported price changes rather than estimated causal contributions.
What's Your Reaction?
 Like
0
Like
0
 Dislike
0
Dislike
0
 Love
0
Love
0
 Funny
0
Funny
0
 Wow
0
Wow
0
 Sad
0
Sad
0
 Angry
0
Angry
0

Nexus (Christopher)
Founder of Pattern Nexus. I research markets, macro, geopolitics, AI, history, ancient systems, and the patterns most people overlook. I’m also building Market Radar, a trading scanner designed to read pressure, risk, confirmation, and setup quality before ch…
Related research

Iran: Escalation Ladder — Reactivation Enabled
The Iran escalation ladder is active again. I examine the October strike risk, the infrastructure-war danger, rising tanker attacks alongsi…
4 shared topics, 1 shared asset.
Two Economies, One Balance Sheet: The Unstable Barbell of 2026
Reserve support has returned, but real long rates, fiscal supply, and an AI-energy capital wave are splitting the U.S. economy between capi…
5 shared topics, same research avenue.
The Oil Inventory War Machine: How Long the Global Buffer Can Hold
A full Pattern Nexus reconstruction of U.S. and global oil inventories from the 1970s through the 2026 war shock, including original regres…
7 shared topics, same research avenue.
The Fed’s Long-End Trap: Why a 4.65% 10-Year Is Already Doing the Tightening
A full July 2026 data reconstruction of the Federal Reserve’s next policy path, showing how a 4.65% nominal 10-year, 2.44% real 10-year, Tr…
5 shared topics, same research avenue.
Gold Was Right. The 10-Year Was Early. The War Premium Changed the Rate Path.
The original Pattern Nexus gold call hit the structural move: gold was not just trading inflation, it was repricing liquidity, policy failu…
5 shared topics, same research avenue.
The Oil Cushion Is Breaking: Hormuz, Inventories, and the Liquidity Shock Hiding Inside Energy
Oil Crisis, Strait of Hormuz, Hormuz, Energy Shock, Inflation, Brent Crude, WTI Crude, Strategic Petroleum Reserve, SPR, Oil Inventories, G…
7 shared topics, 2 shared assets, same research avenue.
The New Fed Chair Does Not Inherit an Economy. He Inherits the Permission Stack.
Kevin Warsh is not simply inheriting the Federal Reserve. He is inheriting the control layer where inflation, debt service, Treasury fundin…
5 shared topics, same research avenue.
March Ends With the System Showing Its Seams
A Pattern Nexus end-of-March 2026 master analysis on Hormuz, oil repricing, liquidity stress, inflation pressure, AI infrastructure, Moon B…
4 shared topics, 1 shared asset.
Comments (0)
Security Check
Please complete the captcha to verify you are human.