
Sự sụp đổ ngân hàng đầu tiên của Mỹ vào năm 2026 — Không phải là một cú sốc, mà là một dấu mốc thời gian
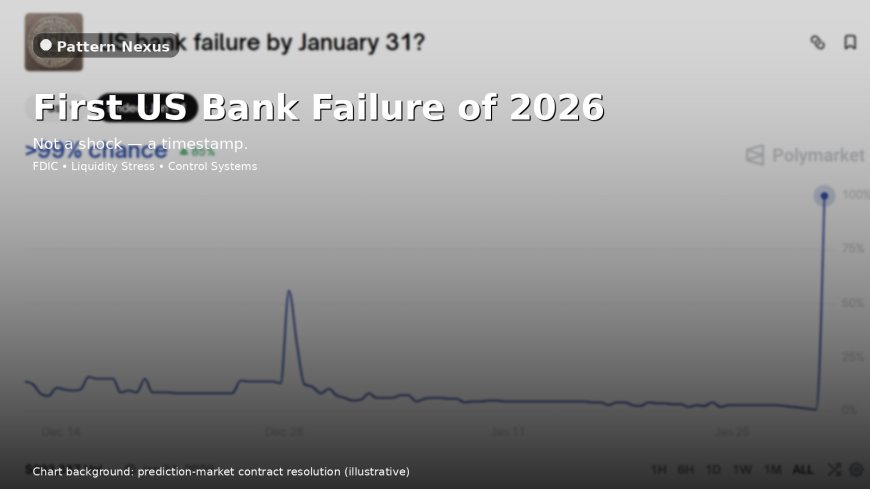
FDIC đã xác nhận vụ phá sản ngân hàng Mỹ đầu tiên của năm 2026 vào ngày 30 tháng 1. Điều này không phải là một bất ngờ — đó là một dấu thời gian. Trong khuôn khổ Pattern Nexus, các vụ phá sản ngân hàng nhỏ là những dấu hiệu sớm của căng thẳng thanh khoản, chứ không phải là các sự kiện hệ thống tự nó.
![[HERO_IMAGE_ALT: banking stress / balance sheet / FDIC resolution]](https://patternnexus.com/uploads/images/202601/image_870x_697e33612e125.jpg)

The first failure is not “the crisis.” It’s the timestamp that tells you the liquidity regime is now producing real outcomes.
“Contained” is a resolution design goal, not a macro guarantee. What matters is whether failures cluster and whether funding spreads react.
QE isn’t just “printing.” It’s the system swapping duration and fragility for reserves and continuity when the private balance sheet can’t clear.
What Happened (Facts, Numbers, Timeline)
On Friday, January 30, 2026, Metropolitan Capital Bank & Trust (Chicago, IL) was closed by the Illinois Department of Financial and Professional Regulation. The FDIC was appointed receiver and entered into a purchase-and-assumption agreement with First Independence Bank (Detroit, MI) to assume substantially all deposits and acquire most assets.
![[IMAGE_FDIC_PRESS_RELEASE_ALT: FDIC press release screenshot]](https://patternnexus.com/uploads/images/202601/image_870x_697e337d3dced.jpg)
As of 9/30/2025: total assets ~$261.1M, total deposits ~$212.1M. First Independence agreed to assume substantially all deposits and purchase approximately ~$251M of assets. The FDIC retains remaining assets for later disposition. Preliminary estimated cost to the DIF: ~$19.7M. The FDIC explicitly noted this is the first bank failure of 2026.
![[IMAGE_BALANCE_SHEET_ALT: simple balance sheet summary graphic]](https://patternnexus.com/uploads/images/202601/image_870x_697e3437c26e6.jpg)
Operationally this is how modern failures are designed to look: deposit continuity, branch reopening, and a call center schedule. Depositors had immediate access over the weekend through checks, ATMs, and debit cards, and autopay/direct deposit continued. The FDIC’s FAQ also states that substantially all deposits were transferred regardless of dollar amount (with carve-outs for certain brokered/Cede & Co structures).
Why You “Missed” It
![[IMAGE_POLYMARKET_ALT: prediction market spike / contract resolution]](https://patternnexus.com/uploads/images/202601/image_870x_697e3071045c5.jpg)
The shock wasn’t the failure. The shock was the chart. Prediction markets don’t price magnitude or systemic meaning. They price settlement. A binary contract sits dead until someone verifies the condition was met, then it snaps to 100%.
That vertical line is not “markets discovering a crisis.” It’s traders discovering a checkbox is now true.
Modern resolutions are engineered to be boring so the category doesn’t run. If you were looking for panic, you won’t see it here. The system’s job is to keep deposit claims continuous even while equity and some residual assets get zeroed and liquidated quietly later.
The Balance-Sheet Mechanics (Why This One Broke)
The Pattern Nexus way to read this is not “a bank failed.” It’s “a funding equation stopped balancing.”
Thin equity is not a vibe, it’s a constraint
Based on Q3 2025 financial statements, Metropolitan had ~$261M in assets and ~$257M in liabilities, implying a net equity capital ratio around ~1.62%. That is thin. Thin equity doesn’t cause failure by itself. It means normal volatility becomes existential because there’s no buffer for credit marks, deposit repricing, or forced asset sales.
Wholesale funding is a pressure valve until it becomes structural
Reporting indicates Metropolitan had ~$43M in liabilities tied to advances from the Federal Home Loan Bank system as of Q3 2025. In a high-rate regime, wholesale backstops can save you short-term, but they also raise your marginal cost of funds and tighten your room to maneuver. When deposit betas rise and asset yields can’t reprice fast enough, you get margin compression at the exact moment you can least afford it.
![[IMAGE_FUNDING_STACK_ALT: deposits vs wholesale funding stack graphic]](https://patternnexus.com/uploads/images/202601/image_870x_697e35b200dee.jpg)
Why the FDIC wants same-day P&A deals
The policy objective is not “punishment.” It’s preventing value leakage and preventing category-level fear. The longer a failed bank sits unresolved, the more deposits and borrowers get spooked, the more service deteriorates, and the more asset value erodes. This is why the FDIC chair has emphasized resolving and selling quickly.
2026 failures won’t look like 2008. They will look like administrative continuity events until they cluster. The tell is the frequency, the funding spread behavior, and the policy ladder that activates when the drip turns into a sequence.
Current State: The Banking System Entering 2026
Here’s the setup that makes “first failure” informative. The aggregate system can look profitable and “fine” at the same time the weakest nodes start breaking.
Industry headline strength, stress pockets underneath
The FDIC’s Q3 2025 Quarterly Banking Profile showed net income of ~$79.3B and ROA of 1.27%. Deposits rose for a fifth consecutive quarter, with estimated uninsured domestic deposits up ~$88.6B (+1.1%) in the quarter. At the same time, past-due rates remained elevated in stress categories (non-owner-occupied CRE, multifamily CRE, auto, credit cards) and the system still carried large unrealized losses on securities: ~$337.1B total (HTM + AFS) as of Q3 2025.
![[IMAGE_QBP_CHARTS_ALT: FDIC QBP chart on unrealized losses + problem banks]](https://patternnexus.com/uploads/images/202601/image_870x_697e39cd29e27.jpg)
Why this matters for PN QE framework
PN framework is not “banking doom porn.” It’s the liquidity regime view: when funding becomes sensitive and the weakest nodes fail, the system’s tolerance for QT shrinks. Because QT is not just “less Fed assets.” It’s less reserves, tighter money-market conditions, more binding leverage constraints, and lower private intermediation capacity.
That’s why the same macro year can contain “profits up” and “first failures beginning.” Aggregate profitability is not the same thing as distributional stability.
QE Framework: Why the Endpoint Is Balance Sheet Expansion
This is where most commentary loses the plot. Bank failures do not automatically mean QE next week. What they do mean is the reaction function gets closer, because the system has structural reasons it cannot run “tight” for long without something breaking.
The “reserve demand ratchet” problem
In an ample-reserves (floor) system, reserve demand tends to ratchet upward over time due to liquidity regulation, internal risk management, and stigma dynamics around emergency borrowing. The practical result is that shrinking the Fed’s balance sheet becomes harder the longer the regime persists, because the system’s minimum comfortable reserves drift higher after each episode of stress.
QT is easy when reserves are “obviously abundant.” QT becomes politically and mechanically fragile when reserves approach the system’s comfort floor. Then every stress event becomes an argument for “don’t drain liquidity here.”
The Fed balance sheet is still huge and the plumbing is active
As of the Jan 28, 2026 H.4.1 release: total Fed assets were ~$6.588T, securities held outright ~$6.292T, U.S. Treasury securities ~$4.266T, and MBS holdings ~$2.024T. Reserve balances were ~$2.902T, reverse repo was ~$324B, and the Treasury General Account was ~$923B.
![[IMAGE_H41_DASHBOARD_ALT: H.4.1 reserves, RRP, TGA snapshot]](https://patternnexus.com/uploads/images/202601/image_870x_697e3ade18635.jpg)
Why this leads to “QE by another name”
When bank balance sheets are constrained (capital ratios, leverage ratios, liquidity requirements) and Treasury issuance is large, private intermediation capacity becomes a bottleneck. In that world, the state uses every available balance sheet to keep the system clearing: central bank, Treasury cash management, agencies, and regulatory posture. The label changes. The function doesn’t.
Example: in January 2026 reporting, Treasury leadership described an initiative for agency MBS purchases designed to “match” the Fed’s ongoing MBS roll-off pace (roughly ~$15B/month), explicitly to reduce the tightening impulse hitting mortgage spreads. That’s not Fed QE. But it is a balance-sheet substitution that counteracts QT effects in the housing channel.
![[IMAGE_QE_BY_OTHER_NAMES_ALT: QT vs agency purchases diagram]](https://patternnexus.com/uploads/images/202601/image_870x_697e3b3c7e1f6.jpg)
This is the Pattern Nexus point: the system is a claims stack. If private balance sheets cannot carry the duration and funding risk at the price policymakers want, the public balance sheet expands somewhere. It may be formal QE. It may be liquidity facilities. It may be agency balance sheets. It may be TGA/RRP plumbing. It is still the same direction of travel: more balance sheet, more backstop, more “printing” in functional terms.
2026 Forward Path: Drip, Cluster, Step-Function
PN model wasn’t predicting a theatrical collapse. It was predicting that the conditions for failure would turn from theoretical to observable. This is the first observable print. Now the forward-looking question is shape.
Scenario 1: Drip (contained failures, low narrative impact)
- 1–3 small failures per quarter, resolved quickly via P&A
- DIF costs manageable, assessments stay quiet
- Funding spreads stay stable, no deposit flight narrative
- Policy stays in “monitoring mode” but QT remains politically fragile
Scenario 2: Cluster (same loan types, same geographies, tight window)
- Multiple failures tied to similar exposures (CRE-heavy pockets, funding-sensitive models)
- Local deposit behavior shifts first, then media follows
- Policy ladder begins: supervisory flexibility, faster resolutions, targeted liquidity messaging
- The market begins to price “QT pause / balance sheet stabilization” as base case
Scenario 3: Step-function (one mid-size event changes confidence)
- A larger institution forces category-level repricing of deposit safety
- Funding spreads widen, interbank caution rises, wholesale reliance jumps
- Regime response accelerates: liquidity operations, QT pause, and eventually asset purchases if markets stop clearing smoothly
1) Failure frequency (drip vs cluster).
2) Deposit mix shifts (uninsured sensitivity, brokered reliance).
3) Wholesale funding share (FHLB advances and other backstops).
4) CRE stress signals (non-owner occupied, office-heavy, refi walls).
5) Plumbing indicators: reserves, RRP, TGA volatility, repo firmness.
6) Tone shift: when language goes from “isolated” to “system conditions,” policy is already moving.
Pattern Nexus Lens
Bank failures are permissioned transitions inside the claims stack. The public sees “a bank shut down.” The system is actually doing four things at once.
- Claims continuity: deposits remain continuous to prevent category-level fear
- Asset triage: good assets transfer fast, questionable assets are retained and liquidated later
- Trust preservation: speed matters because delay becomes a run on the category
- Liquidity regime management: policymakers watch whether the plumbing tightens, because that’s when QT becomes untenable
The system didn’t “break” on Jan 30. It timestamped where breakage begins and where the QE reaction function gets closer. If failures cluster, the policy toolbox expands, and the balance sheet grows somewhere even if they refuse to call it QE.
QE Framework Add-On: The Liquidity Composite → Policy Ladder
This is the part that gets misunderstood by almost everyone. QT/QE isn’t a moral debate. It’s a clearing problem. When the private balance sheet can’t absorb duration, funding risk, or Treasury supply at the price the state needs, the public balance sheet expands somewhere. The label changes. The function doesn’t.
In Pattern Nexus terms, our liquidity composite is the dashboard of whether the system is running “loose” or “tight” and whether the Fed/Treasury plumbing is helping or hurting:
- Fed assets (H.4.1): the macro throttle (outright holdings and how fast they’re shrinking/growing)
- Reserve balances: the system’s operating oxygen (what banks settle with)
- ON RRP: the liquidity sink / release valve (cash parked at the Fed instead of in the banking system)
- TGA: Treasury’s liquidity hoard / release valve (drains or injects reserves depending on swings)
You don’t “predict QE” by vibes. You predict it by identifying when the plumbing is approaching the system’s reserve comfort floor and when stress starts converting into observable failures, funding firmness, and policy language shifts.
The 3-Stage Policy Ladder
Most cycles don’t jump from QT straight into formal QE. They climb a ladder. The ladder exists because policymakers try to minimize optics while still restoring clearance and confidence.
- Stage 1 — QT (tightening regime): balance sheet runoff continues; the system relies on private balance sheets to clear.
- Stage 2 — Pause / Offset (stabilization regime): QT slows or pauses; “QE-by-other-names” emerges (facilities, agency/treasury offsets, regulatory flexibility, targeted support).
- Stage 3 — Expansion (explicit regime change): balance sheet growth returns (outright purchases or programs that are functionally equivalent) when markets stop clearing cleanly or confidence becomes the constraint.
![[IMAGE_POLICY_LADDER_ALT: QT→pause/offset→expansion ladder diagram]](https://patternnexus.com/uploads/images/202601/image_870x_697e3b8e1d650.jpg)
Trigger Table
Below is the cleanest PN-style mapping from our composite components to the reaction function. This is not “one magic number.” It’s a cluster of tells that reliably appear as the system approaches the end of a tightening regime.
| Composite Component | What It Means | Stage 1: QT | Stage 2: Pause / Offset | Stage 3: Expansion |
|---|---|---|---|---|
| Reserve balances | Operating oxygen / settlement capacity | Reserves drift lower but markets remain orderly | “Comfort floor” rhetoric appears, repo becomes firmer, sensitivity rises | Reserves are actively supported/rebuilt via operations/programs |
| ON RRP | Liquidity sink (cash parked at Fed) | RRP declines over time as excess cash leaves | RRP is near “empty” and cannot cushion tightening anymore | Policy tools shift to direct support (you can’t drain what isn’t there) |
| TGA swings | Treasury liquidity drain/injection via cash balance | TGA volatility is manageable; drains don’t break funding | TGA drawdowns/rebuilds begin to move funding conditions | Treasury cash management becomes a stabilization tool (explicitly or implicitly) |
| Fed assets / runoff pace | Macro throttle (QT speed) | Runoff continues; markets clear without persistent stress | Runoff caps reduced or language shifts to “monitoring reserves” | Holdings stabilize or grow via purchases/programs |
| Bank failures / “problem banks” | Stress converting into observable outcomes | Isolated failures (administrative, contained) | Failures cluster; FDIC tone shifts; supervision posture adapts | System-level stabilization prioritized over optics; liquidity support expands |
| Funding markets (repo/term firmness) | Real-time stress in collateral + cash clearance | Transient firmness only | Persistent firmness; “plumbing talk” returns; facilities become relevant again | Direct intervention to restore smooth market function |
How This Connects Back to the First Failure
The first 2026 bank failure doesn’t “cause QE.” It reduces the system’s tolerance for tightening. It is a public, timestamped reminder that the weakest nodes are failing under this funding regime. If those timestamps start clustering while reserves approach the comfort floor and money markets firm, the ladder activates: QT slows, offsets appear, and balance sheets expand where needed.
In PN framework, “QE” is not a prediction based on political guessing. It’s the last rung of a policy ladder that becomes inevitable when the plumbing tightens, failures cluster, and private balance sheets stop clearing smoothly at the state’s preferred price.
FAQ
Was this a depositor loss event?
No. The FDIC FAQ states no one lost money on deposit as a result of the closure, and substantially all deposits were transferred (with specific brokered/Cede & Co carve-outs).
Does one failure mean “banking crisis”?
No. One failure means the stress regime is producing observable outcomes. Crisis depends on clustering, funding spreads, deposit behavior, and policy escalation.
Is this “QE”?
Not directly. But it is part of the pathway that makes balance-sheet expansion more likely. QE is the endpoint tool when private balance sheets can’t absorb duration/funding risk at scale without breaking confidence or market function.
What’s the cleanest “QE framework” trigger?
When money markets show persistent firmness, reserves approach the comfort floor, and failure frequency rises (or deposit flight accelerates), QT becomes politically costly. That’s when you see pauses, offsets, and eventually outright expansion.
Sources
Primary documents for the failure and resolution terms, plus balance-sheet plumbing sources used for the QE framework tie-in.
- FDIC press release (Jan 30, 2026): assets, deposits, P&A terms, DIF cost, first failure of 2026
- FDIC FAQ: depositor access, interest treatment, brokered/Cede & Co carve-outs, separate insurance window
- FDIC failed bank page: receiver details, claims priority, operational continuity
- American Banker: balance-sheet snapshot, liabilities, FHLB advances, net equity ratio
- FDIC Quarterly Banking Profile Q3 2025 (PDF): profits, deposits, unrealized losses, asset-quality notes
- Federal Reserve H.4.1 (Jan 2026): total assets, Treasuries, MBS, reserves, RRP, TGA
- CRS R48390 (Updated Jan 14, 2026): Fed balance sheet trends and policy constraints
- Federal Reserve FEDS Notes (Jan 14, 2026): balance-sheet trilemma and operating framework trade-offs
- Reuters (Jan 10, 2026): agency MBS purchases framed as offsetting Fed MBS roll-off
- Reuters (Oct 14, 2025): QT end-stage framing and reserves “floor” discussion
Phản Ứng Của Bạn Là Gì?
 Thích
0
Thích
0
 Không Thích
0
Không Thích
0
 Yêu
0
Yêu
0
 Hài hước
0
Hài hước
0
 Wow
0
Wow
0
 Buồn
0
Buồn
0
 Giận dữ
0
Giận dữ
0

Founder of Pattern Nexus. I research markets, macro, geopolitics, AI, history, ancient systems, and the patterns most people overlook. I’m also building Market Radar, a trading scanner designed to read pressure, risk, confirmation, and setup quality before chasing a move. Pattern Nexus is where I connect the dots between data, history, technology, and the bigger system playing out around us.













Các bình luận (0)