
The Financialization of Everything: A 2013 Wake-Up Post Rebuilt Through the Pattern Nexus Lens
A Pattern Nexus reconstruction of a 2013 blog post on long-run price levels, the Fed’s crisis interventions, dollar swap lines, and why “money printing” evolved into a durable control system rather than an immediate collapse.

Long-run inflation isn’t a mystery event, it’s a structural outcome of how elastic the credit system becomes once money is managed as policy rather than constrained by settlement.
The biggest public misunderstanding is treating QE as a one-time “printing” story instead of a repeatable stabilization protocol that can be re-run whenever collateral, funding, or dealer balance sheets lock up.
Offshore dollars are part of the system. Swap lines aren’t charity, they’re a circuit breaker for a global dollar plumbing network the U.S. sits at the center of.
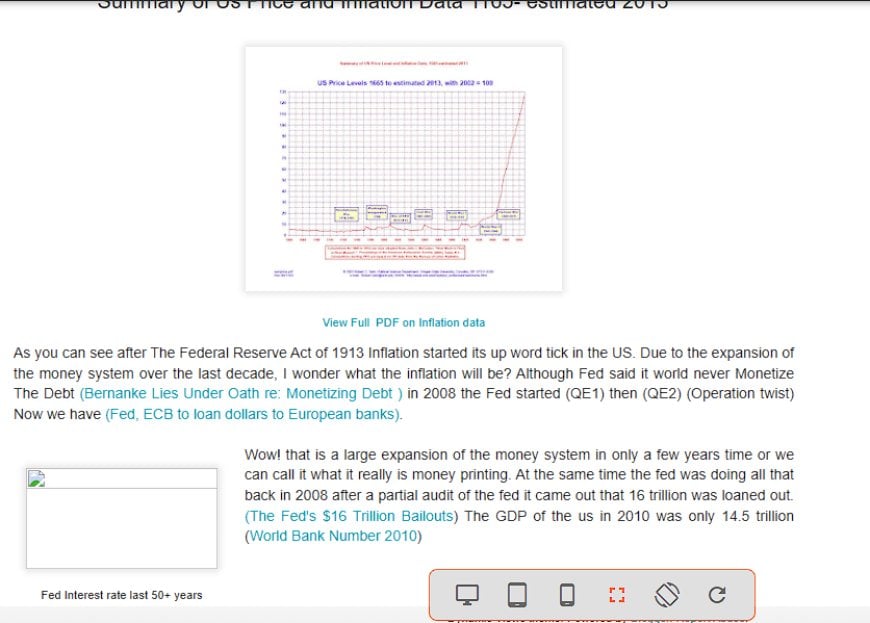
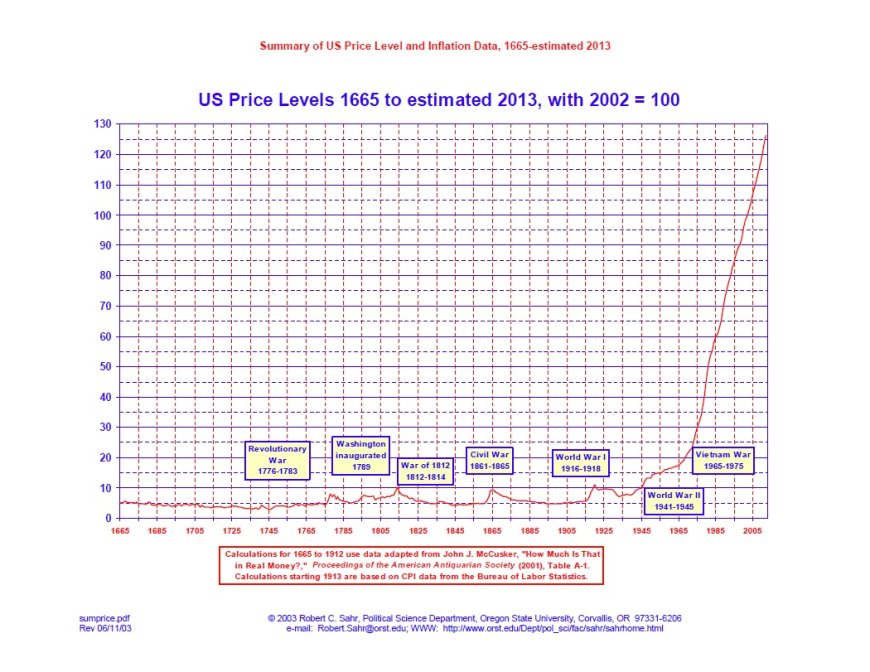
What the 1665–2013 Price Chart Actually Shows
The original 2013 post centered around a long-run U.S. price level chart (1665 to estimated 2013, with 2002 = 100). The emotional reaction is obvious: the line looks “flat” for a very long time, then modern history turns it into a hockey stick.
The correct takeaway is not “the world ends because the line goes up.” The correct takeaway is structural: when money and credit are constrained, price levels are comparatively stable over long spans, with spikes during wars or supply shocks. When money becomes elastic and credit becomes policy-managed, the long-run slope changes and compounding takes over.
The Fed’s creation didn’t instantly create inflation. It created a new architecture: a centralized backstop and a system-wide mechanism for expanding credit. Over decades, that architecture changes how crises are handled, how debt is financed, how rates behave, and how price signals get smoothed, suppressed, and periodically released.
2008–2011: QE, Maturity Extension, and Dollar Swap Lines
In the 2013 post, I used the blunt language most people used at the time: “money printing.” I linked QE1, QE2, Operation Twist, and then a headline about the Fed and ECB coordinating dollar liquidity. That bundle of links was my early version of a single idea: the central bank can expand the monetary base and re-route liquidity when the private system freezes.
QE1: Large-Scale Asset Purchases as a Stabilization Protocol
QE1 wasn’t just “buying stuff.” It was a direct attempt to repair broken funding channels by taking duration and specific collateral types onto the public balance sheet. The New York Fed’s program archive documents the scale and timing of those purchases.
QE2: When the Protocol Becomes Repeatable
The psychological shift is important. Once QE exists as a tool, it becomes an option set. Markets stop pricing a world where intervention is unthinkable. They start pricing a world where intervention is conditional, cyclical, and politically negotiated.
Operation Twist: Maturity Extension Without “More Printing”
The Maturity Extension Program (“Operation Twist 2”) matters because it shows the system can push on long rates even without expanding the balance sheet the way people imagine “printing.” The Fed extended portfolio maturity to put downward pressure on longer-term yields.
Swap Lines: The Offshore Dollar Circuit Breaker
The 2013 post linked “Fed, ECB to loan dollars to European banks.” That is swap line logic in plain English. When offshore dollar funding markets seize, the Fed can provide dollars to foreign central banks against collateral, so those central banks can then lend dollars into their local systems. This is not a side story. It is core plumbing for a dollar-centric global system.
- Swap lines exist because the world runs on dollar funding, not just dollar settlement
- They reduce the probability of disorderly deleveraging outside U.S. borders that boomerangs back into U.S. markets
- They are a control lever: stabilize the periphery to protect the core
What I didn’t fully grasp in 2013 is that QE and liquidity facilities were the beginning of a repeatable stabilization protocol. Once proven, protocols don’t disappear. They become part of the system’s immune response.
The “$16 Trillion” Bailout Claim: What It Means and What It Doesn’t
In the original post, I repeated the number that circulated widely after the first major crisis-era audit and reporting wave: that “$16 trillion was loaned out.” That number became a cultural marker for the scale and opacity of emergency interventions.
Here’s the clean way to hold it today without losing the point:
- What it means: across many facilities and many transactions, emergency lending and liquidity support was enormous in aggregate when you add up all individual loans and rollovers over time
- What it does not mean: it does not mean $16T was outstanding at once, and it is not the same thing as a single one-time fiscal “check”
- Why it still matters: the controversy wasn’t just the number, it was the existence of a monetary shadow response that most of the public didn’t understand while it was happening
If you want to understand financialization, stop treating emergency facilities as scandal headlines and start treating them as system architecture. The real story is that once a lender-of-last-resort expands its mandate, markets adapt behavior around that backstop.
In 2013 I contrasted those bailout figures with GDP figures to express scale. That instinct was correct. The mistake was assuming scale automatically implies collapse. Scale can also imply something else: the system has enough political and institutional capacity to keep the machine running, even if it has to rewrite rules mid-crisis to do it.
Pattern Nexus Lens
The “financialization of everything” is the process where the economy becomes increasingly governed by balance sheets, collateral chains, funding markets, and policy-managed liquidity rather than purely by productive output and organic savings. That doesn’t mean production stops mattering. It means production gets subordinated to the financial layer that prices, funds, and leverages it.
My 2013 self saw the symptoms and assumed the ending. My 2026 framework is different: this is a control system. When the system tightens and breaks something, it deploys tools to re-open channels. When the public narrative needs to stay coherent, it re-labels those tools. The machinery is the same, the language changes.
The mistake is thinking the system is fragile because it intervenes. The reality is the opposite: intervention is evidence the system has a stabilization protocol and is willing to use it.
FAQ
Did inflation “start” in 1913?
Not instantly. The better phrasing is that the architecture changed. Over time, elastic money and policy-managed credit alter long-run price behavior and reduce the probability of hard resets by substituting gradual debasement and periodic bursts of inflation.
Is QE literally “printing money”?
QE is balance sheet expansion through asset purchases, which changes the composition of assets held by the private sector and can alter funding conditions, yields, and risk appetite. People call it “printing” because it is a monetary base expansion mechanism, but the transmission is not a simple one-step consumer price story.
Why do swap lines matter?
Because offshore dollar funding stress can destabilize global banks and markets quickly, and that instability feeds back into U.S. credit conditions. Swap lines are a global dollar circuit breaker in a dollar-centric system.
Sources
Primary references that support the historical chart context, QE tools, maturity extension mechanics, and swap line coordination.
- Robert Sahr (Oregon State University): Summary of U.S. Price Level and Inflation Data (PDF)
- New York Fed: Large-Scale Asset Purchases (QE1 program archive)
- Federal Reserve: Maturity Extension Program and Reinvestment Policy (Operation Twist)
- Federal Reserve press release: Coordinated central bank action on U.S. dollar liquidity swap arrangements (Nov 30, 2011)
- ECB press release: Coordinated central bank action on U.S. dollar liquidity swap arrangements (Nov 30, 2011)
- GAO: Federal Reserve System emergency actions oversight report (GAO-11-696)
- GAO-11-696 full PDF
- CRS discussion of the widely cited “$16T” total and how it is constructed (loan-summing vs peak outstanding)
คุณมีปฏิกิริยาอย่างไร?
 ชอบ
0
ชอบ
0
 ไม่ชอบ
0
ไม่ชอบ
0
 รัก
0
รัก
0
 ตลก
0
ตลก
0
 ว้าว
0
ว้าว
0
 เศร้า
0
เศร้า
0
 โกรธ
0
โกรธ
0

Founder of Pattern Nexus. I research markets, macro, geopolitics, AI, history, ancient systems, and the patterns most people overlook. I’m also building Market Radar, a trading scanner designed to read pressure, risk, confirmation, and setup quality before chasing a move. Pattern Nexus is where I connect the dots between data, history, technology, and the bigger system playing out around us.
















ความคิดเห็น (0)