

What the Hell Is the Fed Doing? Rates, Treasury Bills and the Gold Selloff
The Fed is holding rates high and still buying Treasury bills. The purchase schedule, futures curve and metals selloff show where my earlier calls held up and where the numbers force a correction.
In this article 12 sections
- The Fed moved its target up to 3.75%–4.00% in September and held it in October. My working call is that March is still in play. One more quarter-point hike gets the upper end to 4.25%. On November 19, March futures implied a 4.395% average effective rate for that month. Traders were pricing more than a one-hike-and-done path. [1][2][3]
- The New York Fed is still buying bills. The current schedule calls for $14 billion of reinvestment and $0 in new reserve-management purchases. Compared with mid-August, the Fed owns roughly $47 billion more in bills and $47 billion less in mortgage-backed securities. Total assets are down about $19 billion over that same window. [4][5]
- The dollar index recently reached 103.90, its strongest level since April 2025. Gold was around $3,530 and silver $41.23 in Reuters’ November 20 reporting, down about 37% and 66% from their January highs. The direction lines up with the archive. The dollar’s conditional 105 and 110 levels are still ahead of the observed move. [6][7][8][9][10][11]
- I missed the ten-year. The call was below 3%. Treasury’s November 19 reading was 5.04%, and the inflation-adjusted ten-year was 2.88%. That matters for real estate, equities and gold. [12][13][14]
- Gold did gain reserve share. Treasury bills also gained share within U.S. marketable debt. The public figures tell us which balance sheets changed, how much prices mattered and where the dollar still has structural demand. The idea that the Fed set out to punish gold holders is my interpretation. [15][16][17][18][19]
The Fed can make borrowing more expensive even while it keeps the market for Treasury bills functioning.
The Fed has bought bills every operating period since December 2025. The new-reserve program has been on pause since August.
The 4.25% ceiling is the lower-rate branch. The November 19 futures curve kept rising past March.
Gold’s share can rise because existing bars reprice. A stablecoin issuer buying bills is a separate source of dollar collateral demand.
The sub-3% ten-year call missed. A higher real yield was a material part of the move I missed.
Monetary Policy
How far is the Fed going to take this?
What in the hell is the Fed doing? Start with what happened. It raised rates by a quarter point on September 16 and held the range at 3.75%–4.00% on October 28. Two voters wanted another hike then. The October minutes, released November 18, show broad support for another quarter point in December if the economy came in roughly as expected. So my question is how long they keep pressure on. December is the first decision. March is where I think we find out how much more they think they need to do. [1][2][20][21]
The Fed has a public reason to tighten. Its benchmark inflation measure, PCE, was running at 3.6% year over year in September, with core at 3.1%. October CPI increased 0.4% on the month, with core up 0.3%. The October 2025 data gap means BLS couldn’t publish the usual October-over-October change for most CPI series. The economy was still adding jobs in October, with payrolls up 165,000 and unemployment at 4.1%. The advance estimate put third-quarter growth at a 3.4% annualized pace, up from 2.2% in the second quarter. You can see why the Fed has room to keep policy tight while people looking at their stock accounts are asking what broke. [22][23][24][25]
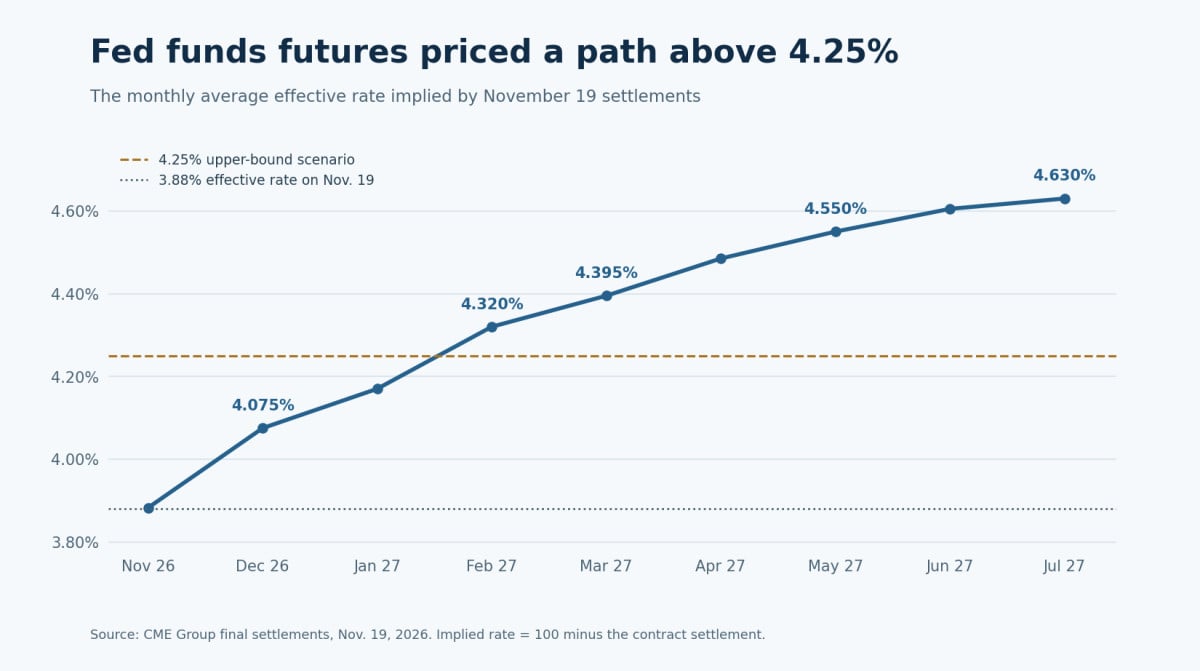
Here’s the part I would correct in my own wording. If we get another quarter-point hike, the range goes to 4.00%–4.25%. That is one hike, full stop. If 4.25% is still the upper bound in March, the Fed has made only one net quarter-point move along the way. The November 19 CME settlement for December implied a monthly average effective rate of 4.075%. February implied 4.320%, March 4.395%, and May 4.550%. The effective rate was 3.88% on November 19. Futures price the average for the whole month, so a March hike halfway through the month only partly shows up in the March contract. Associated Press reported close to 95% odds of a December hike. The New York Fed’s survey cited in the October minutes had a median of two hikes, in December and March. The University of Michigan’s November forecast also has those two moves, taking the range to 4.25%–4.50%. [3][26][20][27][28]
My working call is that the risk of another hike stays live through March. A 4.25% ceiling is the branch where inflation rolls over enough that one more move does the job. If the Fed hikes in December and brings the target to 4.00%–4.25%, there are still January and March meetings where they can go higher. The futures curve gives them room to go higher. I’m watching what happens to core inflation and employment between the meetings before I call March the end of the cycle. [21][3][22][24]
Federal Reserve Balance Sheet
The Fed is buying bills. Look at what it is replacing.
This goes back to October 2025. I wrote on October 17 that the financial system would force a return to liquidity support. On October 23 I wrote that the reserve floor was already driving a turn in policy. On October 29 the Fed announced the end of aggregate securities runoff effective December 1. On December 10 the New York Fed announced bill purchases for reserve management, starting December 12, at roughly $40 billion in the first operating period. I covered the decision that day and called it QE-lite. The October pieces are the advance calls on the turn. The December piece is the record of the actual start. [29][30][31][32][33]
There are two reasons the Desk can show up and buy a bill. The difference shows up when you follow where the dollars came from.
- Reserve-management purchases. The Fed buys a security outright to increase the assets it holds. All else equal, when it pays for the security, reserve balances rise. This is the program that started in December. Its public mandate is to keep reserves ample, and the Desk can use bills or other Treasuries with up to three years remaining if needed. [32][4][20]
- Reinvestment. An agency security pays principal back to the Fed. The Desk uses that principal to buy bills. The bill portfolio grows as the agency portfolio shrinks. The trade can support the market for bills without adding the same amount to the Fed’s total holdings. Treasury principal the Fed already owns is rolled at auction under a separate instruction. [20][4]
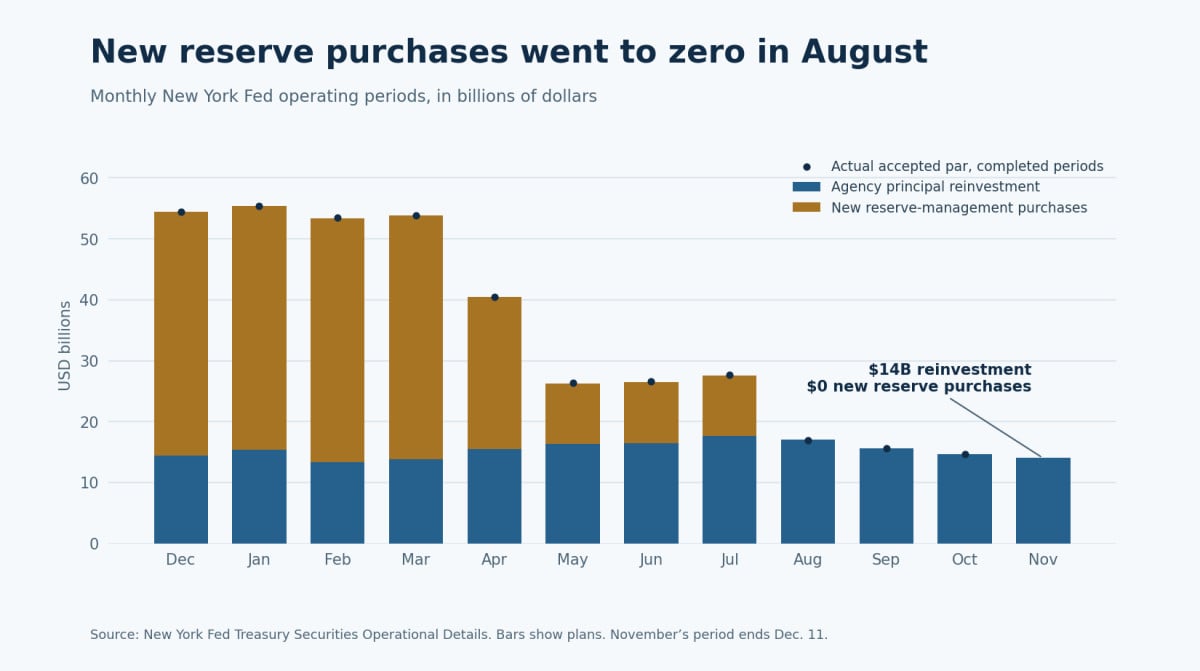
The first four operating periods each had about $40 billion of scheduled reserve-management purchases. The Desk then planned $25 billion, followed by three periods at $10 billion each. That adds up to about $215 billion in scheduled additions through the period that ended August 13. Every operating period since August 14 has scheduled zero new reserve-management purchases. In the current November 16–December 11 window, the Desk plans about $14 billion of bill reinvestments. It accepted $1.756 billion of bills at the November 18 operation, settling November 19. Those are gross purchases and the schedule identifies why the Desk is making them. Treasury sells its own debt at auction. The purchases here are from the secondary market. [4][34]
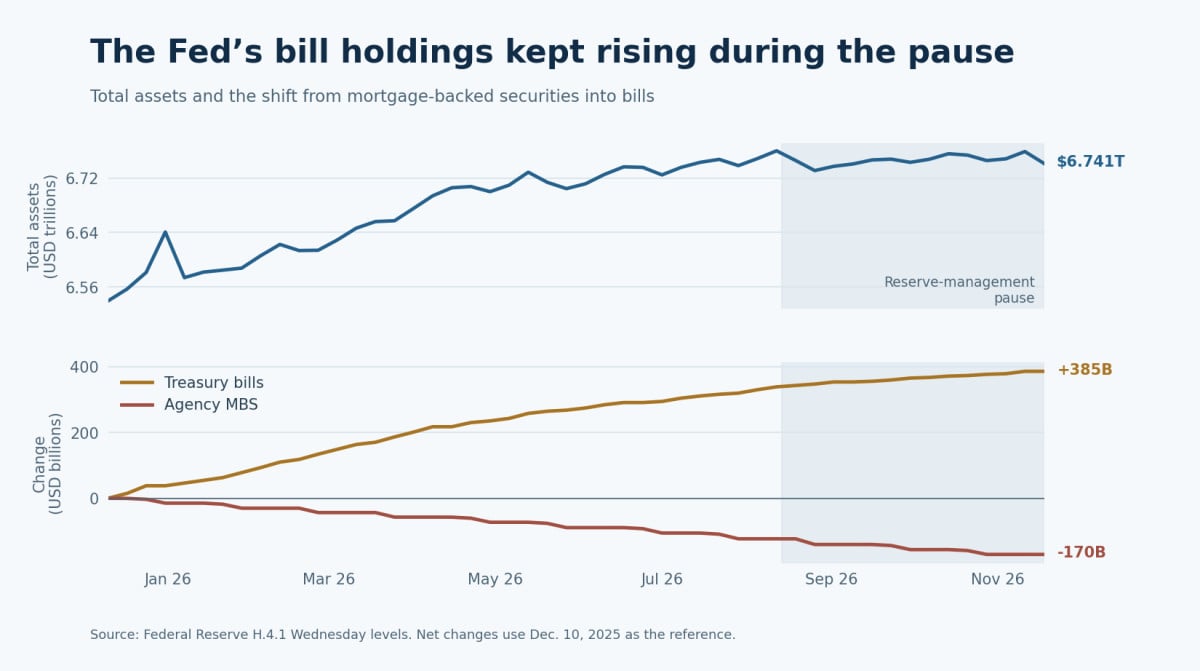
If you’re asking whether I was right that the Fed would quietly come back into the bill market, yes. If you’re asking whether the November buying is the same addition of new reserves the Desk started in December, look at the second chart. Here’s the actual balance-sheet comparison. [30][32][4][5]
| Wednesday measure (USD billions) | Dec. 10, 2025 | Aug. 12, 2026 | Nov. 18, 2026 | Change since Aug. 12 |
|---|---|---|---|---|
| Total Fed assets | 6,539.3 | 6,760.0 | 6,741.5 | −18.5 |
| Treasury bills | 195.5 | 533.5 | 580.7 | +47.2 |
| Agency mortgage-backed securities | 2,053.7 | 1,930.9 | 1,883.5 | −47.4 |
| Bank reserve balances | 2,973.8 | 2,947.6 | 3,001.8 | +54.2 |
Pattern Nexus Research
Is the Fed actually tightening?
It is tightening through price. Look at the overnight policy rate, the real ten-year and what a lender charges to refinance a building. The Fed can do all of that while it makes sure there are enough reserves for banks to pay one another. When you price a mortgage at 7.28%, nobody at the closing table cares that the Fed owns another $47 billion of bills. The loan still has to cover its payment. Freddie Mac’s 30-year average was 6.11% on March 12 and 7.28% on November 19. [1][13][14][35][5]
Over the full purchase era, the Fed’s assets are about $202 billion higher than December 10 and Treasury bills are about $385 billion higher. M2, the broader measure that includes money people and businesses can hold and spend, was $23.414 trillion in September, up 5.7% from a year earlier. Those figures capture different things. Bills are assets on the Fed’s books. Reserves are deposits banks hold at the Fed. M2 is a broad money measure. A change in one is no formula for how much the others will change. [5][36]
The latest funding snapshot puts this in perspective. On November 19, secured overnight borrowing measured by SOFR was 3.91%, one basis point above the Fed’s 3.90% interest on reserve balances. H.4.1 showed roughly $3.0 trillion in Wednesday bank reserves on November 18. Treasury’s account at the Fed averaged about $916.6 billion that week. Treasury’s cash balance, currency demand and other liabilities can move bank reserves even during a purchase pause. One nationwide funding print can hide stress at particular banks or around a tax date or quarter-end. That’s the reason I track the spread over multiple days and follow facility use. [28][5][37]
My hard-assets framework starts with the cost and availability of money. If broad money grows at the same time real borrowing costs climb, there are two forces at work. You can see that in gold this year. When a highly leveraged holder has to fund a position today, the rate they can borrow at and the collateral they can sell can matter more than the long-run growth of M2. That’s why I keep the components in view instead of relying on any one liquidity number. [38][39][14]
Market Data
The dollar, gold and silver calls have a record
Remember when the conversation was that the dollar had to die and gold and silver could only go up? I’ve been making a different argument. The case I made in The Dollar’s Last Stand, dated November 4, 2025, was that the dollar can get stronger during the very stress people expect to bring it down. The world already owes money in dollars. If a position is cut, a margin call comes due, or an importer still owes dollars on a contract, the need for settlement can go up fast. In the March 12 piece I wrote that a sustained move through 100 put 105 and potentially 110 in play. I didn’t need everyone to change their mind about the dollar for the first leg of that move to happen. [40][9]
Reuters reported DXY had touched 103.90 and was trading around 103.75 in its November 20 update. The Fed’s separate, broader trade-weighted index went from 117.44 on January 29 to 122.65 on November 13, up 4.4%. Different currency baskets, same direction over their respective observation windows. DXY remains below 105. A move in the dollar’s price establishes the rally. The funding-squeeze version of the call also needs evidence from cross-currency funding, repo and facility usage. I’m still watching for that. One measure of the system those contracts run through is the BIS survey. The dollar was on one side of 89.2% of global currency trades in April 2025. That measures FX transactions, a different question from how much of their reserve portfolios central banks keep in dollars. [6][41][40][28][42]
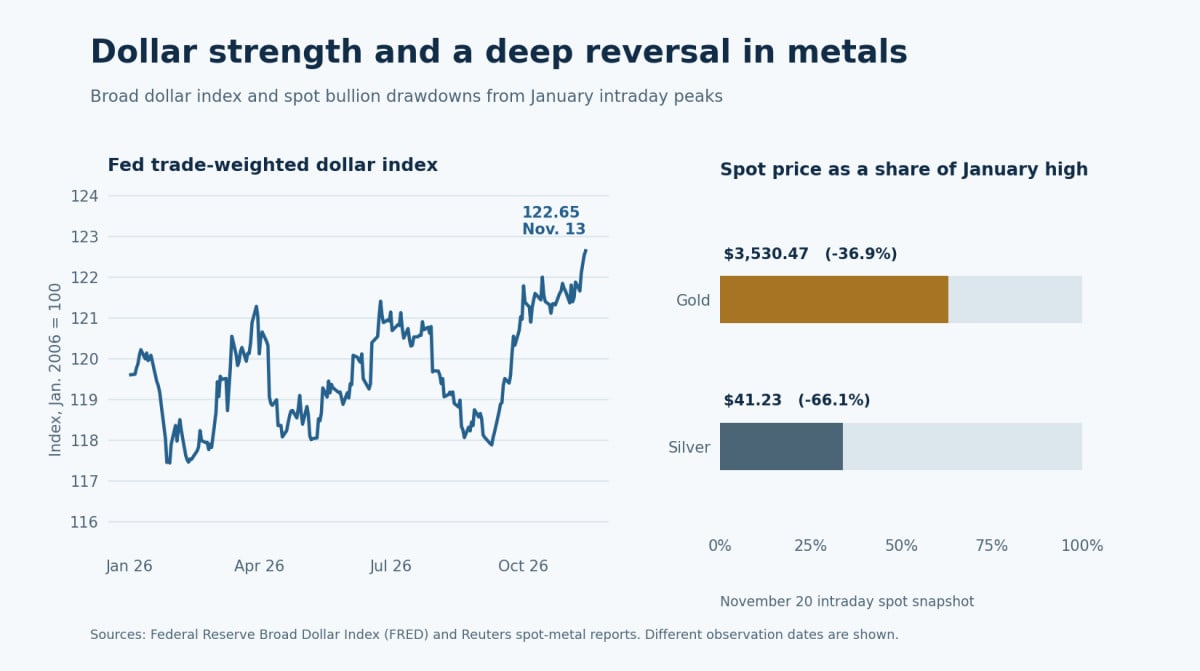
I had two time horizons on metals. In October 2025 I laid out a conditional $5,000–$6,000 gold zone. Gold got there and made an intraday high of $5,594.82 in January. The stabilization part of the call failed. In December I warned that silver could have a strong industrial story and still fall hard once momentum and leverage had done their work. By March 22, gold had broken below $4,400 and I wrote that a move toward $3,800 was on the table if support and the long end kept moving against it. At the November 20 reporting cut, gold was $3,530.47, about 36.9% below its January record. Silver was $41.23, about 66.1% below its $121.64 January record. The published December silver piece was a risk call. The $41 print is where the market got to. [43][10][11][12][7][8]
The selloff also extends past metals. From the October 6 closing peaks to November 19, the S&P 500 was down 8.2% and the Nasdaq Composite was down 13.5%. The VIX closed November 19 at 28.44, and the U.S. high-yield spread widened from 3.24 to 3.52 percentage points from October 1 to November 19. That says risk is being repriced. It leaves room for a growing economy and a falling stock market at the same time. The Fed is dealing with the first. A lot of people are feeling the second. [44][45][25]
Market Data
I was wrong on the ten-year
I expected the ten-year to drop below 3%. I wrote in the August audit that it hadn’t happened. Treasury’s official 10-year yield was 3.97% on February 27, 5.31% on October 5, and 5.04% on November 19. The ten-year has come down from October. It’s still 107 basis points above the late-February reading and 204 basis points above 3%. That gap is too big to wave away. [12][13]
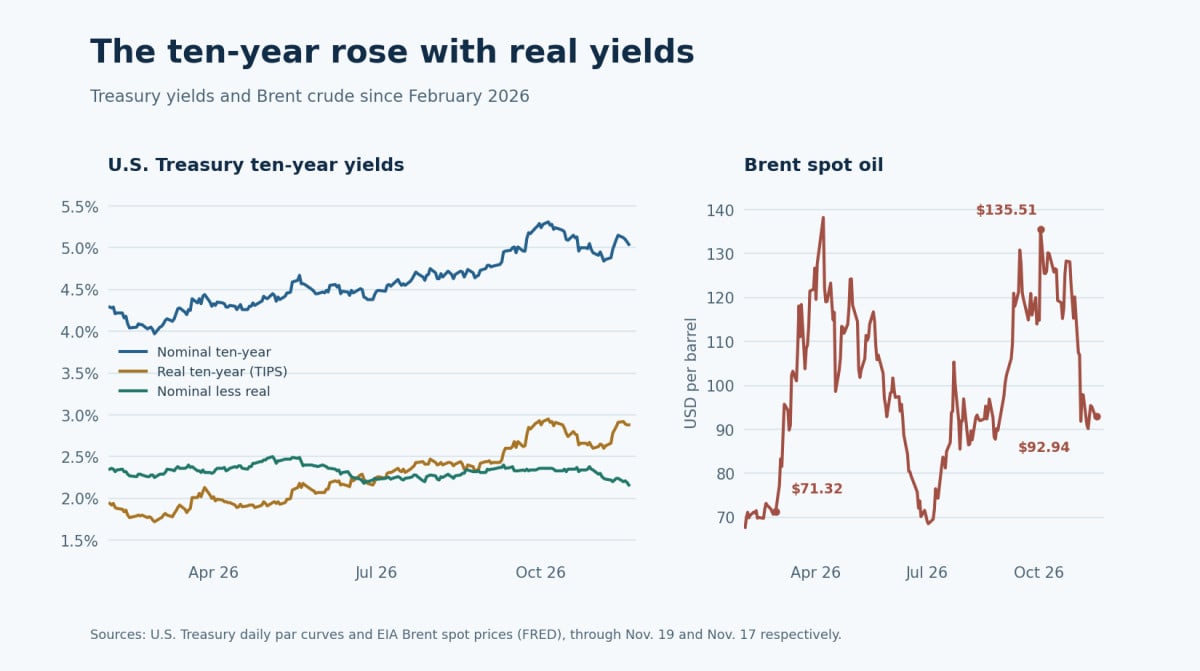
The war and the energy shock changed the path I had in mind. Brent went from $71.32 on February 27 to $118.42 on March 20. It hit $135.51 on October 2 and was back to $92.94 on November 17. Energy cooling can help explain the unwinding from the October spike. The ten-year real yield shows why the long end stayed high. It was 1.72% on February 27 and 2.88% on November 19, a rise of 116 basis points. The gap between the nominal yield and the real yield narrowed from 2.25 to 2.16 percentage points. The nominal yield rose with a higher real return while inflation compensation at that maturity was slightly lower. [46][13][14]
The New York Fed’s model also estimates a 10-year term premium of around 0.70% on November 19, up from 0.59% in late February and down from 0.96% on October 5. A term premium is the estimated extra return investors require to hold longer debt and take the risk that rates move against them. The model helps explain the long end. The estimate can change with the model, and the residual between a nominal and an inflation-protected yield also includes risk and liquidity effects. Neither series identifies how much of the move came from the war, future policy or Treasury supply. My forecast gave too much weight to the forces that were supposed to take yields down. [47][13][14][12]
Here’s what that means for gold. Gold pays no coupon. When an inflation-protected Treasury pays a materially higher real yield, the opportunity cost of holding gold goes up. Add a stronger dollar at the same time and foreign buyers can face a higher local-currency entry price for the same ounce. Silver adds its own industrial exposure and positioning. Those forces can coexist with central banks buying gold for reasons that have a much longer clock. [14][41][48][10]
Official Reserves
Gold gained reserve share. Bills gained debt share.
This is where people start using the word “share” to mean three different things. There is a share of official reserves, a share of foreign-exchange reserves, and a share of outstanding Treasury debt. Put the denominator next to every number and the argument gets clearer. [15][16][18]
| Measure | Latest figure in this comparison | What goes in the denominator |
|---|---|---|
| Monetary gold and U.S. Treasuries in the ECB comparison | Gold 27%, U.S. Treasuries 22%, end-2025 | Official reserves including gold, marked at market prices. Treasuries include all maturities. |
| Dollar in IMF COFER | 56.70% in Q2 2026, down from 57.18% in Q1 | Official foreign-exchange reserves. Gold is outside this total. |
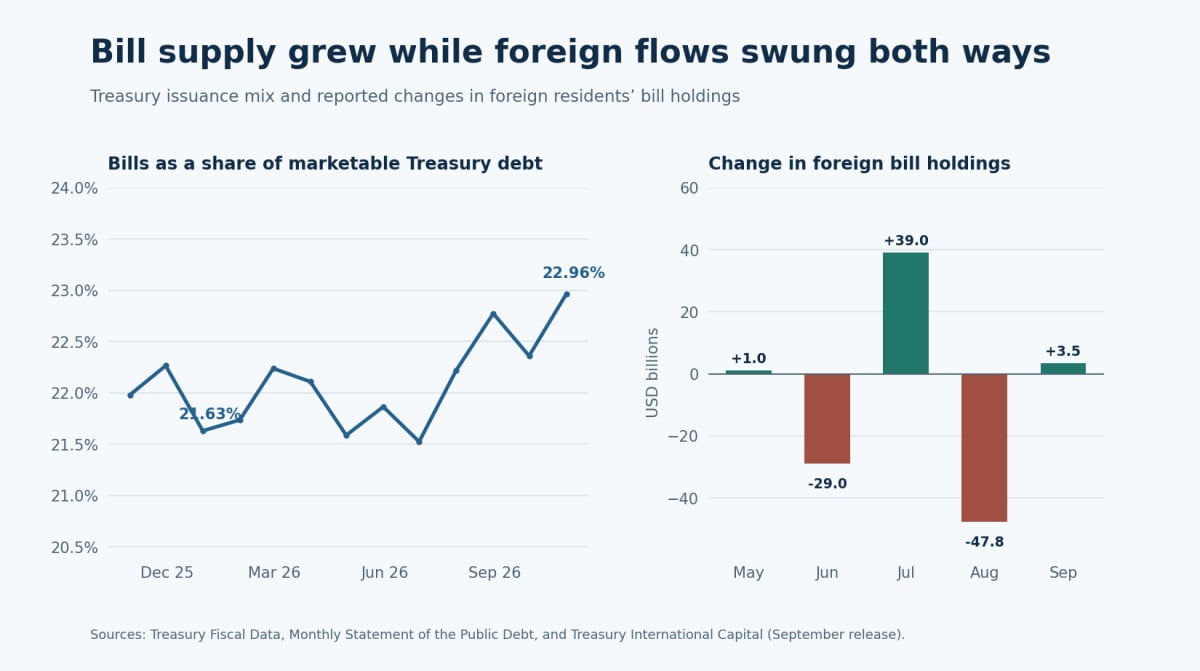
| Bills in U.S. marketable Treasury debt | 22.96% in October 2026, up from 21.63% at end-2025 | All marketable U.S. Treasury securities outstanding. |
Central banks did buy a lot of gold. The World Gold Council estimates 321 tonnes of net buying in the third quarter against a five-year quarterly average of 227 tonnes. That brings the first nine months to 675 tonnes, up 6% year over year. But if you owned a bar a year ago and its price went up by 60%, the dollar value of your gold went up even if you spent nothing. The ECB attributes most of the end-2025 rise in gold’s share to that valuation effect. The Fed staff’s comparison also asks what happens if you remove U.S. gold from a total you’re comparing to foreign official Treasury holdings. On that basis, by June 2026 those foreign official Treasury holdings were again larger than the gold total. The diversification is real. Its size depends on how you count it. [48][15][17]
Bills outstanding grew from $6.547 trillion at the end of 2025 to $7.382 trillion in October. That’s about $834 billion more short government paper outstanding. Bills mature within a year and work as cash management and collateral. Treasury chooses how much it issues. The Fed’s secondary-market purchases can add a buyer and influence pricing, while taking bills into SOMA reduces the stock immediately available for other holders. Treasury’s September TIC report showed foreign residents adding $3.5 billion of bills in September after cutting $47.8 billion in August. From May through September those reported changes sum to a $33.3 billion decrease. The new supply is measurable. A broad foreign rotation into bills over that particular window would have left different numbers. [18][4][19][49]
The asset people are describing when they call gold “Tier 1” is usually monetary gold or allocated physical bullion. Gold can sit in a central bank’s reserves, can be held outright and carries no issuer’s promise to pay. Under Basel, Tier 1 capital means Common Equity Tier 1 plus Additional Tier 1. That’s loss-absorbing capital on the bank’s funding side. U.S. Regulation Q has a separate zero-risk-weight rule for specified vaulted or allocated bullion to the extent it offsets bullion liabilities. The risk weight is about the treatment of an asset for capital requirements. Gold is a hard asset. The name of the bank-capital bucket is a different question. I’ve been writing about gold as a way to hold value outside somebody else’s payment promise and as a price that reacts to shifts in liquidity. Both ideas matter here. [50][51][38][52][53]
Here is my interpretation. When the dollar strengthens, real yields rise and more short government paper is available at attractive yields, a reserve manager has to compare what the next ounce of gold buys them against what the next dollar of bills can do. That helps restore some of the appeal of dollar collateral after gold’s run. It can also hurt anyone holding gold while owing dollars. I think that competitive pressure is worth watching. To establish it as deliberate Fed policy would require a stated objective or transaction evidence connecting the Fed’s decisions to the reserve managers’ purchases. What we have today is the Fed’s inflation and reserve-management mandate, the issuance and holdings, and the resulting prices. [20][4][13][14][18][19][16]
U.S. Gold Reserves
Why U.S. gold still shows up at $42.22 an ounce
The number I had in my head was $44. The statutory figure is $42 and 2/9 per fine troy ounce, about $42.2222, fixed since 1973. The Treasury showed about 261.499 million fine troy ounces and an $11.041 billion book value in its October 23 reserve report. The gold belongs to Treasury. The Fed holds dollar-denominated gold certificates linked to the statutory value. Mark the same ounces to the November 20 spot quote and you get around $923 billion. That’s a market-value illustration of the same metal. The number on the books is the statutory valuation. The history of how Treasury accumulated the gold is a separate article. [54][55][8]
Dollar Settlement
Where stablecoins add another buyer
The stablecoin piece was always about where the dollars go after somebody buys the token. If a dollar-backed issuer expands and backs those new tokens with short Treasuries, the issuer needs to buy the underlying paper. That can pull new people into dollar settlement and extend demand for bills. If users fund the purchase by redeeming a money-market fund that already held the same bills, think about the incremental demand. Some or all of the holdings may have moved to a different account. The Treasury Borrowing Advisory Committee makes exactly that distinction about offshore demand versus money that’s already in dollars. [56][57]
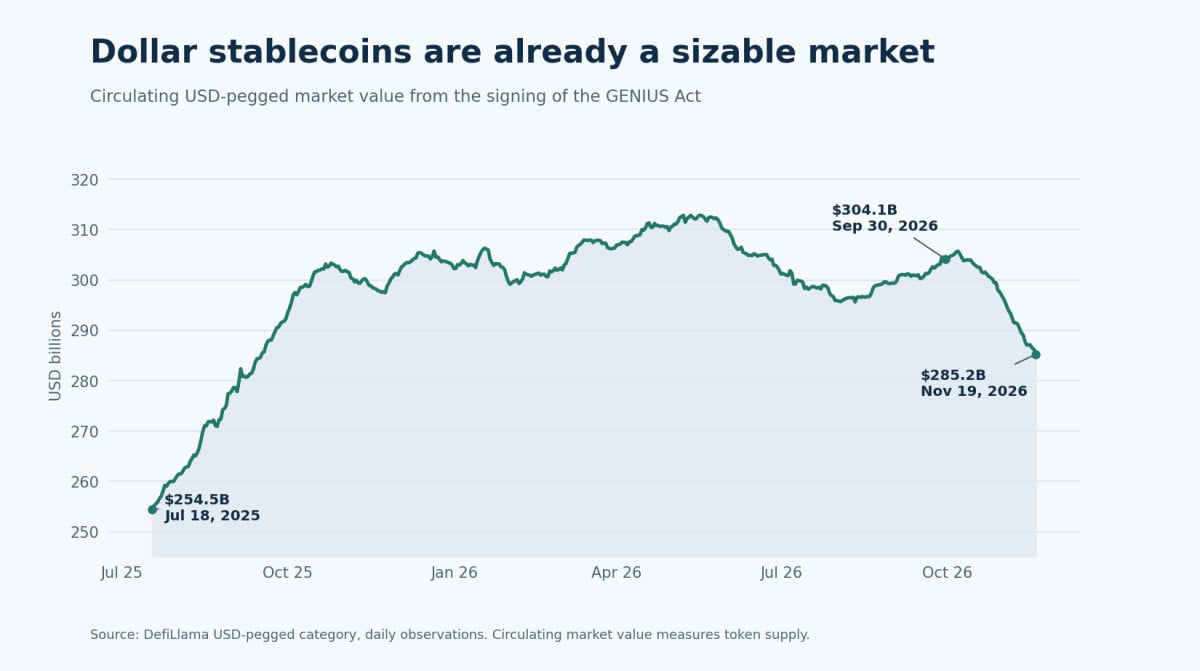
The rail is already large enough to measure. Tether’s third-quarter reserve release disclosed $132.4 billion of direct and indirect Treasury-bill exposure. DefiLlama’s historical series puts circulating dollar-pegged stablecoins at about $285.2 billion on November 19, down from $304.1 billion at September 30. The first number measures one issuer’s bill exposure. The second measures token market value across issuers. An issuer can also hold cash, eligible repo or money-market funds. Counting the tokens as if each dollar were a newly purchased bill would overstate the effect. [58][59][60][57]
The U.S. has already passed the GENIUS Act. The OCC published its final rule in October, and it says the Act and the rule take effect on January 18, 2027. Qualifying Treasuries, including bills, notes or bonds with a remaining maturity of 93 days or less, are among the allowed reserve assets for covered U.S. payment stablecoins. Europe has MiCA, and Hong Kong has had a licensing regime since August 2025. Adoption still depends on where the tokens are accepted, how they’re redeemable and whether businesses use them to settle real obligations. My view is that a future crisis could speed that up. The infrastructure is being put in place before we know what that crisis looks like. [60][61][62][63][56]
Pattern Nexus Lens
What would change my mind
I think the Fed is going to keep the price of money high long enough to squeeze rate-sensitive positions. It has the option to keep reserves ample and to buy more bills later if it needs to. We have watched it use one tool without pulling the other in the same direction. This month the evidence shows expensive borrowing, an existing stock of Fed support built earlier in the year, and ongoing reinvestment. [1][2][20][4][5][13]
- March and 4.25%. If the Fed’s target moves above 4.25%, the one-more-hike version failed. If they’re still hiking after March, my March stopping window failed. I’d expect a sustained step down in core inflation or a sharp deterioration in the jobs data to shift those odds earlier.
- New reserve expansion. Look for a Desk schedule with positive reserve-management purchases and follow the reserve and asset levels across several H.4.1 releases. Match the flows to the Treasury cash balance so a short-lived drop in the government’s account doesn’t get credited to Fed buying.
- Dollar squeeze. The index clearing 105 would take the price call another step. A persistent funding-basis move, repeated repo pressure and rising facility use would give the squeeze thesis a stronger test. If funding remains orderly, I’d call the dollar move an exchange-rate rally and leave it there.
- Reserve rotation. Track actual bill purchases by foreign holders and gold holdings in tonnes. Compare central-bank portfolios at common valuation dates. A lower gold price alone will make the gold share look smaller even if the holdings have grown.
- Stablecoin demand. Follow issuer reserve reports alongside aggregate token supply and redemptions. To show a durable new source of bill demand, I want to see evidence that it brings in funds from outside balances already parked in dollars.
I got the direction of the dollar move and the metals reversal closer than I got the long end. I was early to the return of bill buying. The latest schedule tells me the expansion phase has paused. If the next numbers change that, they’ll show up in the same series linked here. [40][9][10][11][12][4]
Methodology
Methodology and data access
The cutoff is November 20, 2026, Chicago time. Market points use the latest completed source observation for each series as shown. November 20 bullion is intraday. The Fed balance-sheet table uses Wednesday levels throughout. The weekly-average Treasury General Account and the daily funding spread are labeled separately. The purchase schedule is by operation period. The operation results use the operation date and accepted par amount, with settlement dates retained in the data. The newest schedule period has only a partial set of results at the cutoff. [5][4][34][8][28]
The CME futures translation is 100 − final settlement. The change in each price or index is 100 × (end ÷ start − 1). The Treasury-bill share is month-end bills divided by total marketable debt, both on the same Treasury Fiscal Data basis. The nominal-minus-real calculation is a market breakeven spread, and the ACM term premium is a separate estimated component of fitted nominal yields. The latest observations for FX reserves, official gold purchases, M2 and stablecoins have different release lags. The research data files record dates, units and source links. [3][13][14][47][18][16][48][36][59]
The dated Pattern Nexus record is graded against the wording available on the published pages. Some pages have been updated since first publication. Exact timing requires an independently dated original version. The 105/110 dollar levels, a fixed $40 silver target, and the proposed Fed motive should each be scored on their own evidence. [40][9][10][12]
FAQ
Frequently asked questions
Can the Fed hike rates and buy Treasuries at the same time?
Yes. The FOMC can set the overnight target higher and direct the Desk to maintain reserves or reinvest principal. Watch the split between reinvestment and reserve-management purchases, then compare the actual balance sheet with the announcement. [20][4][5]
Did markets expect the Fed to stop at 4.25% in March?
The November 19 March futures contract implied a 4.395% monthly effective-rate average, compared with the current effective rate of 3.88%. That puts more tightening into the curve than the one-hike path that tops out at 4.25%. April and May contracts priced still-higher monthly averages in that snapshot. [3][28]
Did central banks sell gold to buy U.S. bills?
The global data show strong official gold purchases, a change in reserve shares driven in part by market values, and a mixed record of foreign bill flows. Identifying a direct switch would require matching issuer, holder, period, and transaction or valuation data. [48][15][19][17]
Research Sources
Research and Data Sources
Market quotes and estimates use the source dates shown. The accompanying research data include the observation files and links to the underlying releases.
- Federal Reserve · September 16, 2026 FOMC statement. 25 bp increase to 3.75%–4.00%.
- Federal Reserve · October 28, 2026 FOMC statement and vote. 3.75%–4.00% hold, 10–2, with two dissents for a hike.
- CME Group · 30-Day Federal Funds Futures, final November 19, 2026 settlements. 100 minus settlement is the contract month’s implied average effective rate, in percent.
- New York Fed · Treasury Securities Operational Details and monthly schedules. Period-by-period reinvestment and reserve-management purchase plans.
- Federal Reserve · H.4.1 release dated November 19, 2026. Wednesday holdings and liabilities for November 18. Historical H.4.1 component observations are carried in FRED.
- Reuters · November 20, 2026 U.S. Dollar Index market snapshot. DXY near a 19-month high. Quoted intraday levels are tied to the reporting snapshot.
- Reuters · Gold and silver at January 2026 record highs. January 29 spot benchmark reporting, including the $5,594.82 gold high.
- Reuters · November 20, 2026 gold and silver market snapshot. Spot gold and silver at the November 20 reporting cut, and corroboration of the January silver high.
- Pattern Nexus · March 12, 2026 Macro Wrap. Conditional DXY move through 100, with 105 and 110 as next levels of interest.
- Pattern Nexus · Silver Isn’t Wrong — But the Risk Regime Has Shifted. December 19, 2025 warning about leverage and the severity of a possible reversal.
- Pattern Nexus · Gold Breaks, Yields Surge, Oil Climbs. March 22, 2026 conditional downside area near $3,800 in gold.
- Pattern Nexus · Public Record Call Audit, 472 URLs. August 20, 2026 public record of the sub-3% ten-year miss and the gold stabilization miss.
- U.S. Treasury · Daily Treasury par yield curve rates, calendar 2026. Nominal yields, including November 19.
- U.S. Treasury · Daily Treasury par real yield curve rates, calendar 2026. Market-based real TIPS yields.
- European Central Bank · The international role of the euro, June 2026, Chart 7. Market-value shares of total official reserves including gold at year-end 2025.
- International Monetary Fund · COFER second-quarter 2026 data brief. Currency shares use foreign exchange reserves only; gold is outside the denominator.
- Federal Reserve staff · Global gold and Treasury Reserve Holdings, September 3, 2026. Valuation, matched-scope comparisons and foreign official Treasury flows.
- U.S. Treasury Fiscal Data · Monthly Statement of the Public Debt, summary of outstanding securities. Face amounts of Treasury bills and total marketable Treasury securities, including intragovernmental holdings.
- U.S. Treasury · Treasury International Capital Data for September 2026. Monthly changes in foreign residents’ holdings of U.S. Treasury bills, including both official and private holders.
- Federal Reserve · Minutes of the October 27–28, 2026 FOMC meeting. Policy debate, inflation risks, market conditions and Desk directive.
- Federal Reserve · FOMC meeting calendars. December 8–9, 2026; January 26–27 and March 16–17, 2027.
- Bureau of Economic Analysis · Personal Income and Outlays, September 2026. Headline and core PCE year-over-year inflation.
- Bureau of Labor Statistics · October 2026 CPI release, November 10. Monthly headline, core and energy CPI; October 2025 survey gap.
- Bureau of Labor Statistics · Employment Situation, October 2026. October payrolls and unemployment.
- Bureau of Economic Analysis · Real GDP, third quarter 2026 advance estimate. Advance estimate and preceding-quarter comparison.
- Associated Press · October Fed minutes and CME FedWatch pricing. Contemporaneous report of nearly 95% odds of a December hike.
- University of Michigan RSQE · U.S. Economic Outlook for 2027–2028, November 2026. Independent forecast of December and March hikes, reaching 4.25%–4.50%.
- New York Fed · SOFR and reference rates. Secured overnight funding rate. The dataset also includes IORB, EFFR and ON RRP.
- Pattern Nexus · The Calm Before the Liquidity Storm. October 17, 2025 structural call for the return of liquidity support.
- Pattern Nexus · QT Is Over: The System Just Crossed Its Reserve Floor. October 23, 2025 call on the approaching runoff pivot and reinvestment or facility support.
- Federal Reserve · October 29, 2025 FOMC decision. Announced an end to aggregate securities runoff effective December 1, 2025.
- New York Fed · December 10, 2025 statement on reserve management purchases. First purchases planned to start December 12, with roughly $40 billion of RMPs in the first period.
- Pattern Nexus · December 10, 2025: QT Ends, QE-Lite Begins. Contemporaneous coverage of the December decision and short-term bill purchases.
- New York Fed · Treasury Securities Operations, accepted par amounts. Operation and settlement dates, submitted and accepted par amounts.
- Freddie Mac via FRED · 30-Year Fixed Rate Mortgage Average. Weekly mortgage rate observations.
- Federal Reserve via FRED · M2 money stock, seasonally adjusted. Monthly broad money. Latest observation available for this report is September 2026.
- Pattern Nexus · Ample Reserves, Uneven Liquidity. Funding distribution and the limits of an aggregate reserve number.
- Pattern Nexus · Hard Assets Follow Liquidity, Not Inflation — A Full Data Reconstruction. Original liquidity framework.
- Pattern Nexus · Hard Assets, Liquidity & Stablecoins, 2026 Data Update. Updated liquidity and hard-assets research, including sensitivity to construction choices.
- Pattern Nexus · The Dollar’s Last Stand. November 4, 2025 dollar-squeeze thesis. Current page includes subsequent updates.
- Federal Reserve via FRED · Nominal Broad U.S. Dollar Index. Distinct trade-weighted currency index. January 2006 = 100.
- Bank for International Settlements · Triennial Central Bank Survey, OTC foreign exchange turnover in April 2025. U.S. dollar appears on one side of 89.2% of trades.
- Pattern Nexus · Gold at $4,300+: This Isn’t a Bull Run — It’s a System Reset. October 17, 2025 conditional $5,000–$6,000 stabilization zone.
- S&P Dow Jones Indices and Nasdaq via FRED · S&P 500 and Nasdaq Composite. Index close observations in the readout; data-series links are listed in the source register.
- ICE Data Indices via FRED · U.S. High Yield option-adjusted spread. Index option-adjusted spreads in percentage points.
- EIA via FRED · Europe Brent Spot Price FOB. Daily Brent crude oil in dollars per barrel.
- New York Fed · Adrian–Crump–Moench Treasury term-premium estimates. Model-based term premium. A decomposition of fitted yields, subject to model uncertainty.
- World Gold Council · Gold Demand Trends, Q3 2026, central banks. Estimated official-sector net purchases, including WGC estimates for unreported buying.
- U.S. Treasury via FRED · Total foreign holdings of long- and short-term Treasuries. Cross-check for foreign holdings of all maturities, in millions of dollars.
- Basel Committee on Banking Supervision · Basel Framework CAP10, definition of eligible capital. Common Equity Tier 1 plus Additional Tier 1 capital.
- Federal Reserve · Regulation Q § 217.32, general risk weights. Zero risk weight for qualifying allocated or vaulted bullion to the extent it offsets bullion liabilities.
- Pattern Nexus · Gold Didn’t Moon — It Locked Into a New Liquidity Rail. Prior gold and liquidity analysis around the end of QT.
- Pattern Nexus · Gold Isn’t Breaking Out — It’s Absorbing Policy Failure. Prior gold research and its monetary interpretation.
- U.S. Department of the Treasury · U.S. International Reserve Position, October 23, 2026. Gold volume in millions of fine troy ounces and statutory book value.
- Federal Reserve and U.S. Treasury · Statutory valuation of Treasury-owned gold. $42 and 2/9 per fine troy ounce since 1973. Treasury owns the gold; the Fed holds certificates.
- Pattern Nexus · Stablecoins Are the New Liquidity Hose. Earlier stablecoin settlement and demand thesis.
- Treasury Borrowing Advisory Committee · Stablecoin footprint and Treasury demand, February 2026. Potential new demand versus switches from existing dollar holdings.
- Tether · Q3 2026 reserve attestation release. Issuer-reported direct and indirect Treasury-bill exposure, $132.4 billion.
- DefiLlama · Stablecoin supply by peg, historical aggregate endpoint. USD-pegged circulating market value, not underlying Treasury exposure.
- U.S. Congress · GENIUS Act, Public Law 119-27. Eligible reserve assets and effective-date provision.
- Office of the Comptroller of the Currency · October 2026 GENIUS Act final rule and effective date. OCC issuer rule takes effect January 18, 2027.
- European Union · Markets in Crypto-Assets Regulation, Regulation (EU) 2023/1114. EU stablecoin provisions under Titles III and IV.
- Hong Kong Monetary Authority · Regulatory regime for stablecoin issuers. Issuer licensing in effect since August 1, 2025.
Series and vintage links. November 19 H.4.1 release vintage, Nasdaq Composite, VIX, and New York Fed term-premium workbook. The research data include all series identifiers.
Pattern Nexus research note. Forecasts and interpretations are dated to the cutoff. Every figure includes its measurement dates. The article and accompanying data preserve the evidence needed to revisit those calls.
What's Your Reaction?
 Like
1
 Dislike
0
 Love
0
 Funny
0
 Wow
0
 Sad
0
 Angry
0

Nexus (Christopher)
Founder of Pattern Nexus. I research markets, macro, geopolitics, AI, history, ancient systems, and the patterns most people overlook. I’m also building Market Radar, a trading scanner designed to read pressure, risk, confirmation, and setup quality before ch…
Related research

Washington Turns Waller’s 50bp Warning Into an Inflation-Psychology Test
Federal Reserve Governor Christopher Waller said on November 18 that the Fed may need to act more aggressively against inflation, including…
6 shared topics.
Hard Assets, Liquidity and the Cost of Leverage
Where the historical relationship holds, where it breaks, and what the evidence says about housing. This November update extends the Patter…
6 shared topics, same research avenue.
Everything Bubble 3 — Markets Priced in Gold Reveal
Pricing markets in gold through October 29, 2026 exposes the dispersion beneath nominal records, near-record leverage, high-rate reserve su…
4 shared assets.
The World I’ve Been Mapping Is Taking Shape
I connect the developments now taking shape across AI infrastructure, private power, critical minerals, the Iran energy shock, digital doll…
3 shared assets, same research avenue.
Fed Turns Stablecoin Issuance Into a Treasury-Backed Bank Rulebook
The Federal Reserve requested public comment on two GENIUS Act proposals that would establish a regulatory framework for Board-supervised p…
6 shared topics, 3 shared assets.
The Oil War Is Becoming a Global Economic War
An extensive Pattern Nexus reconstruction linking the Iran/Hormuz disruption with Ukrainian refinery attacks, diesel shortages, Saudi pipe…
4 shared topics, 3 shared assets, same research avenue.
Fed Just Hiked Into a 5% 10-Year: Why the Next Liquidity Cycle May Arrive Faster
The Federal Reserve just raised the federal-funds target to 3.75%–4.00% while the 10-year Treasury closed at 5.01%, the 30-year at 5.35%, a…
5 shared topics.
August CPI Just Activated the Fed’s One-Hike Option—and Deepened the Long-End Trap
August CPI rose 0.4% on the month and 3.4% from a year earlier, while core CPI rose a hotter-than-expected 0.3% even as its annual rate eas…
3 shared assets.
Comments (0)
Security Check
Please complete the captcha to verify you are human.