
The 2075 GDP Rankings Aren’t About Power — They’re About Demographic Compounding
Goldman Sachs’ 2075 GDP projections aren’t a leaderboard of global power. They’re a demographic compounding map built on liquidity, population, and time. Here’s how to read it correctly.

Nominal GDP over 50 years is mostly population × time × inflation, not institutional excellence.
Large GDP numbers do not equal system control, currency dominance, or real power.
This entire projection assumes global liquidity expansion continues.
What This Projection Is (And Isn’t)
Let’s get this straight immediately. This list is not telling you who will dominate geopolitics, technology, finance, or culture in 2075.
It’s a continuity model. It assumes no global system reset, no prolonged capital controls, no monetary fracture, and no sustained collapse in global credit formation.
Under those assumptions, population-heavy countries compound. Slowly. Relentlessly. Mechanically.
This forecast only works in a world where liquidity keeps expanding and capital keeps flowing.
Why Population Dominates the Rankings
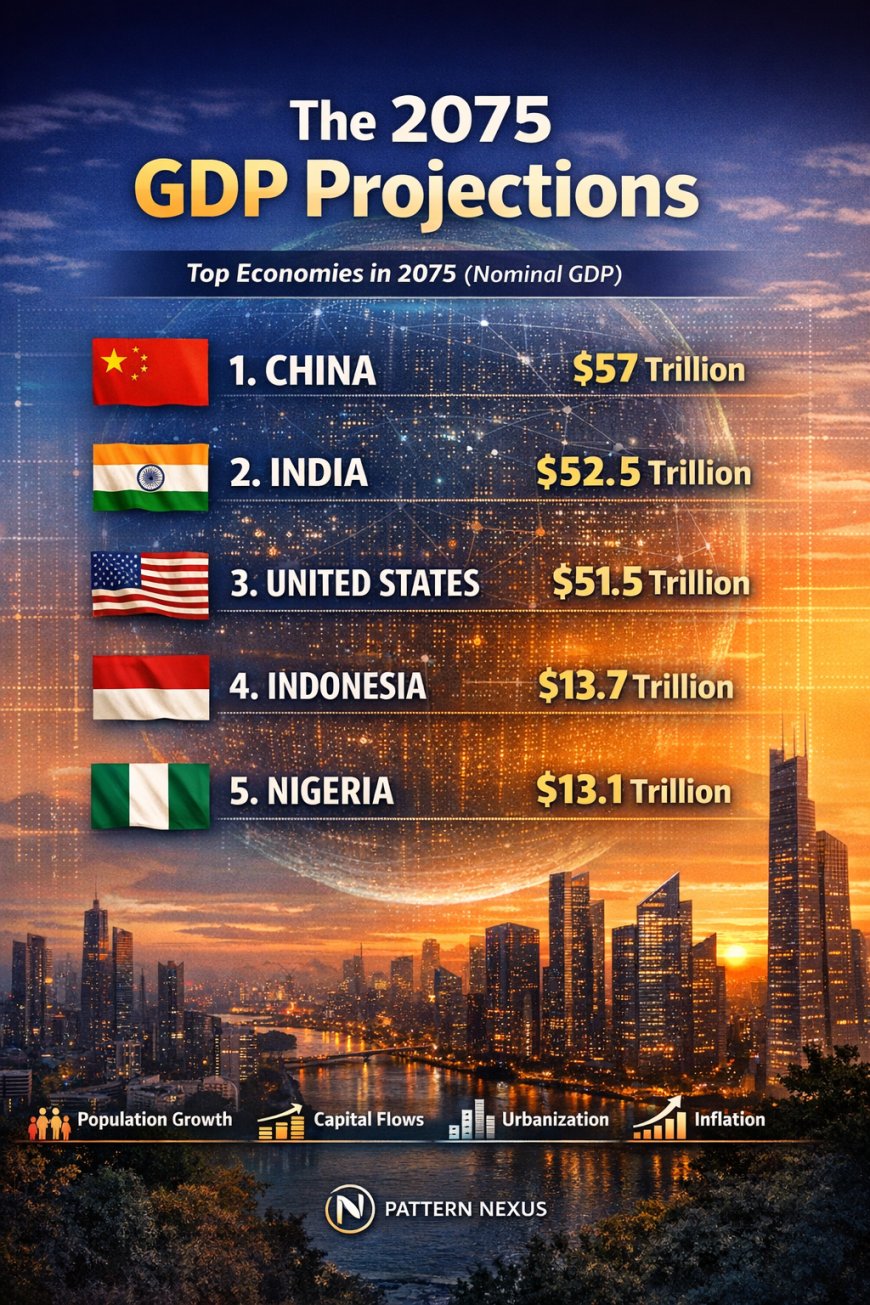
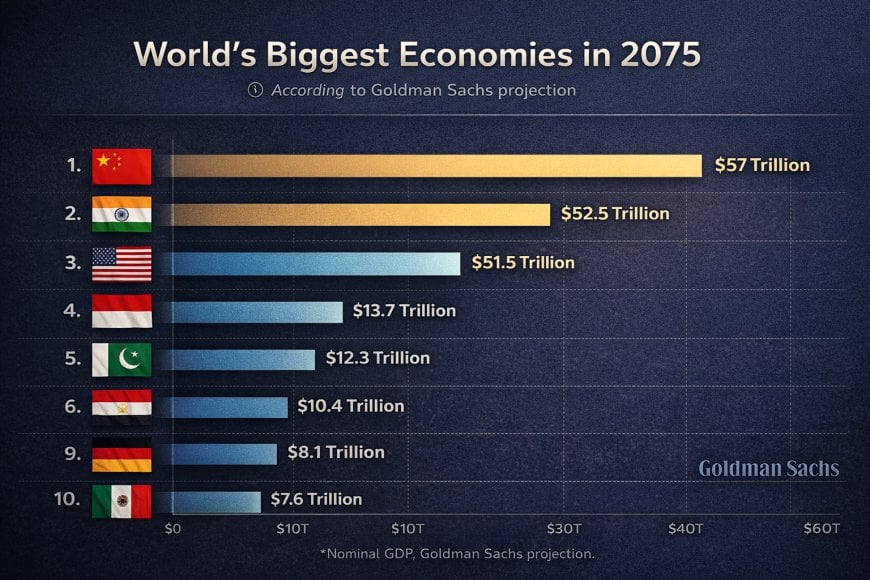
- 🇨🇳 China: $57T
- 🇮🇳 India: $52.5T
- 🇺🇸 United States: $51.5T
- 🇮🇩 Indonesia: $13.7T
- 🇳🇬 Nigeria: $13.1T
- 🇵🇰 Pakistan: $12.3T
- 🇪🇬 Egypt: $10.4T
- 🇧🇷 Brazil: $8.7T
- 🇩🇪 Germany: $8.1T
- 🇲🇽 Mexico: $7.6T
- 🇬🇧 United Kingdom: $7.6T
- 🇯🇵 Japan: $7.5T
- 🇷🇺 Russia: $6.9T
- 🇵🇭 Philippines: $6.6T
- 🇫🇷 France: $6.5T
- 🇧🇩 Bangladesh: $6.3T
- 🇪🇹 Ethiopia: $6.2T
- 🇸🇦 Saudi Arabia: $6.1T
- 🇨🇦 Canada: $5.2T
- 🇹🇷 Turkey: $5.2T
- 🇦🇺 Australia: $4.3T
- 🇮🇹 Italy: $3.8T
- 🇲🇾 Malaysia: $3.5T
- 🇰🇷 South Korea: $3.4T
- 🇿🇦 South Africa: $3.3T
- 🇹🇭 Thailand: $2.8T
- 🇨🇴 Colombia: $2.6T
- 🇵🇱 Poland: $2.5T
- 🇦🇷 Argentina: $2.4T
Countries like Nigeria, Pakistan, Bangladesh, Ethiopia, and Egypt don’t appear near the top because they suddenly become highly efficient or well-governed.
They appear because they have:
- Large and growing populations
- Urbanization runway
- Basic capital formation potential
- Decades of consumption growth ahead
Low productivity multiplied by hundreds of millions of people still produces large nominal numbers over 50 years.
That doesn’t mean high living standards. It means volume.
The Real Signals Hiding in Plain Sight
The most important signal in this entire projection isn’t China at #1 or India close behind.
It’s the United States still sitting in the same GDP band in 2075 despite demographic headwinds.
That only works if productivity, capital leverage, and system control remain disproportionately concentrated.
Europe’s quiet slide tells the opposite story. Aging populations, lower disruption tolerance, and slower capital formation don’t cause collapse — they cause relative stagnation.
Europe doesn’t fall apart. It simply stops compounding.
Pattern Nexus Lens
This projection is not a power map. It’s a demographic liquidity map.
Capital control, financial plumbing, energy access, and technological choke points decide who governs the system — not raw GDP totals.
Big numbers don’t run the world. Control layers do.
FAQ
Does this mean emerging markets will dominate?
No. It means consumption and population growth shift there. Control does not automatically follow.
Is the U.S. “declining” in this model?
No. Staying near the top for 50 years implies extraordinary productivity and system leverage.
What breaks this projection?
A liquidity reset, capital controls, monetary fragmentation, or sustained geopolitical disruption.
Sources
Long-range GDP modeling, demographic projections, and macroeconomic continuity assumptions.
- Goldman Sachs – The Path to 2075
- UN World Population Prospects
- Pattern Nexus – Liquidity & Long Cycles
Qual è la tua reazione?
 Mi piace
0
Mi piace
0
 Non mi piace
0
Non mi piace
0
 Amore
0
Amore
0
 Divertente
0
Divertente
0
 Wow
0
Wow
0
 Triste
0
Triste
0
 Arrabbiato
0
Arrabbiato
0

Founder of Pattern Nexus. I research markets, macro, geopolitics, AI, history, ancient systems, and the patterns most people overlook. I’m also building Market Radar, a trading scanner designed to read pressure, risk, confirmation, and setup quality before chasing a move. Pattern Nexus is where I connect the dots between data, history, technology, and the bigger system playing out around us.
















Commenti (0)