
Stablecoins Are the New Liquidity Hose: Reading the Crypto Tape Through the Liquidity Framework
Stablecoins near $290B are no longer a side plot—they are a dollar rail, a collateral base, and a liquidity hose into crypto. If you read markets through liquidity, this helps explain why total crypto market cap keeps repricing higher even when narratives rotate.



- Stablecoins are no longer cash on the sidelines. They are a dollar rail plus a collateral base plus a leverage substrate.
- At ~9% of total crypto market cap (snapshot), stablecoins are large enough to influence regime behavior, not just short-term price moves.
- Dominance structure matters. BTC-heavy markets trade differently than broad alt-led markets, even when total market cap rises.
- DeFi is not the base layer of demand. It is a leverage amplifier that expands and contracts with liquidity conditions.
- The main signal is not narratives. It’s whether the stablecoin base is rising, flat, or shrinking.
Liquidity Framework: Core Reading Stack
These four pieces form the core of the Pattern Nexus liquidity framework: from data reconstruction, to stablecoin/T-bill rails, to the full LCI white paper, to the “one bucket, many hoses” mental model.
- Hard Assets Follow Liquidity, Not Inflation — A Full Data Reconstruction
Rebuilds the Colombo chart from scratch, constructs the PCA liquidity index, and shows that housing, gold, and equities track liquidity cycles rather than CPI, wages, or rents.
Read → - Stablecoins, Treasuries, and the Synthetic Liquidity Engine
Explains how stablecoins backed by short-duration Treasuries and cash-equivalents create a synthetic liquidity engine at the front end of the curve through leverage loops and rehypothecation.
Read → - Hard Assets Follow Liquidity: The LCI Framework White Paper
The master framework paper: builds the LCI-PCA composite from WALCL, inverted RRP and TGA, M2, and a fifth stablecoin/T-bill reservoir, then uses it to formalize the liquidity–hard-asset relationship.
Read → - One Bucket, Many Hoses: Liquidity Control After the Stablecoin Shift
Uses the “five-gallon bucket with too many hoses and holes” metaphor to show how new stablecoin and tokenized-Treasury rails change where policy liquidity goes, not just how much water is in the system.
Read →
The tape: what the charts actually say
The cleanest way to read crypto is to ignore the story-of-the-week and look at structure: total market cap, dominance, stablecoin base, and the leverage layer. This is not philosophy. It’s operational. Those four views tell you whether the market is being fed by real base growth, temporary rotation, or leverage that will unwind.
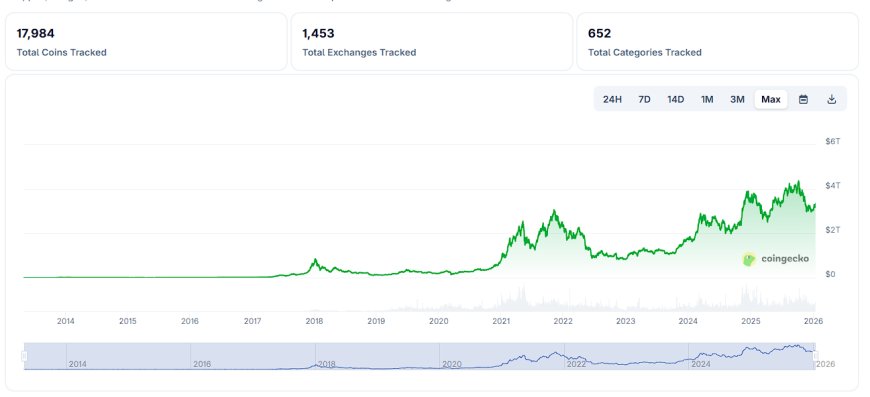
First, the market itself is now massive and highly diversified. The dashboard snapshot shows 17,984 coins tracked, 1,453 exchanges, and 652 categories. That’s not a small sandbox anymore. It’s an arena with an enormous long tail of high-beta instruments, and that long tail is exactly where liquidity expresses itself when risk appetite broadens.
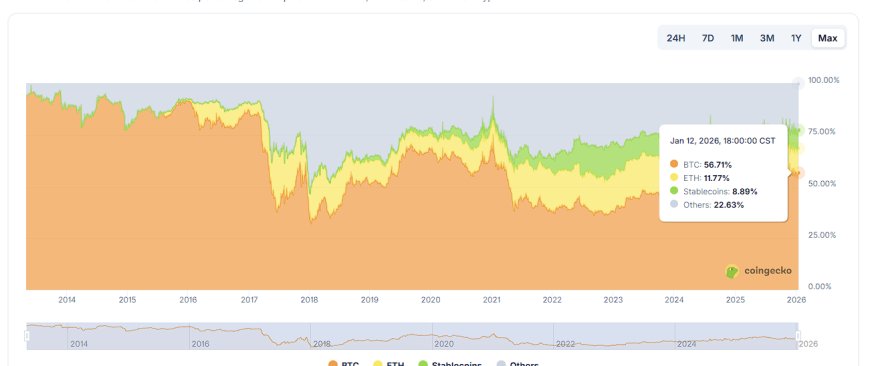
Second, the composition snapshot (Jan 12, 2026, 18:00 CST) is the tell because it captures the market’s internal allocation. It shows BTC 56.71%, ETH 11.77%, Stablecoins 8.89%, Others 22.63%. That is a top-heavy market where the index behavior is still dominated by the two core liquidity magnets (BTC, ETH), while stablecoins have grown into a structurally meaningful base.
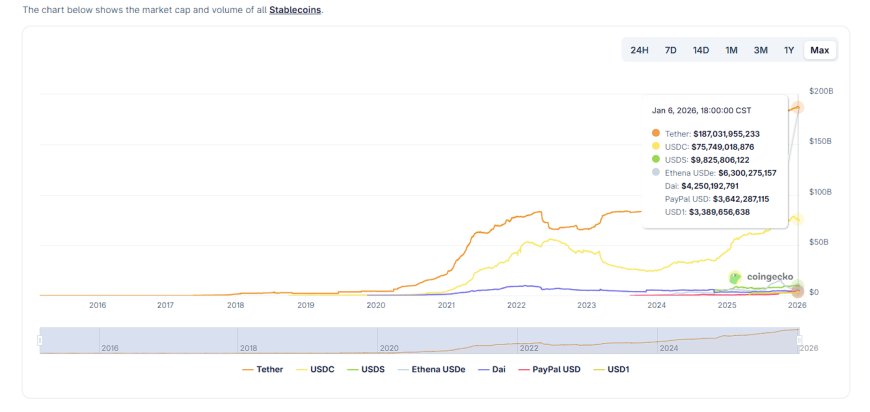
Third, the stablecoin chart is the regime changer. Stablecoins aren’t a “category” the way meme coins are a category. Stablecoins are the settlement layer that makes the arena behave differently. When stablecoins rise into a ~$300B base, they create internal cash inventory, compress friction, and make the market more resilient to dips while also enabling faster reflexive upside.
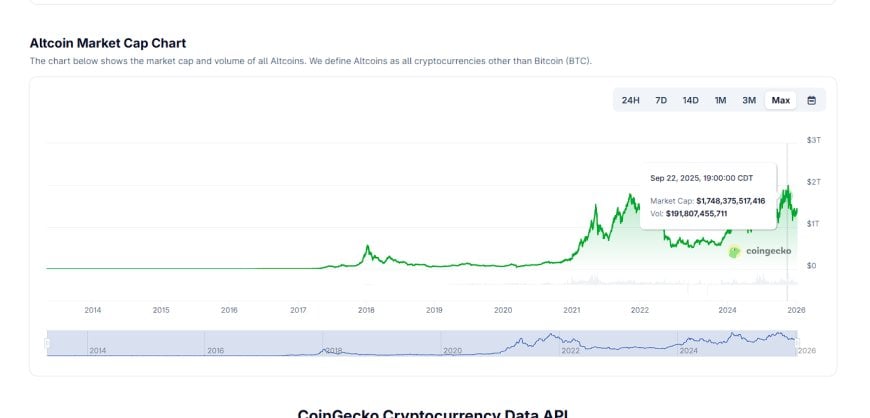
Fourth, the altcoin chart confirms what happens when liquidity is available. The non-BTC complex can run very large. One snapshot shows an altcoin market cap of $1.748T with volume around $191.8B (Sep 22, 2025, 19:00 CDT). In liquidity terms, the high-beta perimeter is deep enough to absorb enormous flows when conditions allow it.
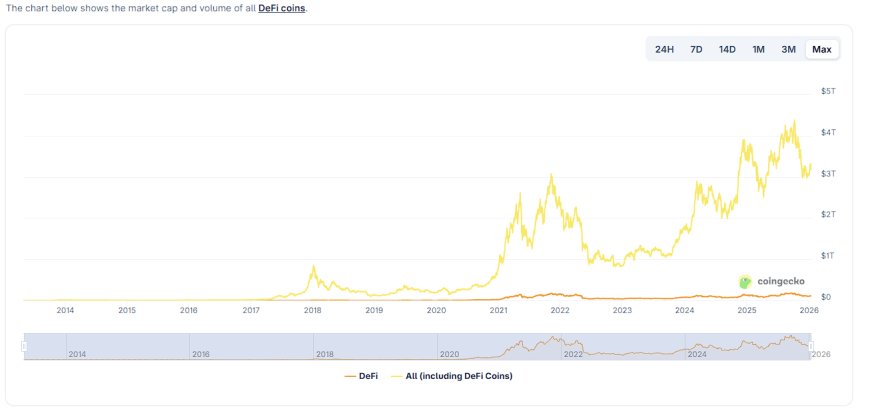
Fifth, DeFi is the leverage lens. It often looks small relative to total market cap, yet it creates outsized volatility. That’s because DeFi is not demand. DeFi is balance sheet mechanics.
The liquidity framework: why crypto is a liquidity gauge
In the Pattern Nexus framing, markets are not primarily moved by belief. They are moved by the availability, cost, and routing of liquidity. Price is the scoreboard of marginal liquidity, not a clean measure of intrinsic value. Crypto is simply the fastest scoreboard in the building.
Crypto is one of the purest liquidity thermometers because it is globally accessible, reflexive (collateral up → leverage up → price up), fast (reprices in minutes, not quarters), and structurally sensitive to collateral quality and funding conditions. That’s why total crypto market cap behaves like a liquidity index with extra volatility. When the system has abundant deployable collateral, crypto inflates quickly. When collateral is scarce or funding tightens, the same mechanism runs in reverse.
Think of the global system as one bucket. It leaks through many holes. The key change is the hoses. Liquidity is increasingly injected into specific channels instead of lifting the whole bucket evenly. Stablecoins are a hose into crypto. That means crypto can reprice even when the broader macro narrative is confused, because the channel pressure is what matters.
Stablecoins as the new hose: base money, velocity, collateral
Stablecoins matter because they are not just a quote currency. They change the plumbing. They introduce a persistent, transferable dollar-like base that can move across exchanges, chains, and jurisdictions without waiting on bank rails. That changes market behavior even if the base number doesn’t move dramatically day to day.
The practical takeaway is simple. When the stablecoin base is expanding, crypto becomes harder to push down and easier to re-inflate. When the stablecoin base is shrinking, rallies become thinner and more fragile because the internal cash inventory is being drained.
| Stablecoin | Market cap | Share (of shown total) |
|---|---|---|
| Tether (USDT) | $187,031,955,233 | ~64.5% |
| USDC | $75,749,018,876 | ~26.1% |
| USDS | $9,825,806,122 | ~3.4% |
| Ethena USDe | $6,300,275,157 | ~2.2% |
| Dai | $4,250,192,791 | ~1.5% |
| PayPal USD | $3,642,287,115 | ~1.3% |
| USD1 | $3,389,656,638 | ~1.2% |
Concentration changes how liquidity behaves in stress. A highly concentrated base can be extremely efficient in normal conditions, then extremely sensitive to confidence shocks, redemption waves, or venue-level frictions. This isn’t moral judgment. It’s plumbing reality.
Dominance map: reading BTC, ETH, Stablecoins, and Others
Dominance charts are not tribal. They are a structural map of risk preference and collateral behavior. Our Jan 12 snapshot shows BTC at 56.71%, ETH at 11.77%, Stablecoins at 8.89%, Others at 22.63%.
If you translate that into an implied market cap picture using the stablecoin base as an anchor, you get a market on the order of ~$3.3T in that snapshot regime, with approximate buckets around BTC ~$1.85T, ETH ~$0.38T, Stablecoins ~$0.29T, Others ~$0.74T. The precision is not the point. The structure is the point.
- BTC dominance high usually means risk-on, but concentrated. The market is leaning into the most liquid collateral narrative asset.
- ETH dominance often reflects infrastructure premium but still trades as liquidity-sensitive beta.
- Stablecoins near ~9% is a meaningful internal cash position. That reduces fragility and increases the market’s ability to re-lever quickly.
- Others at ~22.6% is the high-beta perimeter. When it expands, you are in broad risk appetite. When it contracts, the market is de-risking into the core.
This is why alt season is not a vibe. It is a measurable rotation: stablecoin base rising, BTC and ETH consolidate, then liquidity leaks outward from core collateral into the perimeter as participants reach for beta.
DeFi: the leverage layer, not the demand layer
The DeFi chart is almost comical in how it illustrates the reality. DeFi can look like a thin layer relative to the total market cap line, yet it creates outsized volatility. That is leverage behavior. DeFi is not the reason the market goes up. It’s the mechanism that makes moves bigger than they “should” be.
- A balance sheet layer: collateral in, borrow out, loop, repeat.
- A duration transformer: short-term funding can be turned into long exposure quickly.
- A liquidation engine: when liquidity tightens, forced selling converts paper stability into cascading volatility.
DeFi does not need to be large to matter. It just needs to be connected. When the stablecoin base is thick and friction is low, DeFi becomes the accelerator pedal. When conditions reverse, it becomes the trap door.
Base growth is the fuel. Dominance is the steering wheel. DeFi is the turbo. If you confuse turbo for fuel, you will misread the regime.
Macro implications: dollar plumbing and transmission changes
This is the part most people still underweight. Stablecoins are private dollar distribution infrastructure. They sit between real-world funding and on-chain risk markets, and they can change how liquidity feels even if traditional aggregates look calm. That does not mean the Fed no longer matters. It means transmission becomes more complex, more routed, and more dependent on rail-level friction and collateral formats.
This is why the stablecoin base is the keystone metric. A rising base implies the rail is being used more, internal cash inventory is increasing, and the system can translate marginal demand into price. A falling base implies the opposite. Liquidity is being withdrawn, and the market becomes more sensitive to shocks.
What to watch next: a practical dashboard
If the goal is to analyze crypto through the liquidity framework, you need a small set of repeatable checks. This is the daily discipline that keeps you out of narrative traps.
- Total stablecoin market cap trend rising, flat, or shrinking is the regime signal.
- Stablecoin dominance is the ecosystem’s internal cash ratio.
- Issuer concentration changes can alter liquidity distribution and stress behavior.
- BTC dominance trend rising often means consolidation in core collateral, falling often means broad risk-on.
- Altcoin market cap perimeter expansion confirms liquidity leak outward from the core.
- DeFi proxy expansion signals leverage building, contraction signals deleveraging.
- Volume and funding conditions sustained positive pressure with rising stablecoin base is classic liquidity chasing beta behavior.
You can be bullish and still demand structural confirmation. The confirmation is not a headline. It’s the stablecoin base trend, confirmed by dominance behavior and perimeter expansion.
Pattern Nexus Lens
- Liquidity is routed, not just created stablecoins are a routing upgrade.
- Collateral quality drives reflexivity stablecoins thicken collateral and accelerate repricing.
- Dominance is a structural signal it measures where risk is concentrating.
- Leverage layers magnify regimes DeFi amplifies both upside and forced selling.
- Rails become governance surfaces money as software becomes permissioned infrastructure.
FAQ
آپ کا ردعمل کیا ہے؟
 پسند کریں
0
پسند کریں
0
 نہ پسند
0
نہ پسند
0
 محبت
0
محبت
0
 مزاحیہ
0
مزاحیہ
0
 واہ
0
واہ
0
 اداس
0
اداس
0
 غصہ
0
غصہ
0

Founder of Pattern Nexus. I research markets, macro, geopolitics, AI, history, ancient systems, and the patterns most people overlook. I’m also building Market Radar, a trading scanner designed to read pressure, risk, confirmation, and setup quality before chasing a move. Pattern Nexus is where I connect the dots between data, history, technology, and the bigger system playing out around us.















تبصرے (0)