The Sun, Money and the Global Core: What Survived a 375-Year Test
I rebuilt the solar-recession thesis around the dominant global financial core instead of a modern U.S. sample: Amsterdam and the guilder, London and sterling, then New York and the dollar. Across 375 years, the data reveal a narrow combined turning-year anomaly and a strange six-year lead. The deeper pass separates minima from maxima, tests six contraction thresholds and shock exclusions, reconstructs 54 reserve handoffs, deletes every historical block and contraction event, and adds lagged liquidity-interaction models. The effect is not a solar-minimum law, disappears for severe contractions, concentrates in 1850–1899, and does not validate through crops, famine or liquidity interactions. Solar timing may overlay a vulnerable system. Liquidity remains the engine.

 Pattern Nexus Premium Research
The Sun, Money and the Global Core: What Survived a 375-Year Test
I rebuilt the solar-recession thesis across 375 years of the dominant global financial core. The data found two strange patterns. It did not find a clock.
The data found a pattern. It did not find a clock.
- The first pass failed because it answered a smaller question than the one I asked. Modern global-recession data cannot test a thesis about the long movement of global money. I rebuilt the system from 1650 around the dominant financial core: Amsterdam and the guilder, London and sterling, then New York and the dollar.
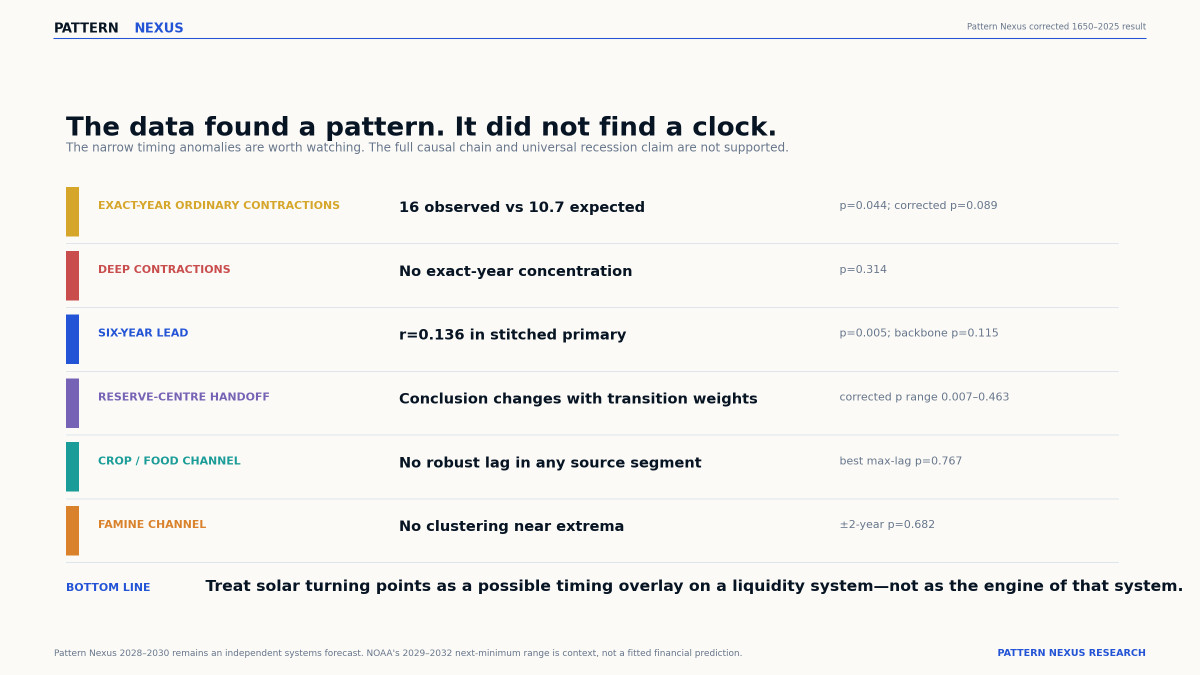
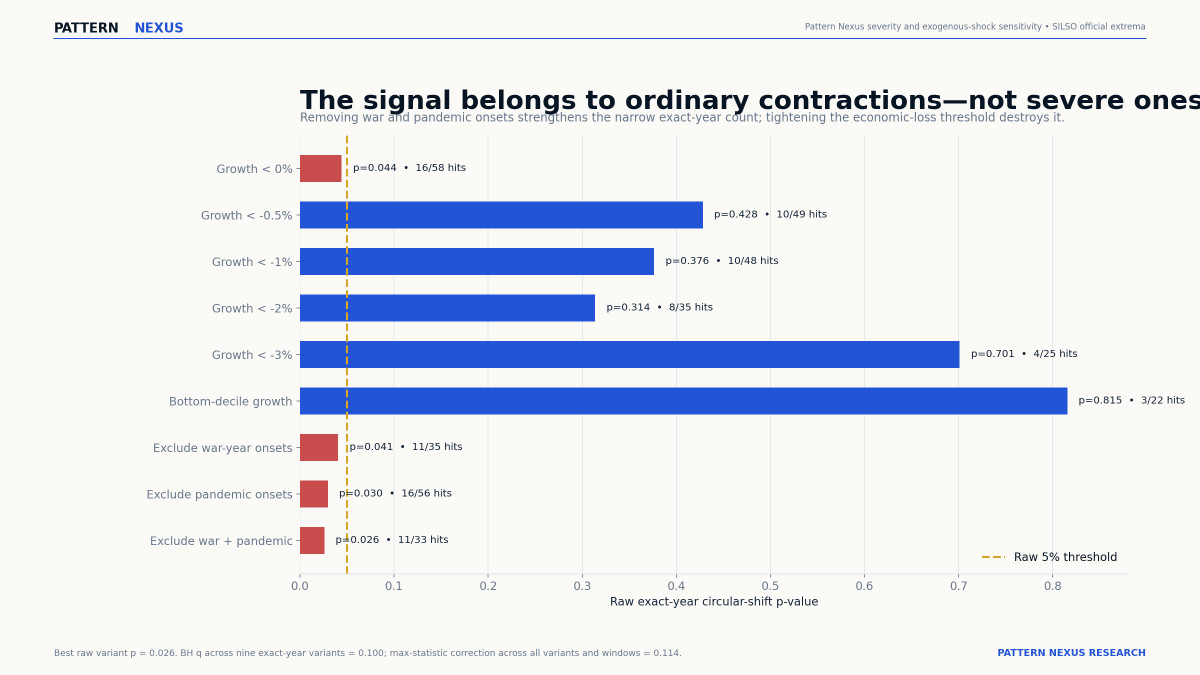
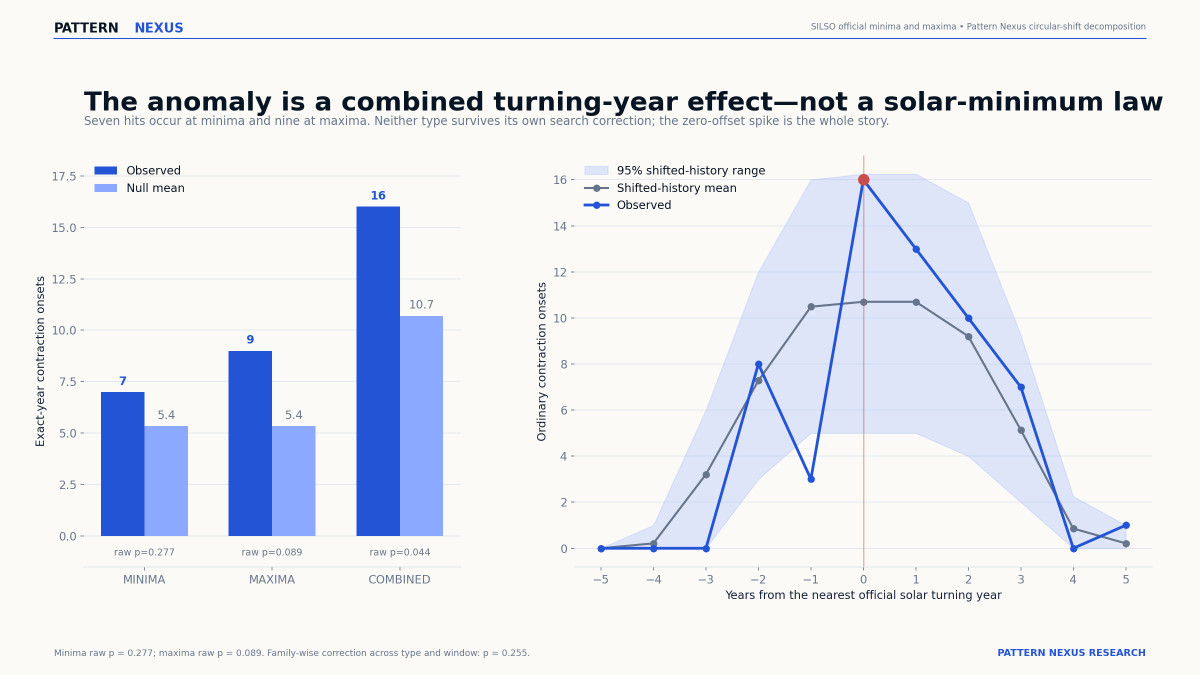
- Sixteen of 58 ordinary contraction onsets since 1755 occurred in the exact year of an official solar minimum or maximum. The circular null expects 10.70. The raw probability is 0.044. After correcting for the four timing windows inspected, it becomes 0.089.
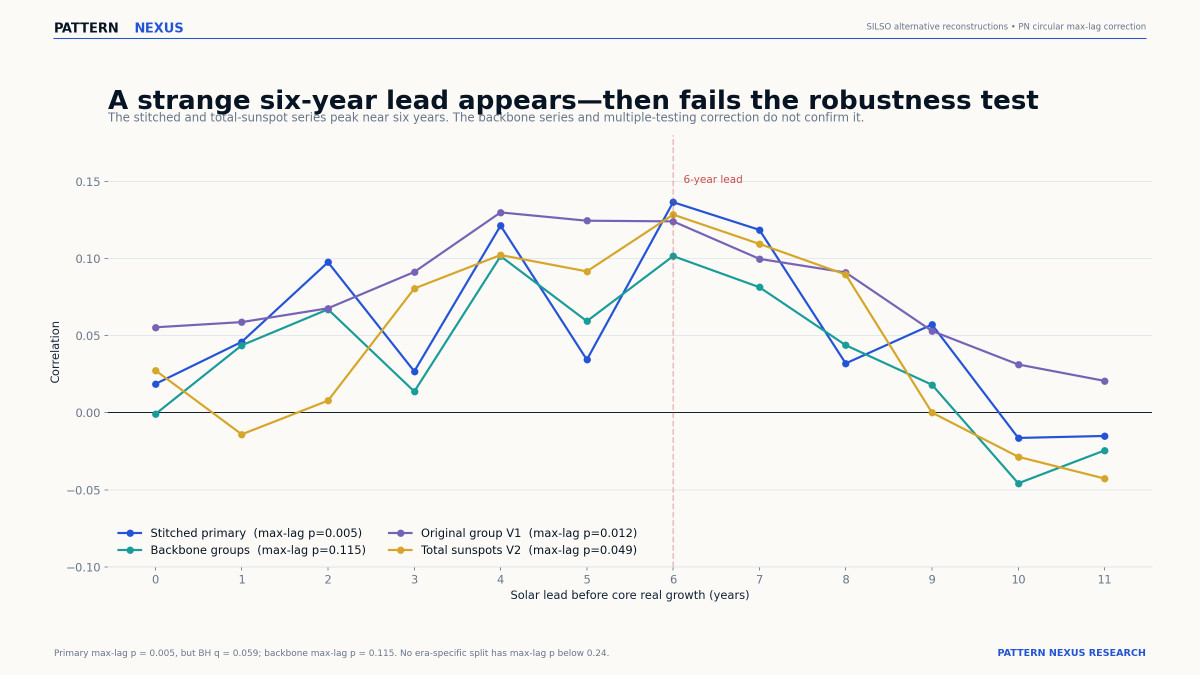
- The full 1650–2025 series produces a strange six-year solar lead. The best correlation is only 0.136, but the max-over-lags circular probability is 0.005. After correction across scans it is 0.059.
- Both findings are fragile. Changing the Amsterdam–London–New York handoff moves the corrected event probability from 0.007 to 0.463. An independent long solar reconstruction weakens the six-year result to 0.115.
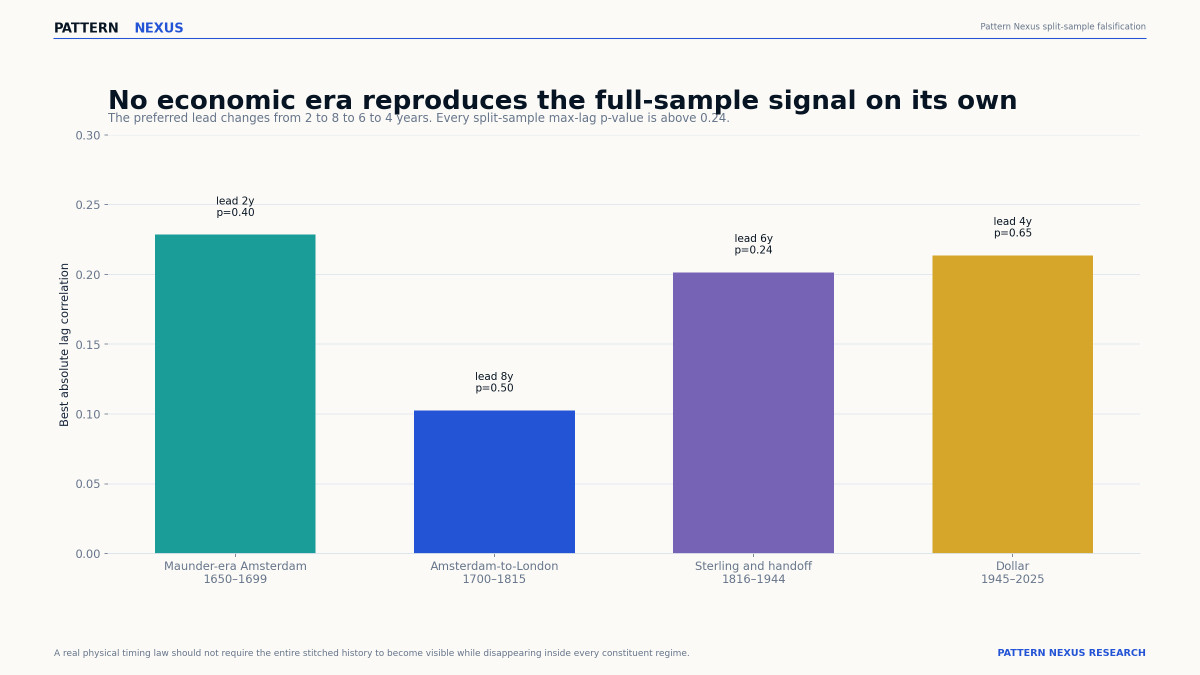
- No constituent historical era reproduces the full-sample lag result. The best lead moves from two years in the Maunder-era Amsterdam sample to eight, six and four years in later regimes.
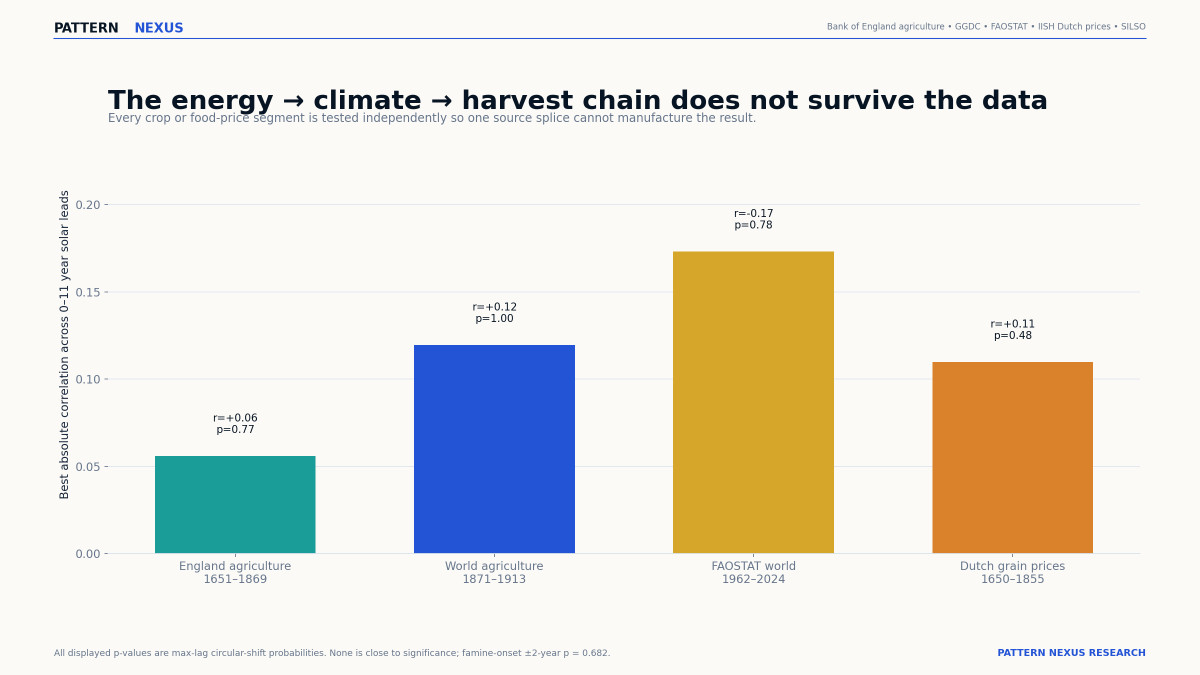
- The crop and famine channel fails. England agriculture, historical world agriculture, FAOSTAT production, Dutch grain prices and famine onsets do not produce a robust solar lag.
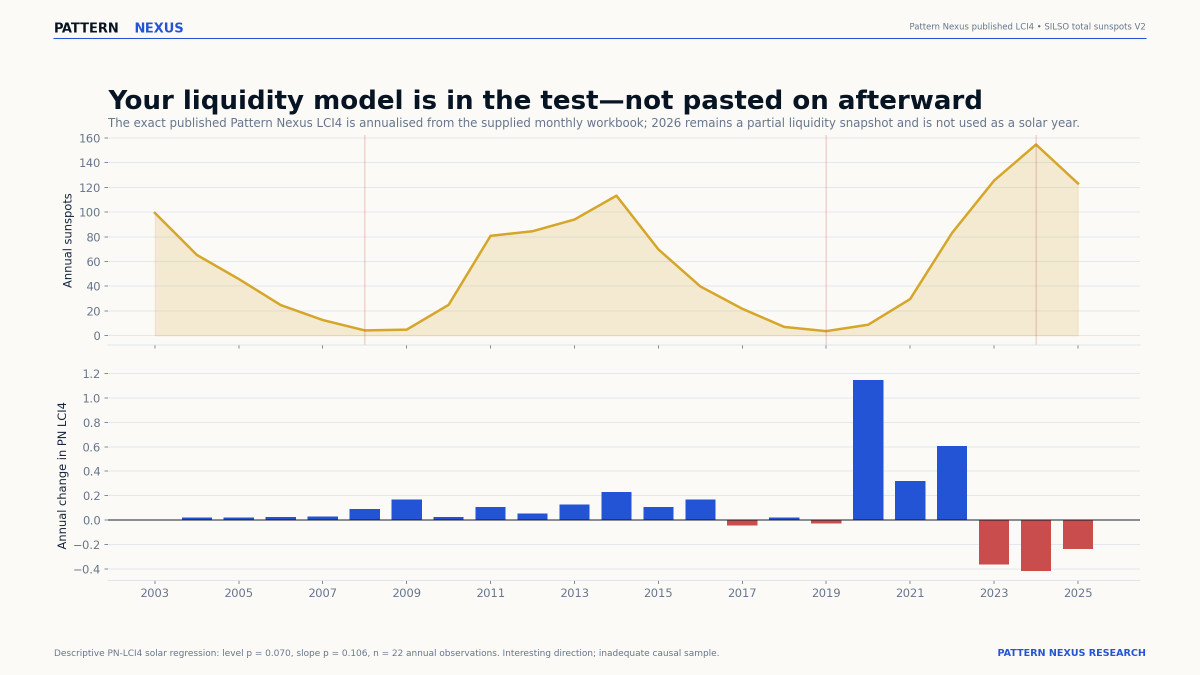
- My LCI4 is in the test. The supplied Pattern Nexus liquidity model produces an interesting descriptive direction, but only 22 annual changes exist. The solar-level p-value is 0.070 before correction and 0.387 after it.
- Cycle 25 reached its official maximum in October 2024. NOAA currently says Cycle 26 should begin sometime from January 2029 through December 2032, but it does not yet issue a Cycle 26 prediction.
- That range overlaps my independent 2028–2030 systems window. The overlap is worth monitoring. It is not proof, and I did not fit that forecast from the Sun.
- Pattern Nexus conclusion: solar turning points may be a timing overlay on a vulnerable liquidity system. The engine remains credit, collateral, leverage, trade, war and policy.
I did not stretch the modern dataset backward and call it history. I reconstructed the financial centre that actually carried global money at the time, disclosed every transition weight, reran the study with early, late and hard handoffs, used multiple solar reconstructions, separated incompatible crop datasets, put my exact LCI4 into the analysis and corrected every attractive timing search for the fact that I went looking for it.
The result is more interesting than the easy answer. There is something narrow in the timing. There is not enough stability to call it a universal law.
The Sun may load the timing. Liquidity still pulls the trigger.
The world of 1650 did not have the Federal Reserve, the dollar index, national-income accounting or a global recession committee. It still had a centre.
Trade bills cleared through Amsterdam. Sovereigns borrowed through Dutch houses. Sterling and London inherited the network as British trade, banking, insurance and military power expanded. New York and the dollar then absorbed the system through market depth, trade credit, war finance and the postwar reserve architecture.
If the thesis is that solar cycles line up with the global flow of money, those are the flows that have to be reconstructed. A modern U.S. regression beginning in 1987 cannot settle the question. Neither can a world-recession chronology beginning in 1870.
A clean regression can still be aimed at the wrong system
My first pass found almost no ordinary short-horizon correlation. That result was not fabricated. It was incomplete.
It asked whether modern monthly changes in sunspots added predictive power to modern economic and liquidity variables. That is a valid trading-signal question. It is not the same as asking whether multi-year solar phases or turning points repeatedly intersect the dominant monetary system.
Then I widened the modern thesis to recession timing, and the alignments became visible. But even that was still too short. Four U.S. recession onsets can be suggestive. They cannot settle a historical-cycle claim.
The real test had to move backward through the dollar system, through sterling, and into the Dutch financial network. It also had to distinguish three claims that are usually thrown into one bucket:
Does more or less solar activity correlate with annual economic growth?
Do contractions begin unusually close to solar minima or maxima?
Does solar activity lead later economic outcomes by a repeatable number of years?
Does the path run through climate and crops, or through liquidity and finance?
Those questions require different tests. Mixing them is how a chart becomes a story before the data earn it.
Amsterdam became London. London became New York. The flow never stopped.
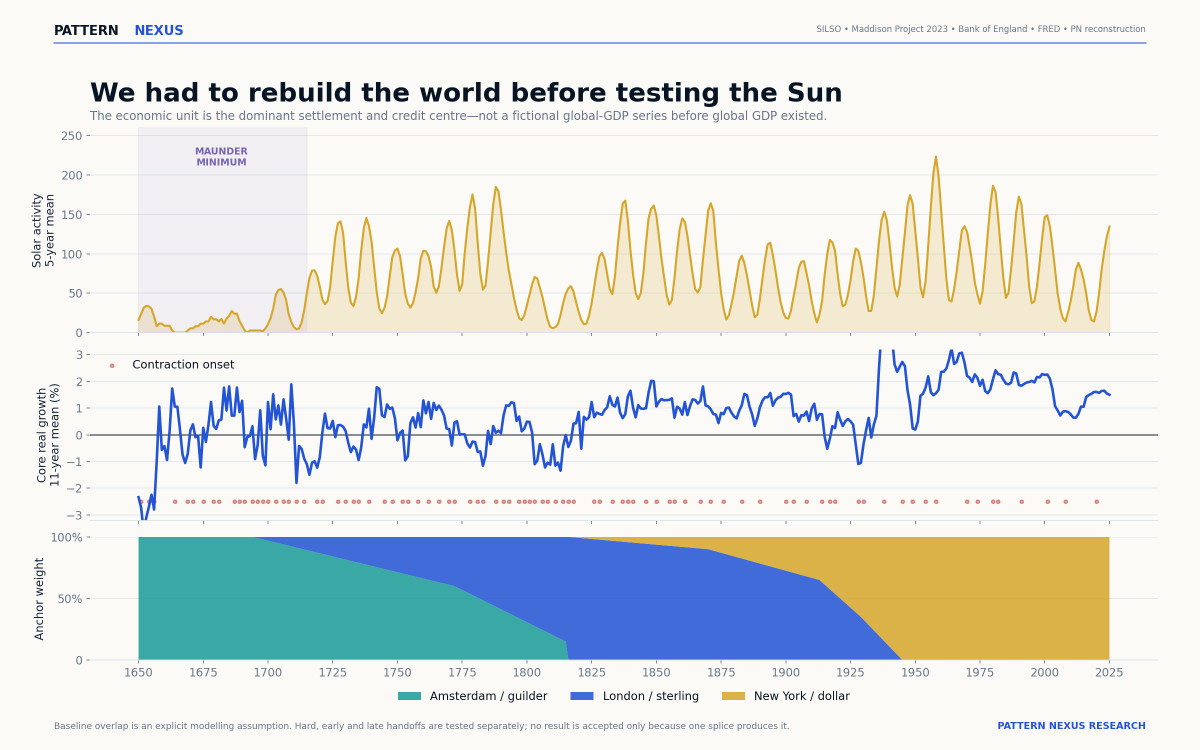
There is no honest annual global GDP series beginning in 1650. So I did not invent one.
I used the economy sitting under the dominant settlement currency and cross-border financial network as the global-core proxy. That begins with the Netherlands, transitions into Great Britain and ends with the United States.
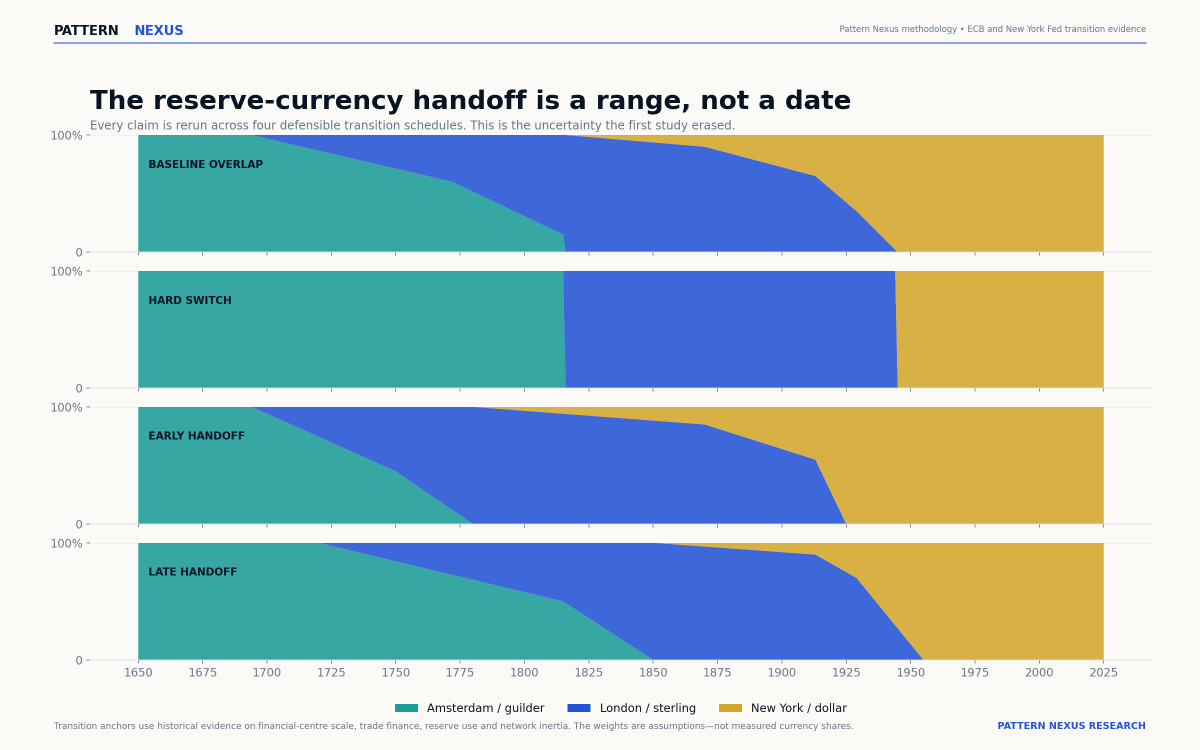
The baseline is deliberately gradual. Financial systems do not wake up one morning and switch reserve currencies because a textbook says a new century began.
| Year | Amsterdam / Netherlands | London / Britain | New York / United States | System meaning |
|---|---|---|---|---|
| 1650 | 100% | 0% | 0% | Dutch commercial-financial core |
| 1772 | 60% | 40% | 0% | Amsterdam and London share the credit architecture |
| 1815 | 15% | 85% | 0% | Sterling predominance |
| 1870 | 0% | 90% | 10% | New York enters the core-flow proxy |
| 1913 | 0% | 65% | 35% | London leads while dollar finance deepens |
| 1929 | 0% | 35% | 65% | Dollar leadership in trade credit and reserves |
| 1945 | 0% | 0% | 100% | Postwar dollar system |
Annual real growth comes from Maddison GDP per capita for the three centre economies, extended through 2025 for the United States with BEA data. The growth rates are combined using the active annual weights.
Then I rebuilt the weights three more ways: a hard switch, an early handoff and a late handoff.
The Sun goes back farther than the economy, but the early precision is not equal
The long solar record uses the WDC-SILSO group-number backbone beginning in 1610 and the official annual total sunspot number beginning in 1700.
Before 1700, I map the backbone series onto the later total-sunspot scale. From 1700 forward, I use the official annual total sunspot number. Official cycle minima and maxima begin with numbered Cycle 1 in 1755.
Before 1755, turning points are reconstructed and labelled low confidence. They are useful for long context. They are not treated as if an observatory published an official cycle date in 1650.
I also reran the central lag test on the backbone series by itself, the original group-number v1 reconstruction and the total sunspot number by itself. That matters because one stitched series can create a result at the splice or amplify a shared scaling choice.
“Near a solar turn” covers almost the entire calendar faster than people realize
A solar minimum is followed roughly five or six years later by a maximum. The next minimum follows roughly five or six years after that.
Now draw a two-year window on each side of every minimum and maximum. Most years are covered before a recession is added to the chart.
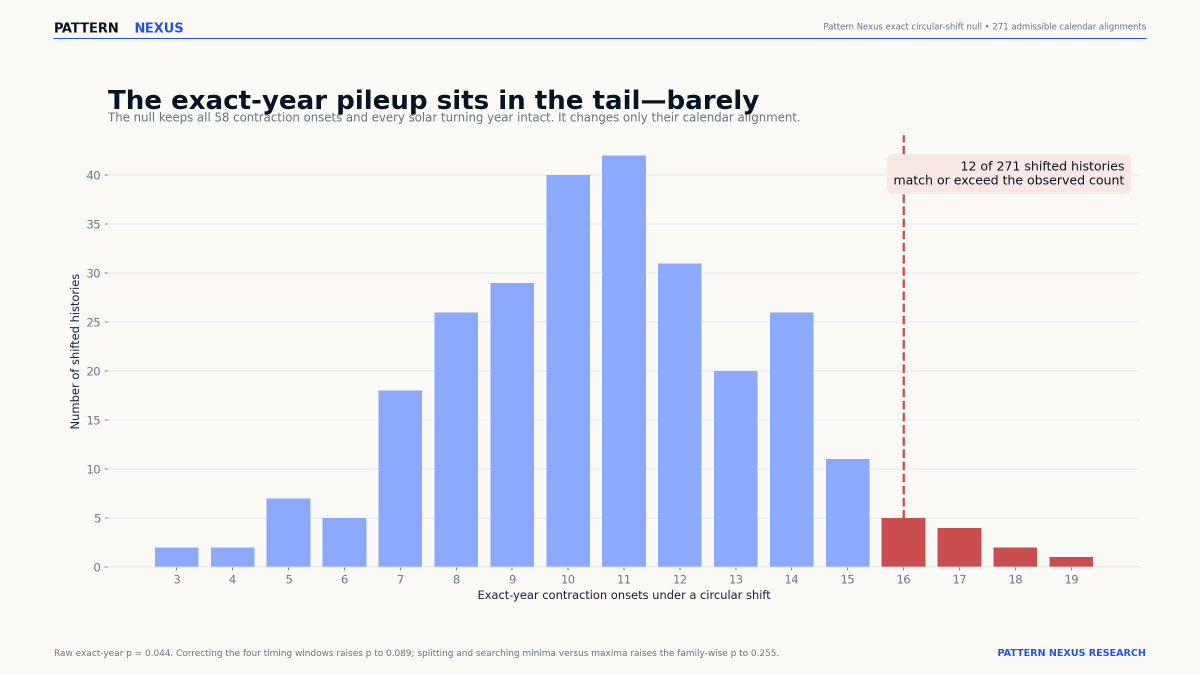
That is why I used exact circular shifts. The entire historical event sequence is moved around the fixed solar calendar. Event spacing, clusters and solar chronology remain intact. The test asks how often another valid calendar alignment looks at least as strong as the real one.
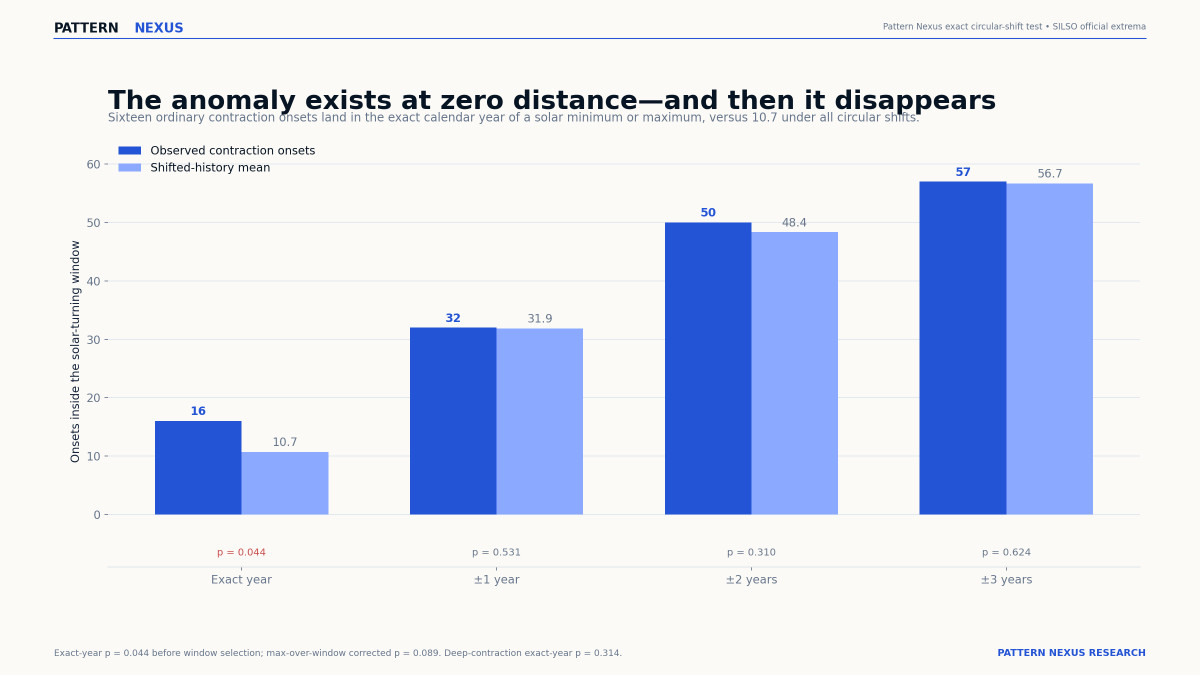
At ±2 years, 50 of 58 ordinary contraction onsets are near a minimum or maximum. That is 86.2%.
The null expects 48.37, or 83.4%.
The observed share is not extraordinary. Its p-value is 0.310.
This is why a chart can be visually right and statistically ordinary at the same time.
Sixteen contractions landed directly on the turning year
The exact-year result is different.
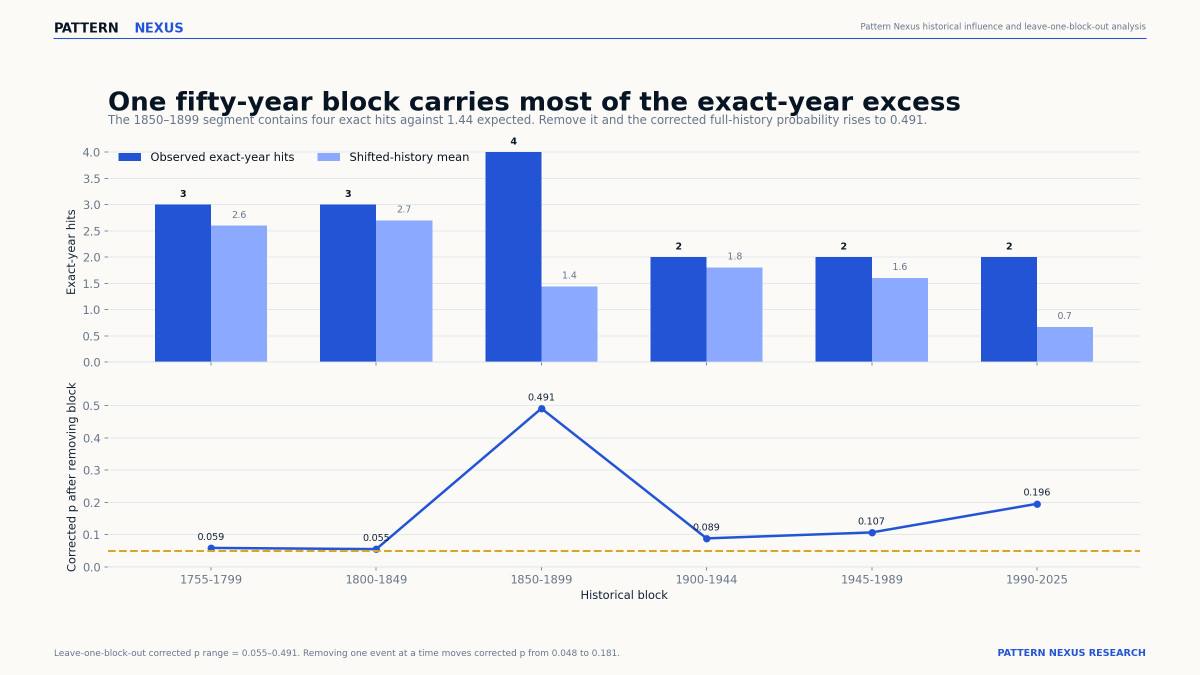
Between 1755 and 2025, the reconstructed core contains 58 ordinary contraction onsets. Sixteen land in the exact calendar year of an official solar minimum or maximum. The shifted calendars expect 10.70.
The years are 1766, 1778, 1788, 1816, 1833, 1837, 1855, 1867, 1883, 1890, 1917, 1928, 1954, 1958, 2001 and 2008.
That is real enough to report.
It is not the final probability.
I inspected the exact year, ±1, ±2 and ±3. The corrected probability asks whether any one of those four windows looks as strong as the observed best window under the null. That moves the result to 0.089.
The exact-year pileup is therefore a narrow anomaly. It does not clear the full 5% corrected threshold.
Deep contractions weaken the case further. Their exact-year p-value is 0.314. Multi-year contractions have an exact-year p-value of 0.734. The World Bank global-recession chronology produces 0.921.
The same Sun produces a different answer when the centre of money moves
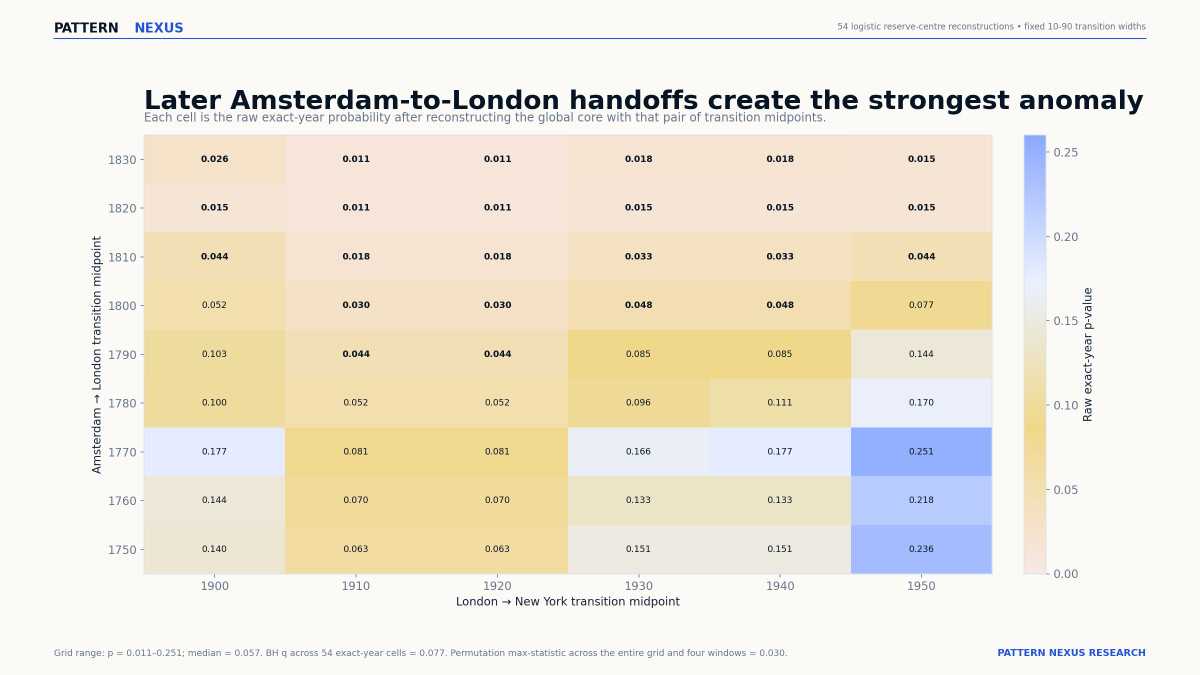
The reserve-centre weights are not cosmetic. They decide whether a Dutch contraction, a British contraction or an American contraction represents the global core during transition years.
| Schedule | Onsets | Exact-year hits | Raw p | Corrected p |
|---|---|---|---|---|
| Baseline overlap | 58 | 16 | 0.034 | 0.075 |
| Hard switch | 55 | 18 | 0.004 | 0.007 |
| Early handoff | 58 | 13 | 0.239 | 0.463 |
| Late handoff | 55 | 16 | 0.022 | 0.034 |
The table uses the common 1755–2022 sensitivity window, which is why the baseline probability differs slightly from the full 1755–2025 result.
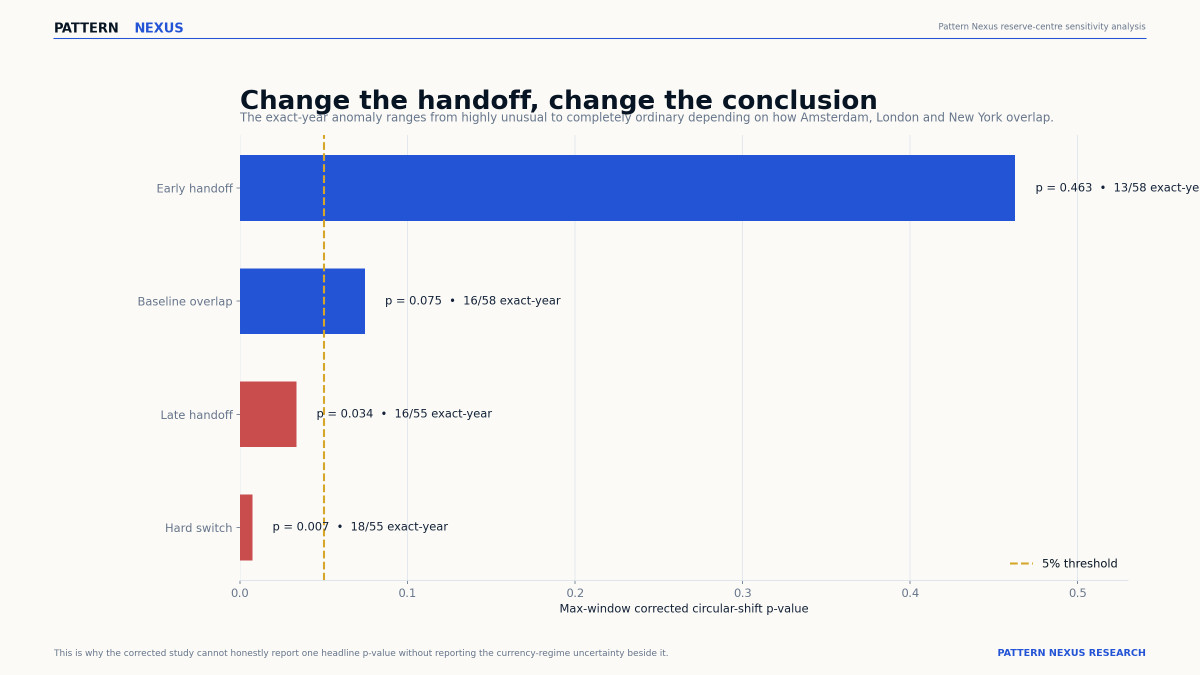
One defensible history says strong anomaly. Another says nothing unusual.
That does not mean the data are useless. It means the solar result is interacting with the reserve transition itself. The financial architecture matters at least as much as the solar calendar.
The full history produces the exact kind of result that demands suspicion
I scanned solar leads from zero through eleven years and repeated the entire search under every circular shift. That is a harder test than taking the best lag and reporting its ordinary regression p-value.
The primary stitched series peaks at a six-year lead:
- Correlation: 0.136.
- Max-over-lags circular p-value: 0.005.
- False-discovery q-value across scans: 0.059.
The correlation is small. The calendar result is strange.
Now change the solar series.
| Solar reconstruction | Best lead | Correlation | Max-lag p | Across-scan q |
|---|---|---|---|---|
| Primary splice | 6 years | 0.136 | 0.005 | 0.059 |
| SILSO backbone | 6 years | 0.102 | 0.115 | 0.308 |
| Original group number v1 | 4 years | 0.130 | 0.012 | 0.064 |
| Total sunspot number v2 | 6 years | 0.128 | 0.049 | 0.180 |
The same broad pattern appears in several versions. The same statistical strength does not.
That makes the six-year lead a research lead, not a forecast rule.
No economic era reproduces the full 375-year result on its own
A physical clock should not require Amsterdam, sterling and the dollar to be stitched together before it becomes visible.
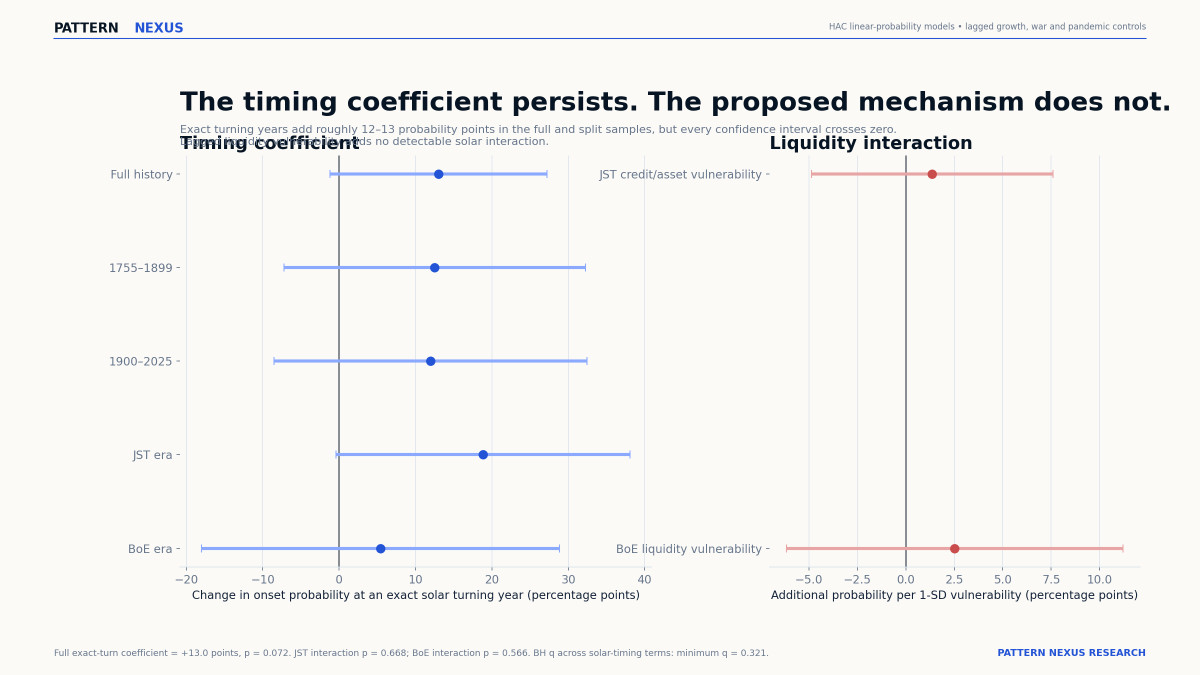
| Era | Best lead | Absolute correlation | Corrected p |
|---|---|---|---|
| Maunder-era Amsterdam, 1650–1699 | 2 years | 0.229 | 0.400 |
| Amsterdam-to-London, 1700–1815 | 8 years | 0.103 | 0.500 |
| Sterling and handoff, 1816–1944 | 6 years | 0.202 | 0.240 |
| Dollar system, 1945–2025 | 4 years | 0.214 | 0.654 |
The full sample may be combining small regime-specific relationships into one attractive long-history result. It may also be capturing a broad periodic structure that is not stable enough to forecast.
Either way, the split sample blocks the claim that six years is a fixed transmission lag.
The energy-to-climate-to-harvest chain does not survive the data
The obvious physical theory is that solar variation changes climate, climate changes crops, crop failures raise prices, and the food shock helps produce contraction.
I tested that chain without forcing incompatible agricultural data into one synthetic level series.
- England agricultural output, 1651–1869: best absolute correlation 0.056; p = 0.767.
- GGDC world agriculture: best absolute correlation 0.120; p = 1.000.
- FAOSTAT world agriculture, 1962–2024: best absolute correlation 0.173; p = 0.778.
- Dutch grain-price inflation, 1650–1855: best absolute correlation 0.110; p = 0.476.
The cycle-frequency test agrees. England agriculture has an 8–14-year coherence probability of 0.803. FAOSTAT’s modern segment produces 0.210.
A century-spanning famine catalogue does not lock to solar turns
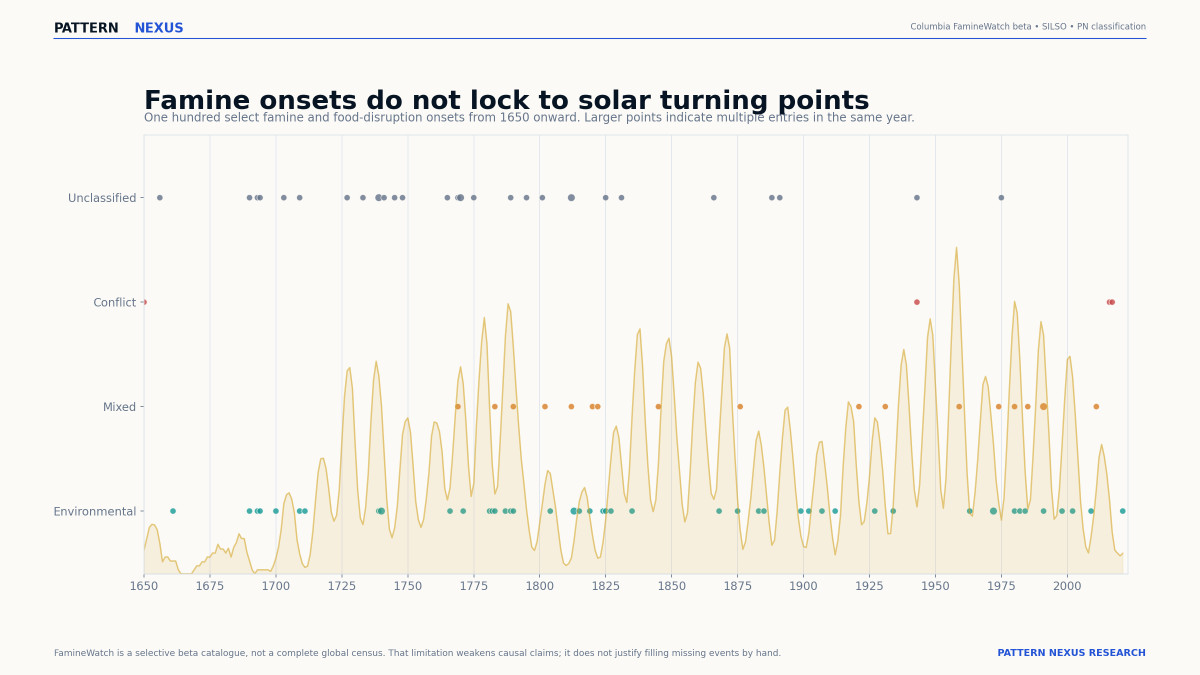
Columbia FamineWatch provides a beta catalogue of historical famines and food disruptions organized around drivers, signals and responses.
The dataset contains 100 selected events beginning in 1650. I classified the documented cause text into environmental, mixed, conflict and unclassified groups. I did not turn missing detail into invented precision.
Among 76 famine onsets after 1755, 62 occur within ±2 years of a minimum or maximum. That is 81.6%.
The null expects 83.1%.
The p-value is 0.682.
Environmental famine onsets also fail. The result is not hiding inside the events most likely to carry a climate mechanism.
The famine evidence does not prove that solar conditions never mattered locally. It does tell us that solar extrema cannot explain the historical famine catalogue as a global annual clock.
The financial channel is the better theory. It is still not proven.
The failure of the crop mechanism does not end the analysis. It changes the mechanism.
A solar overlay does not have to cause recession through harvests. It could synchronize with a leveraged system through risk appetite, timing, institutional behaviour or another unmeasured path. But the system still needs an actual financial vulnerability.
That is where the Pattern Nexus framework belongs:
- central-bank balance sheets and liquidity facilities;
- fiscal cash and sovereign issuance;
- bank credit and collateral;
- term premium and refinancing pressure;
- currency defence and cross-border funding;
- war, energy and trade shocks;
- policy delay followed by policy permission.
I tested historical Dutch financial variables, the Bank of England millennium data, the Jordà–Schularick–Taylor credit-and-asset system and the exact Pattern Nexus LCI4 supplied for this project.
The pre-1870 Bank of England liquidity model produces a nominal solar-level p-value of 0.035. After false-discovery correction, it is 0.376.
The modern JST credit-and-asset impulse produces p = 0.370 for solar level and p = 0.177 for solar slope. Its 8–14-year coherence probability is 0.134.
LCI4 annual change produces:
- solar-level coefficient: −0.139; p = 0.070;
- solar-slope coefficient: 0.151; p = 0.106;
- 22 annual observations;
- corrected q-value: 0.387 for both solar terms.
The direction is interesting. The sample is inadequate.
That is the only version of the thesis the historical evidence still supports.
The independent forecasts overlap. I am not pretending that makes them the same forecast.
Solar Cycle 25 reached its official maximum in October 2024. NOAA says Solar Cycle 26 should begin sometime between January 2029 and December 2032. NOAA also says it does not yet produce a Cycle 26 prediction.
My 2028–2030 risk window came from the financial system: debt maturity, liquidity, long-end rates, fiscal constraint, capital spending, demographics, collateral, policy and the sequence of stress I have been publishing.
I did not generate that window by fitting a solar minimum.
The overlap matters because two independent frameworks are pointing toward the same broad part of the calendar. Independence makes the convergence more interesting. It does not make either framework proof of the other.
LCI4 deterioration, weakening credit, refinancing stress, collateral losses, unemployment and policy delay entering the solar transition together.
Liquidity improves, credit expands, collateral stabilizes and the system crosses the solar transition without contraction.
Moving a date after the fact until any downturn lands near a minimum or maximum.
As a monitoring overlay inside the Pattern Nexus system—not as a standalone trade or recession call.
The data found a pattern. It did not find a clock.
I went into this expecting one of two answers.
Either the long history would kill the solar thesis completely, or it would reveal a repeating clock.
It did neither.
It found an exact-year contraction pileup that is unusual before correction. It found a six-year lead that is unusual in the preferred full splice. Then it showed me exactly where both patterns break.
The reserve-centre handoff can create or erase the event result. The solar reconstruction changes the lag result. The individual eras refuse to reproduce it. Crops and famine do not transmit it. The liquidity models point in interesting directions without producing a durable corrected signal.
That is not failure. That is the boundary of the evidence.
The Sun may help describe when a stressed system becomes vulnerable. It does not tell us why the system is stressed. The why remains liquidity, leverage, collateral, trade, war, policy and the reserve architecture itself.
So I will keep the solar cycle on the Pattern Nexus dashboard.
I will not let it replace the dashboard.
The questions this study can actually answer
Does this prove that the Sun has no economic effect?
No. It shows that the tested global annual channels do not establish a robust standalone solar recession mechanism.
What is the strongest event result?
Sixteen of 58 ordinary contraction onsets land in the exact year of an official solar minimum or maximum versus 10.70 expected. Raw p = 0.044; corrected p = 0.089.
What is the strongest lag result?
A six-year solar lead in the primary 1650–2025 splice, with r = 0.136, max-lag p = 0.005 and across-scan q = 0.059.
Why not call that proof?
Because the handoff schedule materially changes the event result, an independent solar reconstruction weakens the lag result, and no historical era reproduces the full-sample signal.
Were 2001 and 2008 real matches?
Yes. 2001 aligns with an official solar maximum year and 2008 with a minimum year in this annual event definition. The question is whether the full chronology makes those matches statistically unusual.
Are we at solar minimum now?
No. Cycle 25 reached maximum in October 2024. We are on the declining leg.
Does the next solar transition validate the 2028–2030 Pattern Nexus forecast?
No. NOAA’s broad 2029–2032 Cycle 26 start range is context. The PN forecast remains an independent liquidity-and-systems thesis.
Can the work be audited?
Yes. The complete code, standardized panels, weight assumptions, source hashes, event tests, regressions, lag scans, spectral tests, workbook and charts are included in the research package.[15]
Primary datasets, exact assumptions and reproducible outputs
- [1] WDC-SILSO, Royal Observatory of Belgium, Group Number reconstruction, 1610–2015.
- [2] WDC-SILSO, annual total sunspot number v2, 1700–2025.
- [3] WDC-SILSO, official solar-cycle minima and maxima.
- [4] WDC-SILSO, Solar Cycle 25 reached its maximum in October 2024.
- [5] NOAA Space Weather Prediction Center, Solar Cycle Progression.
- [6] Groningen Growth and Development Centre, Maddison Project Database 2023.
- [7] Federal Reserve Bank of New York, Dutch Treat: The Netherlands’ Exorbitant Privilege in the Eighteenth Century.
- [8] European Central Bank, How is a leading international currency replaced by another?
- [9] Bank of England, Research datasets, including A millennium of macroeconomic data.
- [10] MacroFinance & MacroHistory Lab, Jordà–Schularick–Taylor Macrohistory Database.
- [11] Food and Agriculture Organization, FAOSTAT.
- [12] Columbia FamineWatch, Historical Famines beta catalogue.
- [13] NOAA/NCEI, PAGES2k Global Common Era Temperature Reconstructions.
- [14] Federal Reserve Bank of St. Louis, Real GDP per capita.
- [15] Pattern Nexus, Global Core Solar Audit workbook, code and standardized data.
Method rules
- Official solar extrema are primary after 1755. Earlier algorithmic extrema are explicitly low confidence.
- Reserve-centre weights are disclosed assumptions and rerun under four schedules.
- Timing probabilities use all circular calendar shifts and preserve event spacing.
- Lag probabilities repeat the entire zero-to-eleven-year search inside every circular null.
- HAC regressions use four-year standard-error lags.
- Benjamini–Hochberg false-discovery correction is reported across related test families.
- Agricultural source segments are not level-spliced.
- FamineWatch is treated as a selective beta catalogue.
- The PN LCI4 is analyzed as supplied and annualized only for comparison with the historical annual panel.
This is historical systems research, not investment advice. The reserve-centre reconstruction, early economic estimates, famine classifications and pre-1755 solar turning points contain material uncertainty. The analysis identifies associations and falsification boundaries. It does not establish solar causation.
What's Your Reaction?
 Like
0
Like
0
 Dislike
0
Dislike
0
 Love
0
Love
0
 Funny
0
Funny
0
 Wow
0
Wow
0
 Sad
0
Sad
0
 Angry
0
Angry
0

Founder of Pattern Nexus. I research markets, macro, geopolitics, AI, history, ancient systems, and the patterns most people overlook. I’m also building Market Radar, a trading scanner designed to read pressure, risk, confirmation, and setup quality before chasing a move. Pattern Nexus is where I connect the dots between data, history, technology, and the bigger system playing out around us.





Comments (0)