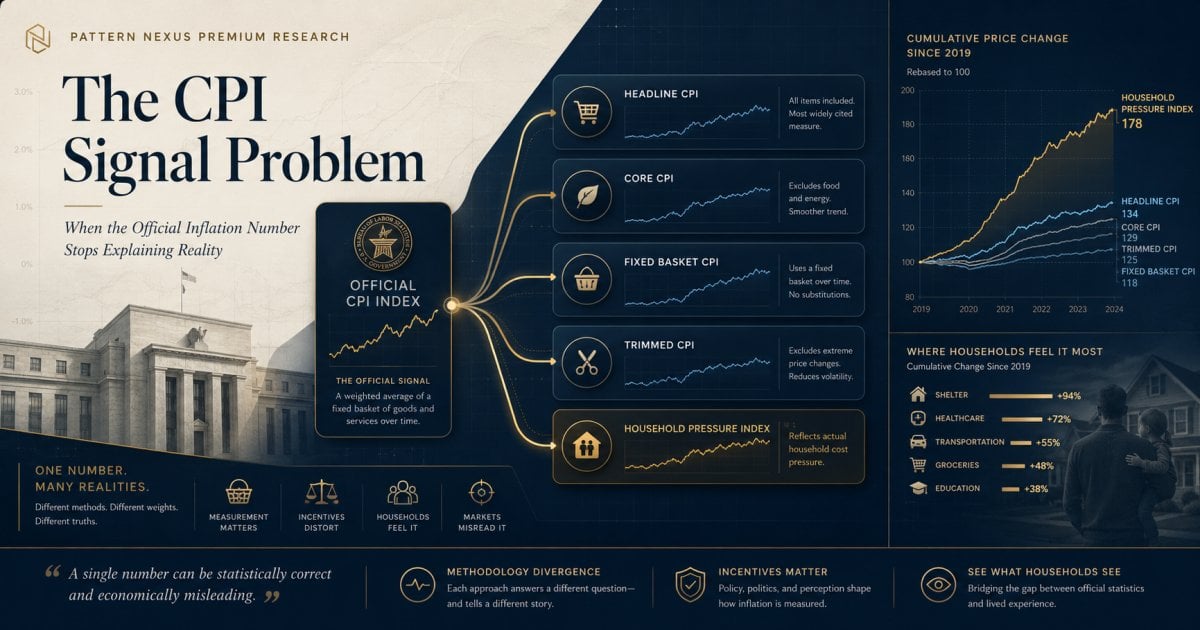
The CPI Signal Problem: When the Official Inflation Number Stops Explaining Reality
A Pattern Nexus data analysis audit using official BLS CPI data from 1960 through April 2026 to compare headline inflation against fixed-basket, current-method, and trimmed-basket frameworks.
The clean version is this: the official CPI number is not random, and the BLS is not just making numbers up. But the official CPI is also not a pure household pain gauge. It is a statistical price index built through a changing measurement architecture. Once the instrument changes, the signal changes.
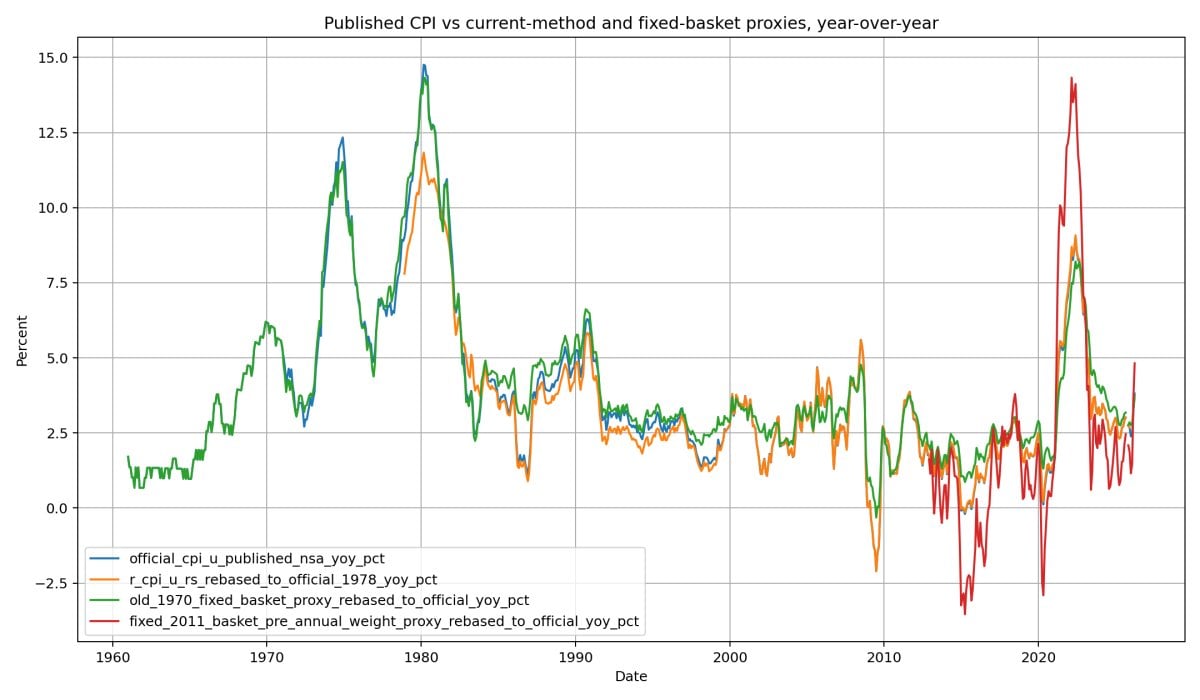
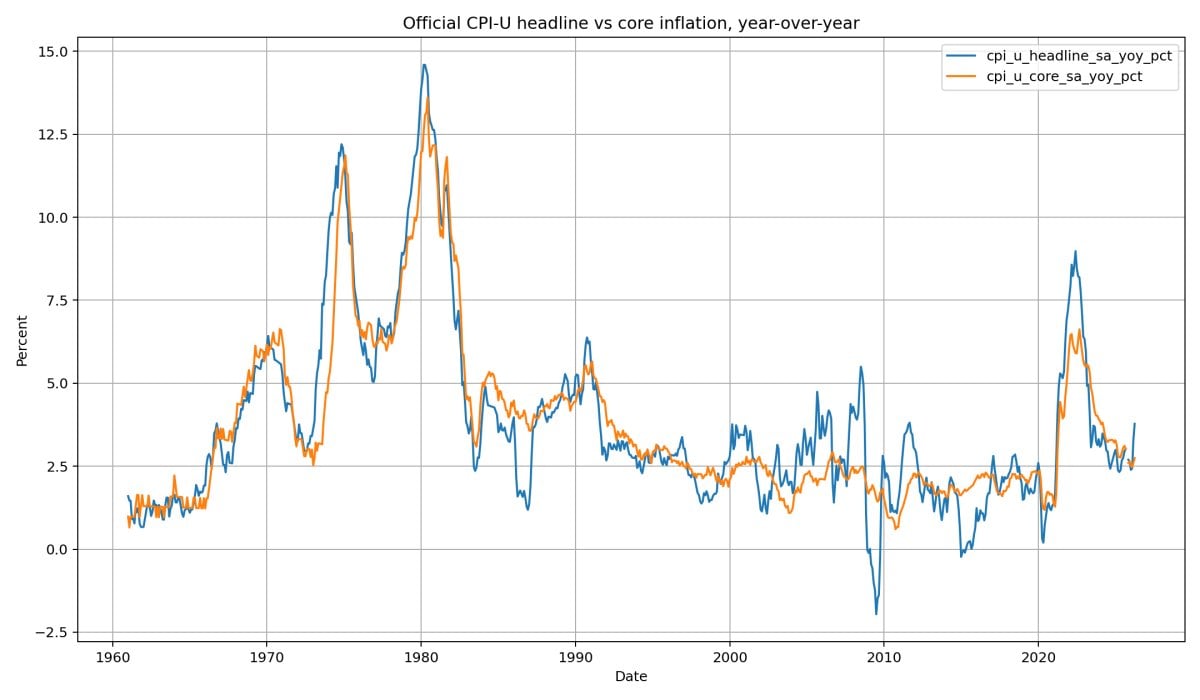
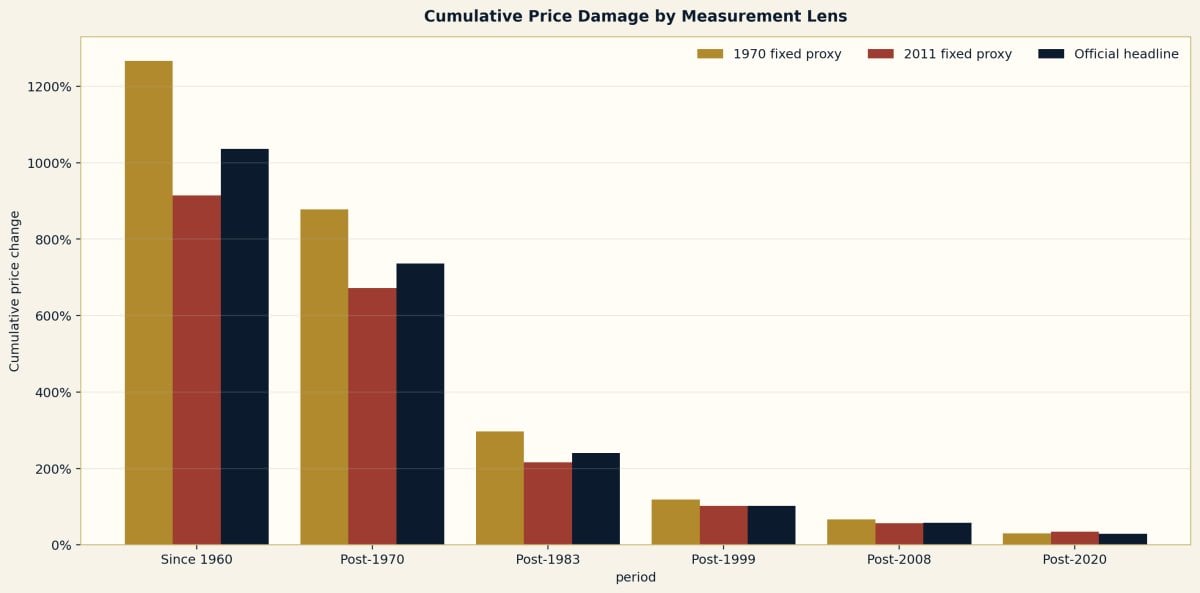
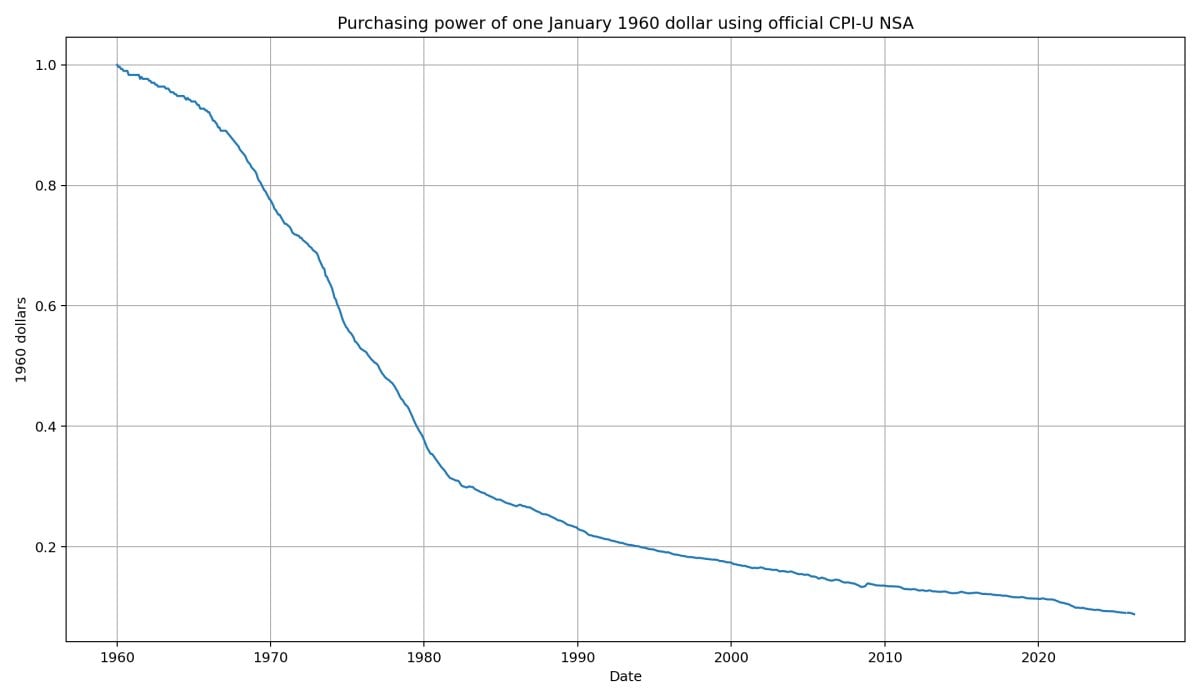
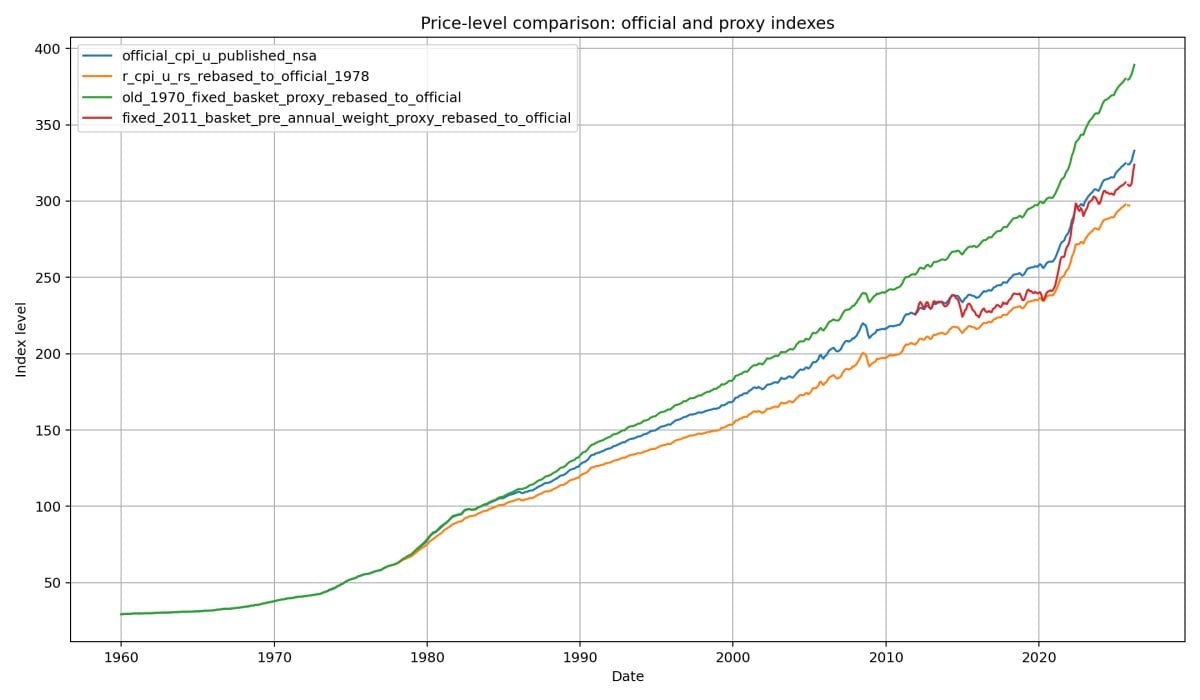
The data package shows that the headline CPI often reports a softer inflation path than fixed-basket proxies built from the same official BLS component data. From January 1960 through April 2026, official CPI-U increased about 1036.6%. The 1970 fixed-basket proxy increased about 1266.1%. Since January 2020, official CPI-U rose about 29.1%, while the fixed 2011 basket rose about 34.9%.
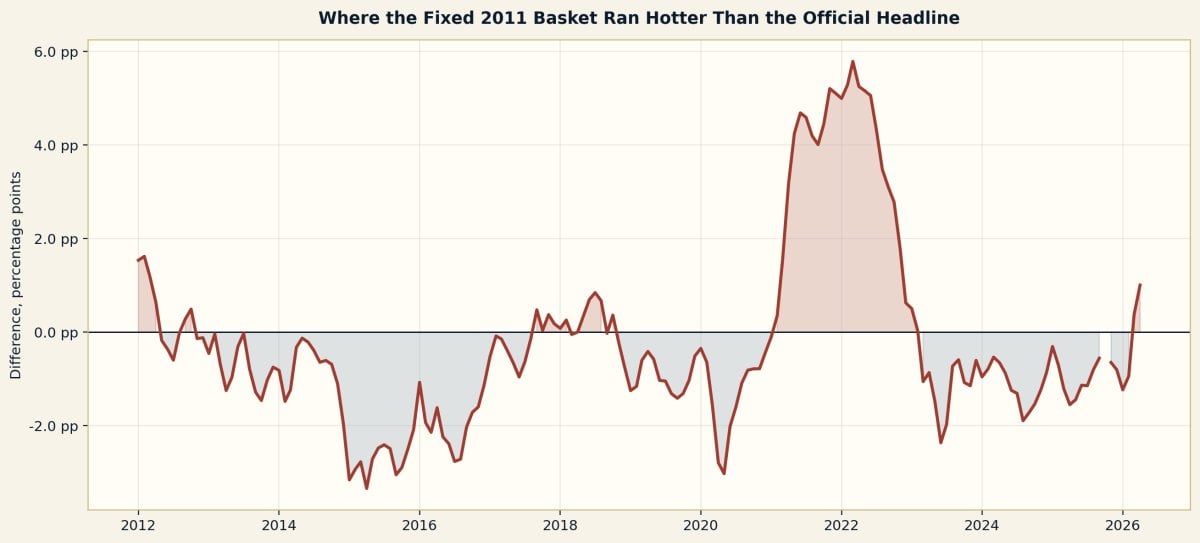
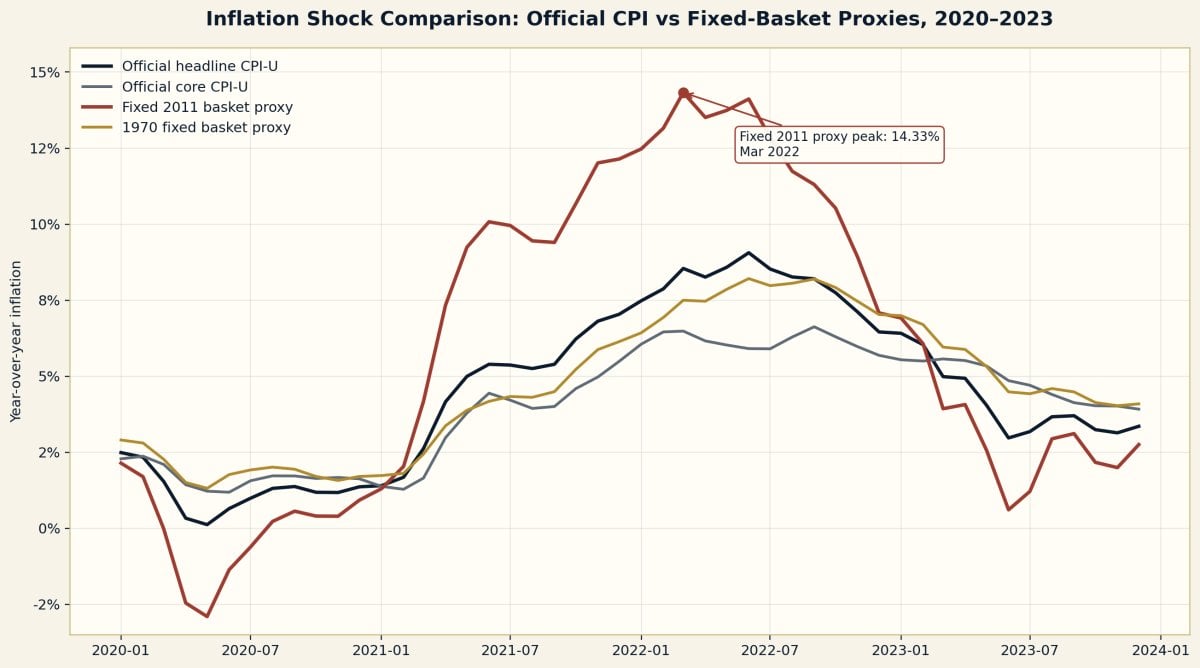
The biggest proof point is the 2021–2022 inflation shock. Official CPI-U peaked at 9.06% YoY in June 2022. The fixed 2011 basket proxy peaked at 14.33% YoY in March 2022. That is not a rounding error. That is a different inflation story.
This is not a rant about inflation. It is a stakeholder-grade data audit. The article separates official published series from official research series and from transparent reconstruction proxies. That distinction matters. If the argument cannot survive a methodology section, it is not strong enough.
The analysis uses official BLS CPI-U series, selected detailed CPI components, R-CPI-U-RS, and BLS relative-importance/cost-weight files. The old-basket and fixed-basket views are not labeled as official CPI. They are labeled as reconstruction proxies designed to answer a simple stakeholder question: what happens when we hold the basket more fixed and stop letting the measuring instrument constantly adapt?
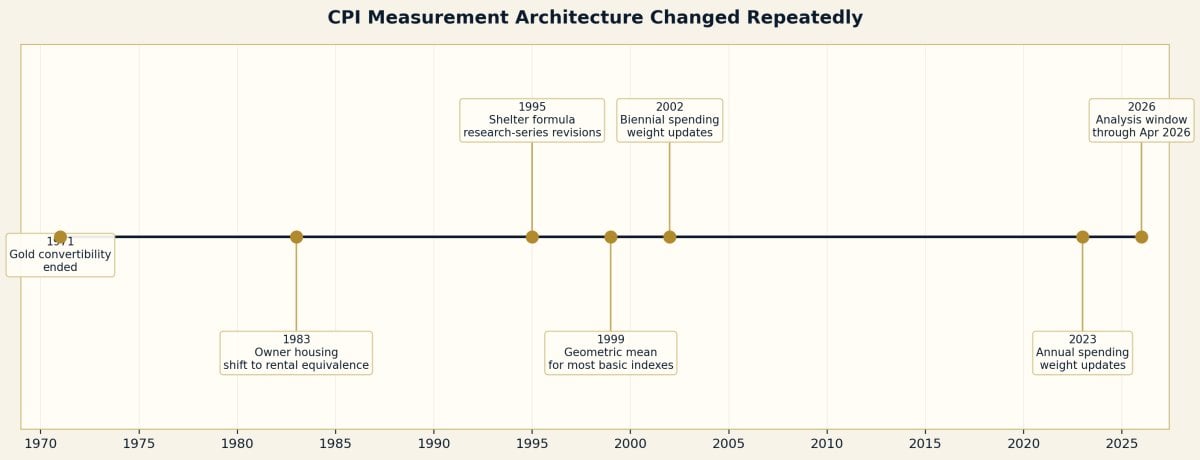
The official government inflation number has become less useful as a standalone measure of lived inflation because it is the output of a changing measurement system. Housing is measured through shelter services and owners’ equivalent rent rather than direct home-purchase pressure. Substitution logic reduces the effect of items consumers move away from. Spending weights are updated more frequently. Core and trimmed inflation measures can remove or mute the categories that are spiking. The result is a cleaner policy signal, but not necessarily a clean household cost-of-living signal.
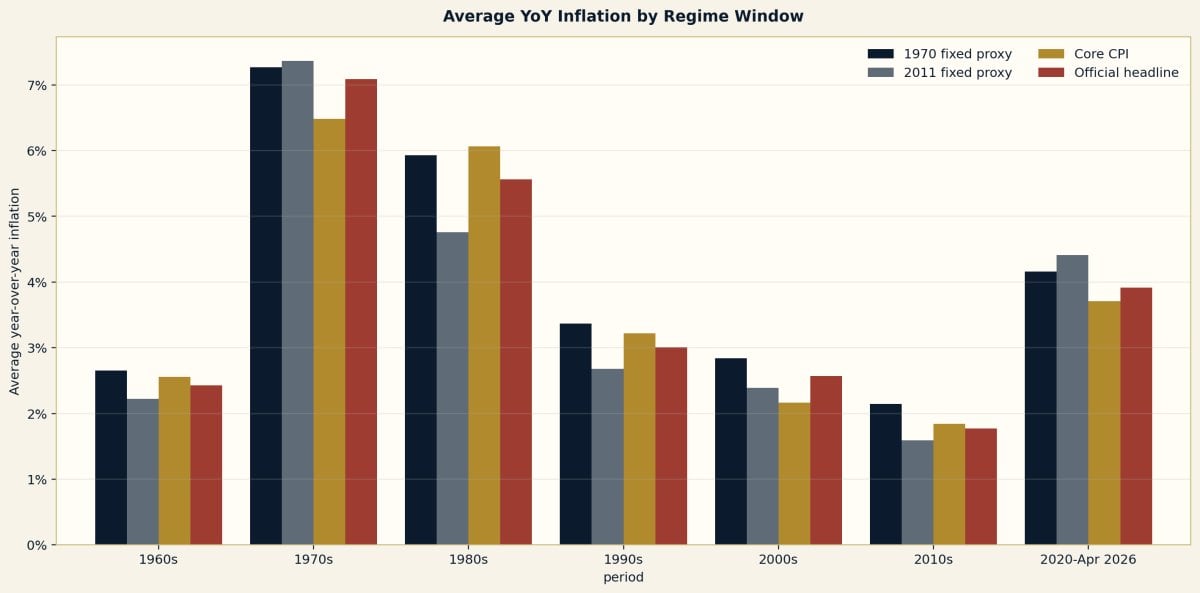
The core finding: when we rebuild fixed-basket and household-pressure proxies from official BLS data, the inflation signal repeatedly comes out hotter than the headline. The debate is not only about the price data. It is about the architecture that converts price data into the public number.
Pick the version that matches how deep you want to go.
Pattern Nexus is written in layers because not every reader wants the same level of detail. The thesis does not change between versions. What changes is the level of technical depth. Choose the reader-friendly version for the cleanest explanation, the non-technical advanced version for the deeper stakeholder read, or the technical advanced version for the full data-heavy research brief.
Level 1 — Reader-Friendly: The Number Is Official. That Does Not Mean It Explains Reality.
The official inflation number is still useful for contracts, government programs, historical comparison, and policy dashboards. But if someone is trying to understand what happened to rent, groceries, insurance, vehicles, energy, services, and basic household pressure, one headline number is not enough anymore.
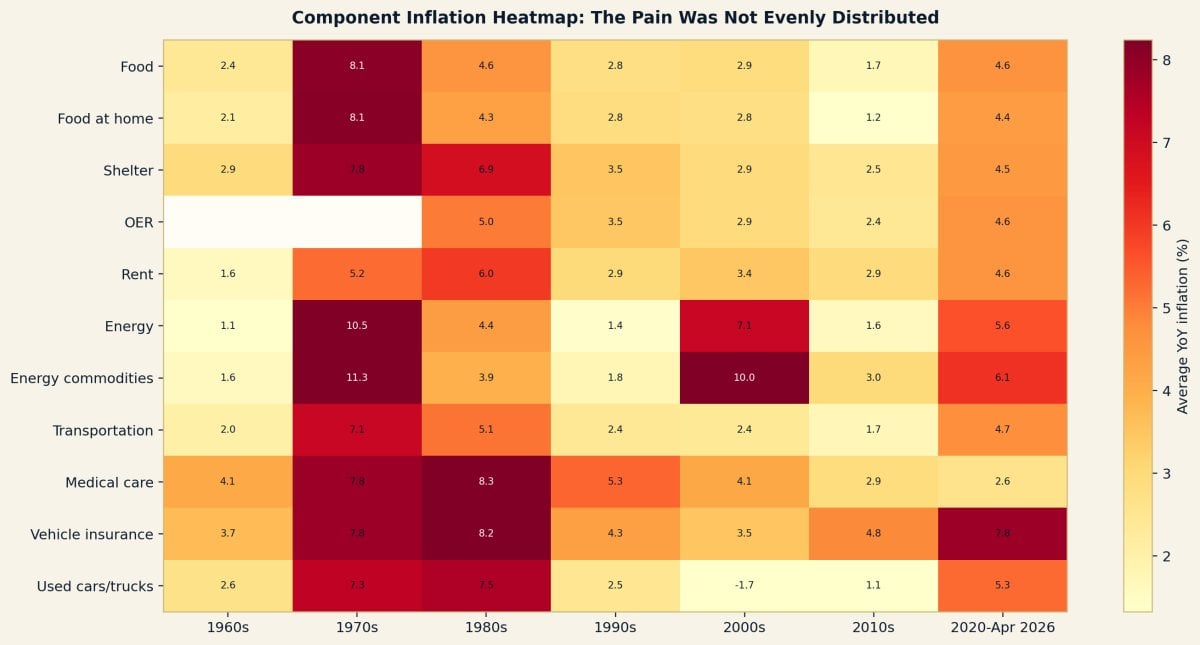
That is the whole point of this audit. The public is told inflation is one number. But inflation is not one number. It is a distribution. Some prices fall, some prices barely move, and some prices rip through the household budget like a saw blade. Then the statistical system weights, smooths, substitutes, imputes, and filters that mess into one clean number.
The biggest visual proof is the 2021–2022 shock. The official headline CPI peaked at 9.06% YoY. That was already ugly. But the fixed 2011 basket proxy built from official BLS component data peaked at 14.33% YoY. That gap is the argument. Same official data universe. Different measurement lens. Much harsher result.
So when people say, “The official inflation number does not match my life,” they are not necessarily wrong. They may be reacting to the difference between a statistical index and a household pressure index.
| Framework | Peak Month | Peak Yoy |
|---|---|---|
| Official headline CPI-U | 2022-06 | 9.06% |
| Official core CPI-U | 2022-09 | 6.62% |
| 1970 fixed-basket proxy | 2022-06 | 8.21% |
| 2011 fixed-basket proxy | 2022-03 | 14.33% |
| Broad-component trimmed proxy | 2022-09 | 7.18% |
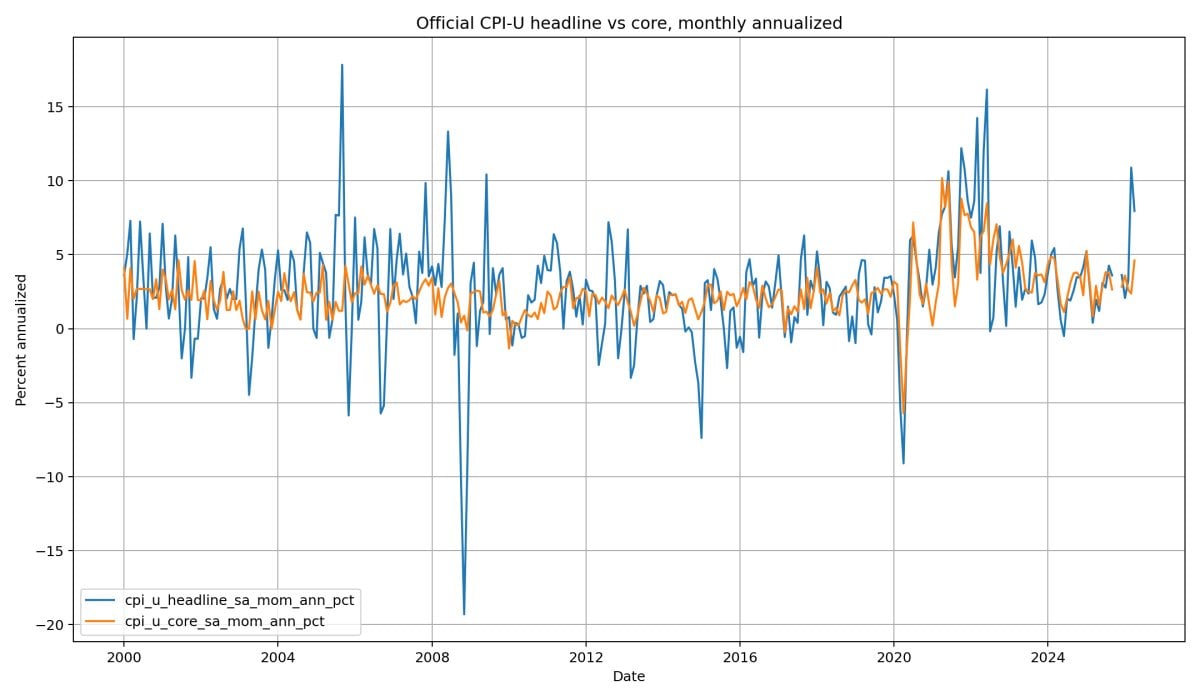
The system also gives public officials and analysts multiple inflation numbers to talk about. Headline CPI includes food and energy. Core CPI removes food and energy. Trimmed measures remove the largest and smallest price changes in a given month. These tools can be useful for trend analysis. But in public communication, they can also change the conversation right when households are getting hit hardest.
If energy, beef, insurance, rent, or transportation spikes, people feel the spike. A trimmed or core number may tell economists the spike is noisy. Fine. But for households, noisy still means paid in dollars.
Level 2 — Non-Technical Advanced: Stakeholder Analysis of the CPI Signal Problem
1. Business Question
The stakeholder question is not “is CPI fake?” That is too crude. The better question is: does official headline CPI still provide a sufficient standalone signal of household purchasing-power loss?
The data answer is no. It provides a useful official index, but not a sufficient pain index. The difference matters for investors, wage negotiations, benefit adjustments, monetary policy interpretation, consumer strategy, public trust, and long-horizon economic research.
2. Dataset Scope
The package covers official BLS monthly CPI data from January 1960 through April 2026. It includes headline CPI-U, core CPI-U, major components, detailed pressure components, R-CPI-U-RS, relative-importance weights, and proxy indexes.
Official long-format CPI rows in the processed BLS U.S. city average dataset.
Monthly CPI history through April 2026 in this build.
Published headline, official core, R-CPI-U-RS, 1970 fixed basket, 2011 fixed basket, broad trimmed proxy.
3. What the Comparisons Show
The fixed-basket proxies repeatedly show higher cumulative inflation than the headline CPI in key windows. That does not mean the proxy is “the true CPI.” It means the official CPI is not the only valid way to summarize the same price universe. It also means that methodology choices materially change the inflation signal.
| Window | Start | End | Official Cpi-U Cumulative | 1970 Fixed-Basket Proxy | 2011 Fixed-Basket Proxy | 1970 Proxy Minus Official | 2011 Proxy Minus Official |
|---|---|---|---|---|---|---|---|
| Since 1960 | 1960-01 | 2026-04 | 1,036.59% | 1,266.10% | 914.23% | 229.51% | -122.36% |
| Post-1970 | 1970-12 | 2026-04 | 736.73% | 878.15% | 671.94% | 141.42% | -64.80% |
| Post-1983 | 1983-01 | 2026-04 | 240.51% | 297.32% | 216.00% | 56.81% | -24.51% |
| Post-1999 | 1999-01 | 2026-04 | 102.69% | 118.91% | 101.87% | 16.22% | -0.82% |
| Post-2008 | 2008-01 | 2026-04 | 57.77% | 67.32% | 57.07% | 9.55% | -0.70% |
| Post-2020 | 2020-01 | 2026-04 | 29.09% | 30.41% | 34.92% | 1.32% | 5.83% |
The 1970 fixed-basket proxy runs above official CPI in roughly 75.6% of months since 1971, with an average YoY gap of 0.29 percentage points. Since 2012, the 2011 fixed-basket proxy does not always run hotter; in fact, its average gap is negative. But that is exactly why the 2021–2022 shock is important: under stress, the fixed-basket lens exposed a much hotter inflation event.
| Test | Average Gap | Median Gap | Months Proxy Above Official | Max Gap | Max Gap Month |
|---|---|---|---|---|---|
| 1970 fixed proxy vs official, since 1971 | 0.29 pp | 0.29 pp | 75.60% | 1.88 pp | 1986-10 |
| 2011 fixed proxy vs official, since 2012 | -0.26 pp | -0.65 pp | 26.16% | 5.79 pp | 2022-03 |
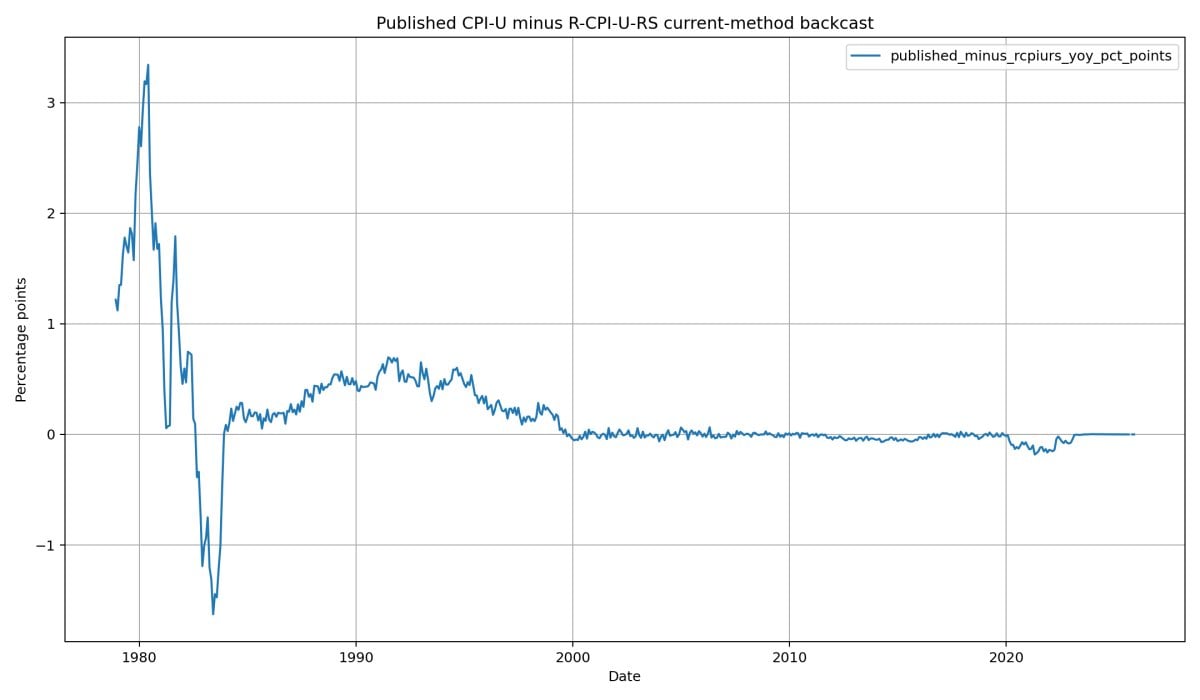
| Published CPI vs R-CPI-U-RS, 1978-2025 | 0.19 pp | 0.01 pp | — | 3.34 pp | 1980-06 |
4. Housing Is the Structural Center of the Problem
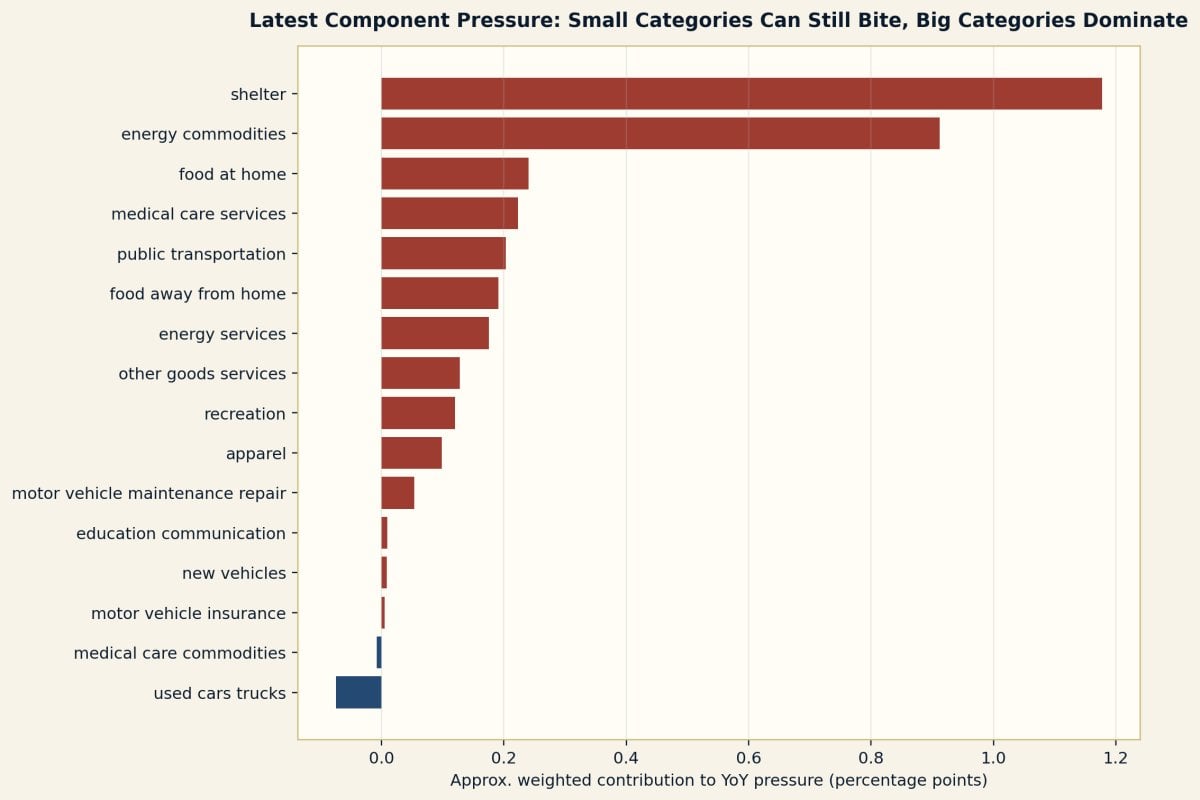
Shelter is one of the largest parts of CPI. In the current BLS shelter factsheet used in this research, shelter carries a relative importance of 35.625% in December 2025. Owners’ equivalent rent alone is over one-quarter of the CPI-U market basket. That means the way owner housing is measured is not a side detail. It is one of the main levers in the headline number.
CPI treats owned housing as shelter service, not as a purchased investment asset. That framework can be defensible inside a national statistical system. But for a household trying to buy a home, qualify for a mortgage, pay property taxes, maintain the property, insure the property, or absorb interest-rate shock, the CPI shelter-service framework is not the same as the lived housing-cost problem.
5. The Filtering Problem
Core CPI removes food and energy every month. Trimmed inflation methods remove whichever components sit in the high and low tails of monthly price changes. Those methods can help estimate underlying inflation trend, but they can also create a public narrative problem. The more inflation concentrates in volatile necessities, the easier it becomes to say the official underlying number is calmer than the household experience.
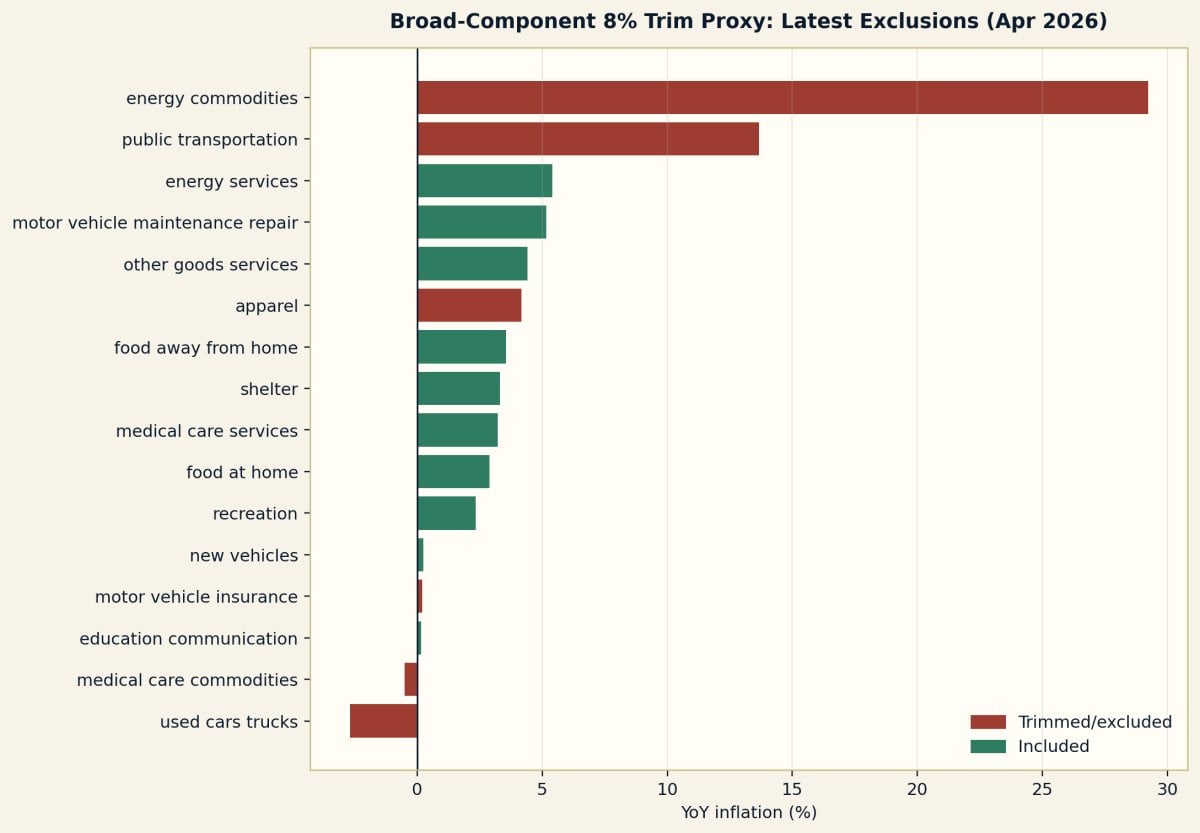
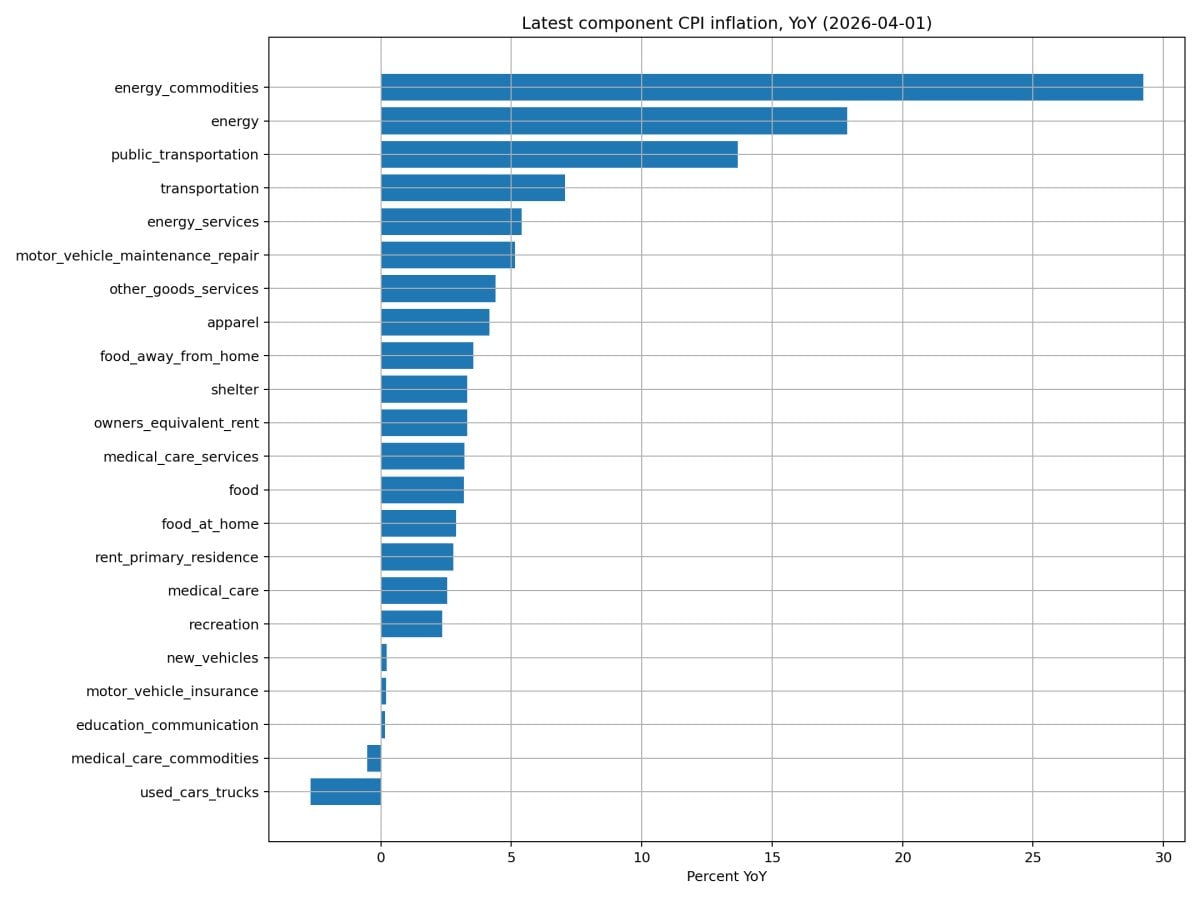
In April 2026, the latest month in the package, headline CPI-U YoY was 3.81%, while official core CPI-U YoY was 2.74%. Energy commodities were up 29.23% YoY. Public transportation was up 13.68% YoY. Shelter was up 3.30% YoY. The headline and core numbers compress all of that into cleaner signals.
| Component | Mom | Mom Annualized | Yoy | Weight If Used |
|---|---|---|---|---|
| energy_commodities | 10.85% | 244.07% | 29.23% | 3.12% |
| energy | 6.33% | 108.76% | 17.87% | — |
| public_transportation | 4.11% | 62.23% | 13.68% | 1.49% |
| transportation | 2.94% | 41.51% | 7.06% | — |
| energy_services | 0.93% | 11.80% | 5.39% | 3.26% |
| motor_vehicle_maintenance_repair | -0.19% | -2.26% | 5.15% | 1.04% |
| other_goods_services | 0.89% | 11.25% | 4.40% | 2.90% |
| apparel | -0.37% | -4.31% | 4.17% | 2.37% |
| food_away_from_home | 0.23% | 2.77% | 3.55% | 5.37% |
| shelter | 0.61% | 7.60% | 3.30% | 35.62% |
| owners_equivalent_rent | 0.47% | 5.78% | 3.30% | — |
| medical_care_services | -0.05% | -0.64% | 3.21% | 6.93% |
| food | 0.49% | 6.05% | 3.18% | — |
| food_at_home | 0.66% | 8.21% | 2.89% | 8.32% |
| rent_primary_residence | 0.49% | 6.03% | 2.79% | — |
| medical_care | -0.11% | -1.26% | 2.54% | — |
| recreation | 0.02% | 0.18% | 2.34% | 5.14% |
| new_vehicles | 0.12% | 1.40% | 0.23% | 3.84% |
| motor_vehicle_insurance | -0.32% | -3.72% | 0.20% | 2.75% |
| education_communication | -0.05% | -0.65% | 0.16% | 5.85% |
| medical_care_commodities | -0.35% | -4.17% | -0.52% | 1.49% |
| used_cars_trucks | 1.01% | 12.84% | -2.69% | 2.76% |
Level 3 — Technical Advanced: Methodology, Proxy Construction, and Reproducibility
1. Official Series
The official CPI-U headline series is taken from BLS CPI-U U.S. city average all-items series. Inflation is calculated as monthly percent change, annualized monthly percent change, 3-month annualized, 6-month annualized, and 12-month year-over-year percent change. Core CPI-U is the official all-items-less-food-and-energy series, not a custom calculation.
2. R-CPI-U-RS
R-CPI-U-RS is an official BLS research series that asks what measured inflation from 1978 forward would look like if many current CPI methods had been in use across the historical period. In this dataset, the shared YoY window from December 1978 through December 2025 shows official published CPI averaging 3.50% YoY versus R-CPI-U-RS averaging 3.31% YoY. The average published-minus-research gap is 0.19 percentage points.
3. Fixed-Basket Proxies
The fixed-basket proxies are Laspeyres-like aggregates of component price relatives. They are not official CPI series. They are transparent reconstruction tools.
For component i with fixed basket weight w_i and price relative R_i,t = P_i,t / P_i,base:

ProxyIndex_t = 100 × Σ(w_i × R_i,t) / Σ(w_i)

YoY_t = (ProxyIndex_t / ProxyIndex_{t-12} − 1) × 100

The 1970 proxy uses BLS historical relative-importance weights anchored around December 1970.
The 2011 proxy uses BLS historical cost-weight logic anchored around December 2011.
The purpose is not to recreate every BLS elementary formula. The purpose is to stress-test the headline against a fixed-basket lens.
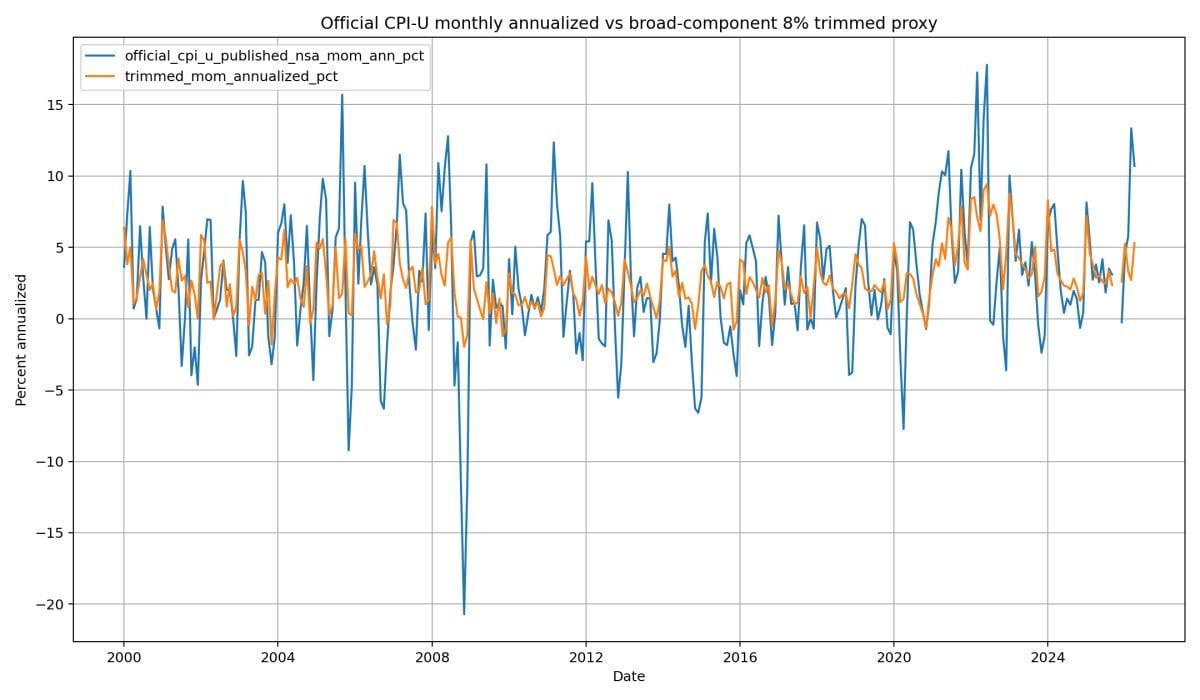
4. Broad-Component 8% Trimmed Proxy
The trimmed proxy ranks available component monthly inflation rates, removes broad components in the lower and upper tails around 8% of expenditure weight, and compounds the remaining weighted monthly change into an index. This is not the official Cleveland Fed trimmed-mean CPI. The official methodology uses a finer distribution and partial trimming. This proxy exists to demonstrate the logic: tail-filtering can remove the exact components that are spiking.
5. Data Quality Notes
- October 2025 is preserved as missing in the BLS CPI data package where the official release was unavailable/footnoted. The article does not interpolate it.
- Series start dates differ. Component-level comparisons only use periods where the component exists.
- Official headline CPI and component proxies are not perfectly interchangeable because BLS uses detailed item-area aggregation, quality adjustment, seasonal adjustment, imputation, and formula methods unavailable from broad public aggregate files alone.
- The proxy indexes are valid as scenario-analysis instruments, not as replacement official series.
6. Analyst Interpretation
The strongest claim supported by this work is not “the government randomly invents inflation.” The strongest claim is: official CPI is a changing statistical instrument, and that instrument often produces a lower or cleaner inflation signal than fixed-basket household-pressure reconstructions built from the same data universe.
That is the professional version. It is also the harder version to dismiss.
Visual Board
These visuals are designed to support the article, stakeholder briefing, and social distribution. Each figure should be treated as a separate evidence block.
Data Tables
Key Cumulative Windows
| Window | Start | End | Official Cpi-U Cumulative | 1970 Fixed-Basket Proxy | 2011 Fixed-Basket Proxy | 1970 Proxy Minus Official | 2011 Proxy Minus Official |
|---|---|---|---|---|---|---|---|
| Since 1960 | 1960-01 | 2026-04 | 1,036.59% | 1,266.10% | 914.23% | 229.51% | -122.36% |
| Post-1970 | 1970-12 | 2026-04 | 736.73% | 878.15% | 671.94% | 141.42% | -64.80% |
| Post-1983 | 1983-01 | 2026-04 | 240.51% | 297.32% | 216.00% | 56.81% | -24.51% |
| Post-1999 | 1999-01 | 2026-04 | 102.69% | 118.91% | 101.87% | 16.22% | -0.82% |
| Post-2008 | 2008-01 | 2026-04 | 57.77% | 67.32% | 57.07% | 9.55% | -0.70% |
| Post-2020 | 2020-01 | 2026-04 | 29.09% | 30.41% | 34.92% | 1.32% | 5.83% |
2020–2023 Inflation Shock Peaks
| Framework | Peak Month | Peak Yoy |
|---|---|---|
| Official headline CPI-U | 2022-06 | 9.06% |
| Official core CPI-U | 2022-09 | 6.62% |
| 1970 fixed-basket proxy | 2022-06 | 8.21% |
| 2011 fixed-basket proxy | 2022-03 | 14.33% |
| Broad-component trimmed proxy | 2022-09 | 7.18% |
Gap Statistics
| Test | Average Gap | Median Gap | Months Proxy Above Official | Max Gap | Max Gap Month |
|---|---|---|---|---|---|
| 1970 fixed proxy vs official, since 1971 | 0.29 pp | 0.29 pp | 75.60% | 1.88 pp | 1986-10 |
| 2011 fixed proxy vs official, since 2012 | -0.26 pp | -0.65 pp | 26.16% | 5.79 pp | 2022-03 |
| Published CPI vs R-CPI-U-RS, 1978-2025 | 0.19 pp | 0.01 pp | — | 3.34 pp | 1980-06 |
Latest Component Snapshot
| Component | Mom | Mom Annualized | Yoy | Weight If Used |
|---|---|---|---|---|
| energy_commodities | 10.85% | 244.07% | 29.23% | 3.12% |
| energy | 6.33% | 108.76% | 17.87% | — |
| public_transportation | 4.11% | 62.23% | 13.68% | 1.49% |
| transportation | 2.94% | 41.51% | 7.06% | — |
| energy_services | 0.93% | 11.80% | 5.39% | 3.26% |
| motor_vehicle_maintenance_repair | -0.19% | -2.26% | 5.15% | 1.04% |
| other_goods_services | 0.89% | 11.25% | 4.40% | 2.90% |
| apparel | -0.37% | -4.31% | 4.17% | 2.37% |
| food_away_from_home | 0.23% | 2.77% | 3.55% | 5.37% |
| shelter | 0.61% | 7.60% | 3.30% | 35.62% |
| owners_equivalent_rent | 0.47% | 5.78% | 3.30% | — |
| medical_care_services | -0.05% | -0.64% | 3.21% | 6.93% |
| food | 0.49% | 6.05% | 3.18% | — |
| food_at_home | 0.66% | 8.21% | 2.89% | 8.32% |
| rent_primary_residence | 0.49% | 6.03% | 2.79% | — |
| medical_care | -0.11% | -1.26% | 2.54% | — |
| recreation | 0.02% | 0.18% | 2.34% | 5.14% |
| new_vehicles | 0.12% | 1.40% | 0.23% | 3.84% |
| motor_vehicle_insurance | -0.32% | -3.72% | 0.20% | 2.75% |
| education_communication | -0.05% | -0.65% | 0.16% | 5.85% |
| medical_care_commodities | -0.35% | -4.17% | -0.52% | 1.49% |
| used_cars_trucks | 1.01% | 12.84% | -2.69% | 2.76% |
Sources and Reproducibility
The data package includes raw BLS files, processed CSVs, figure assets, and the Python pipeline. This article separates official series from reconstruction proxies. That distinction is non-negotiable because the argument depends on professional-grade labeling.
- U.S. Bureau of Labor Statistics, CPI Databases: https://www.bls.gov/cpi/data.htm
- BLS CPI flat-file documentation and time-series directory: https://download.bls.gov/pub/time.series/cu/
- BLS, Chronology of changes in the Consumer Price Index: https://www.bls.gov/cpi/additional-resources/historical-changes.htm
- BLS, R-CPI-U-RS Homepage: https://www.bls.gov/cpi/research-series/r-cpi-u-rs-home.htm
- BLS, R-CPI-U-RS changes over time: https://www.bls.gov/cpi/research-series/r-cpi-u-rs-changes.htm
- BLS, Relative importance and weight information: https://www.bls.gov/cpi/tables/relative-importance/
- BLS, 2023 CPI weight information: https://www.bls.gov/cpi/tables/relative-importance/weight-update-information-2023.htm
- BLS, Rent and owners’ equivalent rent factsheet: https://www.bls.gov/cpi/factsheets/owners-equivalent-rent-and-rent.htm
- Federal Reserve Bank of Cleveland, Median CPI and 16 percent trimmed-mean CPI methodology: https://www.clevelandfed.org/indicators-and-data/median-cpi
Closing Thesis
The CPI did not become meaningless because one switch was flipped. It became less useful as a standalone household inflation gauge because the measurement system evolved into a cleaner policy instrument. The official number still matters. But by itself, it does not explain the lived damage.
They changed the instrument. Once the instrument changes, the signal changes. The data shows it.
What's Your Reaction?
 Like
0
Like
0
 Dislike
0
Dislike
0
 Love
0
Love
0
 Funny
0
Funny
0
 Wow
0
Wow
0
 Sad
0
Sad
0
 Angry
0
Angry
0
Founder of Pattern Nexus. I research markets, macro, geopolitics, AI, history, ancient systems, and the patterns most people overlook. I’m also building Market Radar, a trading scanner designed to read pressure, risk, confirmation, and setup quality before chasing a move. Pattern Nexus is where I connect the dots between data, history, technology, and the bigger system playing out around us.


Comments (0)