Pattern Nexus Market Radar: What the Trading App Does, Why It Exists, and What Comes Next
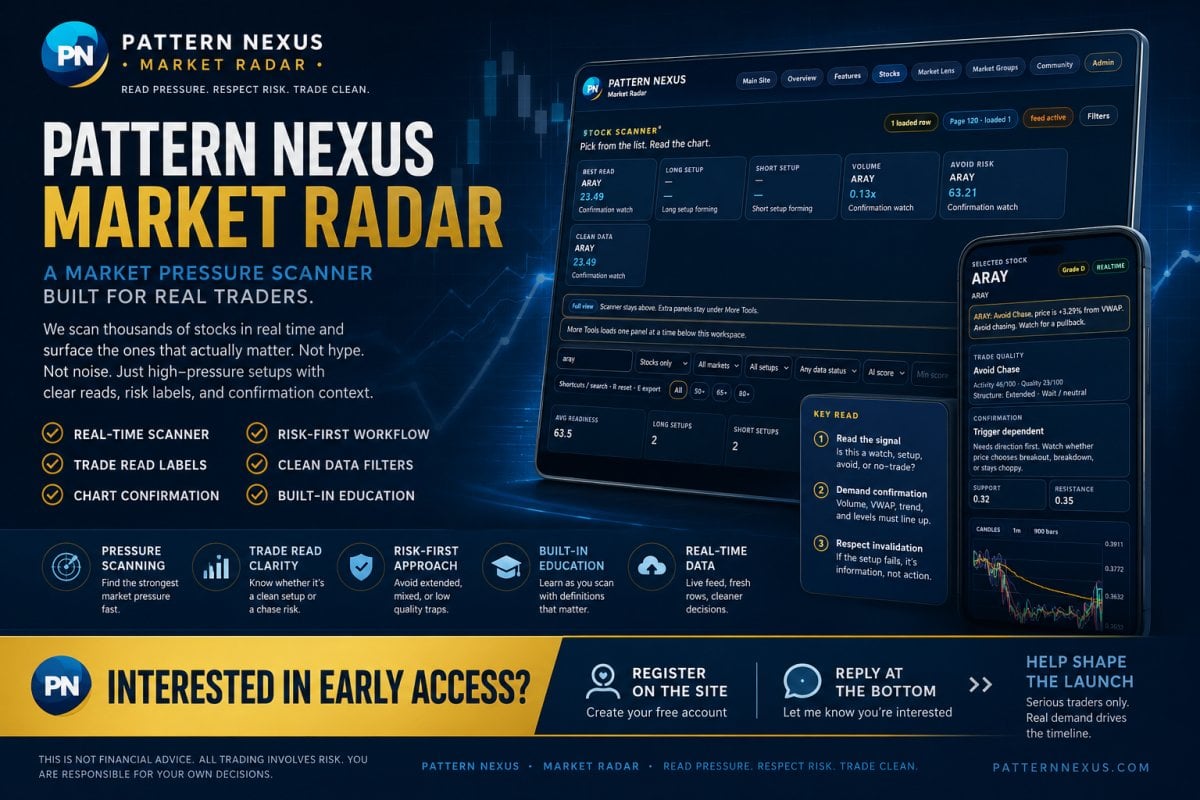
Pattern Nexus Market Radar is being built as a scanner-first trading dashboard that helps users read market pressure before chasing a move. It does not promise magic signals. It organizes live market data, chart context, risk labels, confirmation checks, and watchlist logic into one guided workflow.


Interested in early access?
If you are interested in Pattern Nexus Market Radar, reply to this post at the bottom of the page and register an account on the site. That will help me get a real count of who is actually interested before I activate the expensive data side.
This part matters because the app cannot fully launch as a public paid scanner until the LLC, data broker approval, exchange/data paperwork, and monthly data costs are lined up correctly. I do not want to open access halfway, overpromise, or charge people before the foundation is ready.
The first goal is to see whether there are enough serious early users to support the fixed cost. If enough people register and comment that they want access, the next step is a limited beta group before the wider public launch.
Step 1
Register an account on Pattern Nexus so there is a real user account connected to your interest.
Step 2
Reply at the bottom of this page and say you are interested in Market Radar early access.
Step 3
Once the business and data side are ready, the first group can be contacted for beta access details.
Why I am asking people to register first
A comment shows interest, but a registered site account gives me a cleaner way to organize the beta list, separate real users from random traffic, and avoid guessing whether there is enough demand to justify the data cost. This does not guarantee access, pricing, or launch timing. It simply helps measure serious interest before I move into the next cost-heavy stage.
Register or view subscription plans
If you are interested in Pattern Nexus Market Radar, start by registering on the site. Once the LLC, data broker approval, and market-data setup are ready, subscription plans will be used for the official access path.
Register on Pattern Nexus
Create your free site account so your interest can be connected to a real user profile before beta access opens.
View Subscription Plans
Review the subscription area where paid access will be handled once the data license and launch structure are finalized.
Registering does not guarantee access, pricing, or launch timing. It helps measure serious interest before the commercial data cost is activated. If you want early access, register first, then reply at the bottom of this page so I know you want to be considered for the first beta group.
Pattern Nexus Market Radar is not being built as a hype button, pump list, or “buy this now” signal service. The point is to help traders read pressure before they chase a move.
The app scans tickers, ranks market pressure, labels what the setup looks like, shows confirmation and invalidation logic, and gives the user a cleaner workflow: pick the row, read the chart, check the setup, respect the risk, and decide whether the ticker deserves attention or should be ignored.
This article explains the current app in plain public terms: the scanner, the chart workspace, the scoring panels, the admin feed status, the data broker process, the LLC requirement, estimated launch costs, the early subscriber plan, and why the project has to be handled as a real business before market data can be sold or displayed publicly.
The real product is not just a stock list. It is a market-reading system.
Pattern Nexus Market Radar takes raw market movement and turns it into a structured decision screen. It separates activity from quality, pressure from confirmation, and opportunity from chase risk. That matters because a ticker can be moving fast and still be a bad trade. The app is designed to make that distinction visible before the user acts.
What Pattern Nexus Market Radar is
Pattern Nexus Market Radar is a stock-scanner and market-pressure dashboard built to help traders slow down and read the setup before chasing a move. The app is designed around one basic idea: movement alone is not enough. A ticker can be active, volatile, and loud, but that does not automatically mean it is clean, tradable, or worth touching.
The dashboard organizes the trade read into a guided workflow. It looks at the ticker, the current activity, the structure, the chart, the volume, the VWAP relationship, the trend stack, support and resistance, the data freshness, and the risk label. Then it gives the user a readable state such as a long watch, short watch, setup forming, confirmation watch, avoid chase, too extended, or no-trade condition.
The goal is not to replace judgment. The goal is to make judgment less chaotic. Instead of staring at a fast-moving stock and guessing, the user gets a pressure map that says, in plain terms, what is happening and what still needs confirmation.
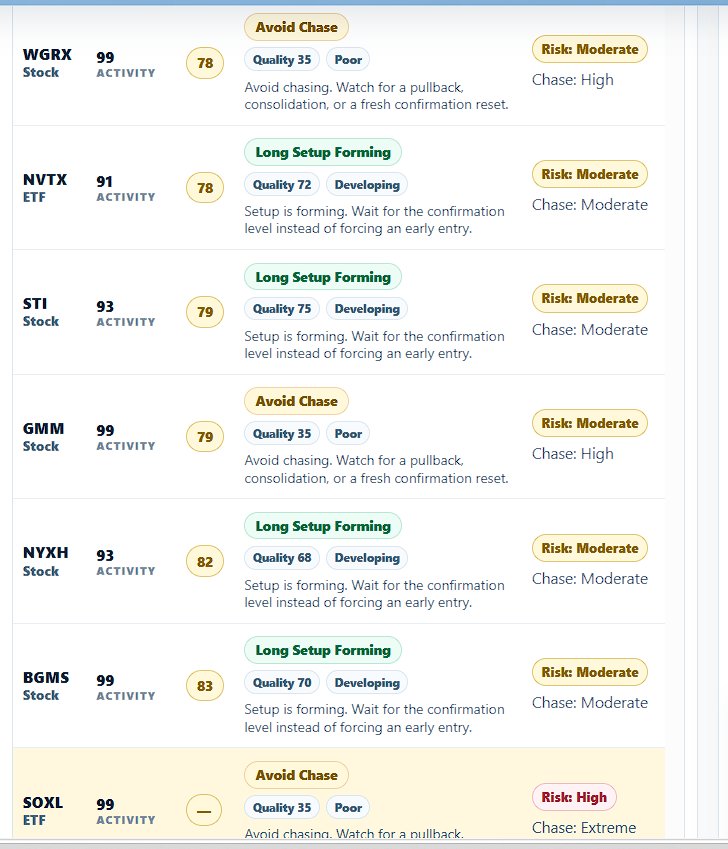
How the scanner works
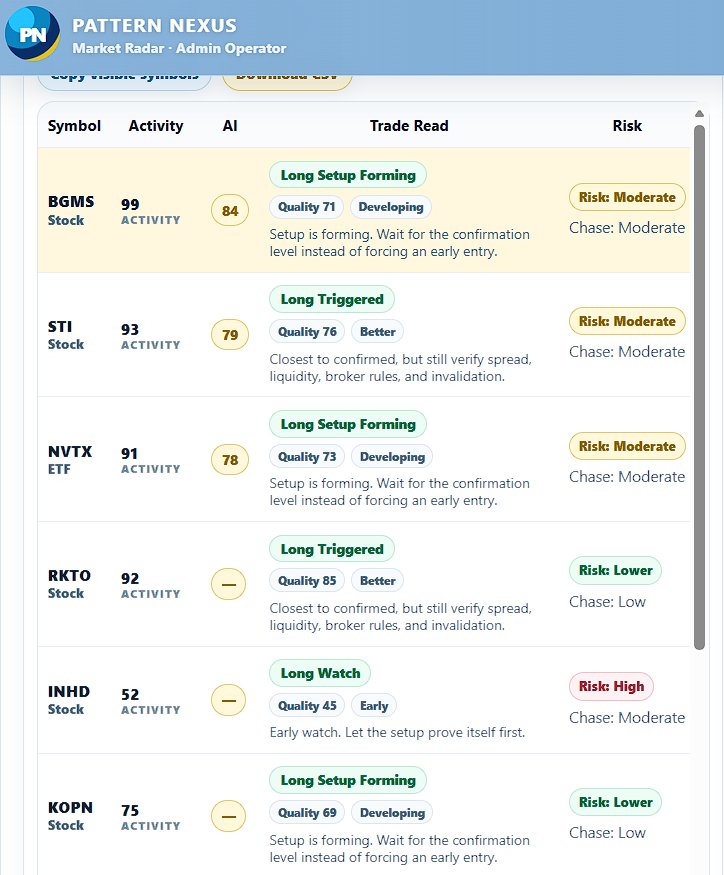
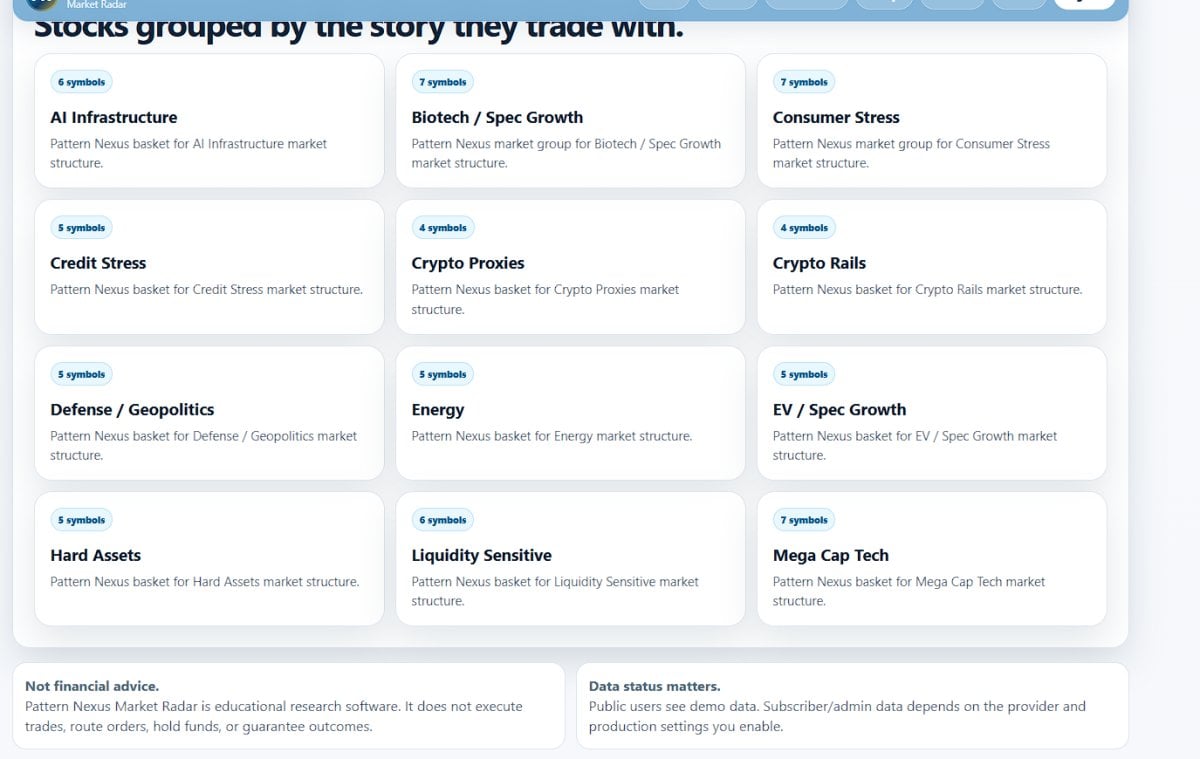
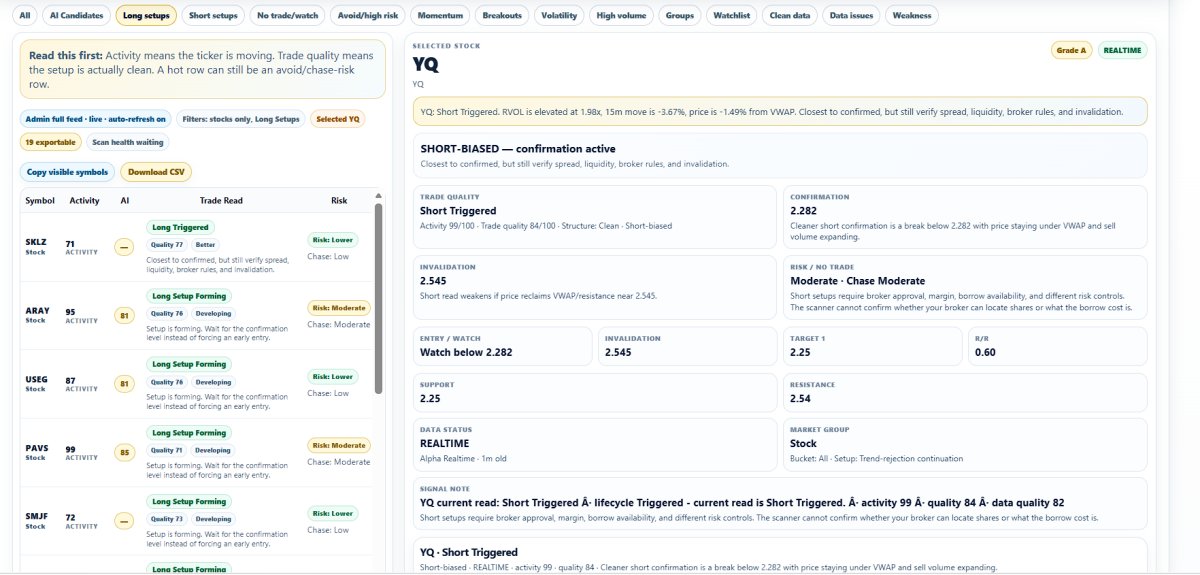
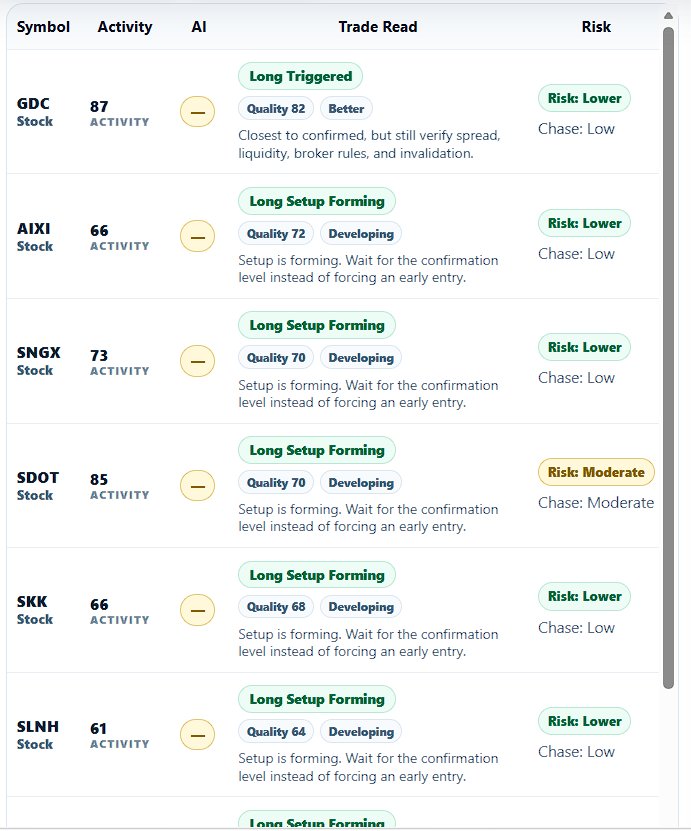
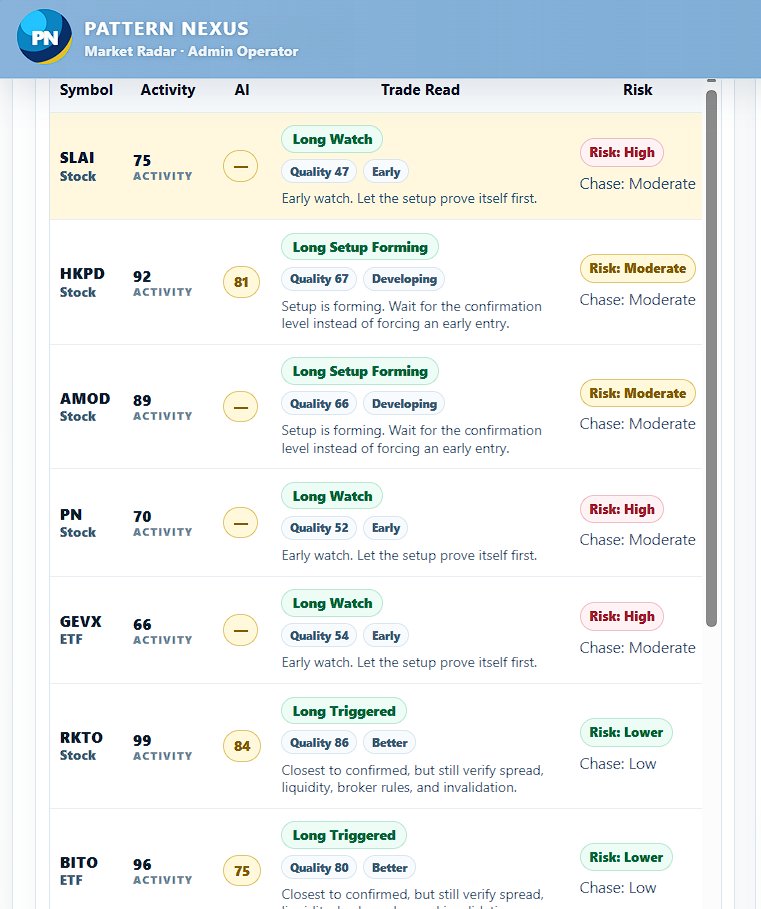
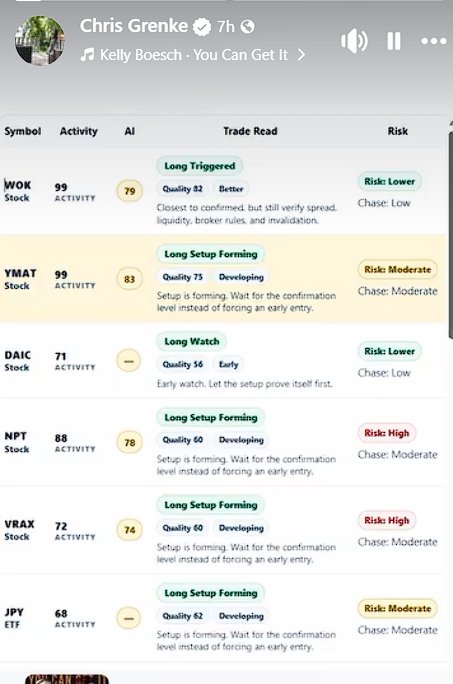
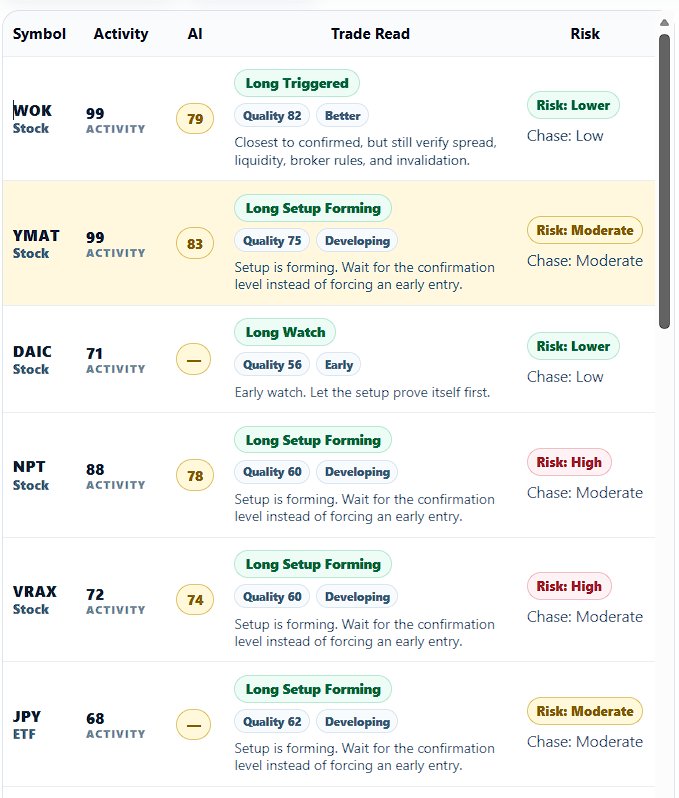
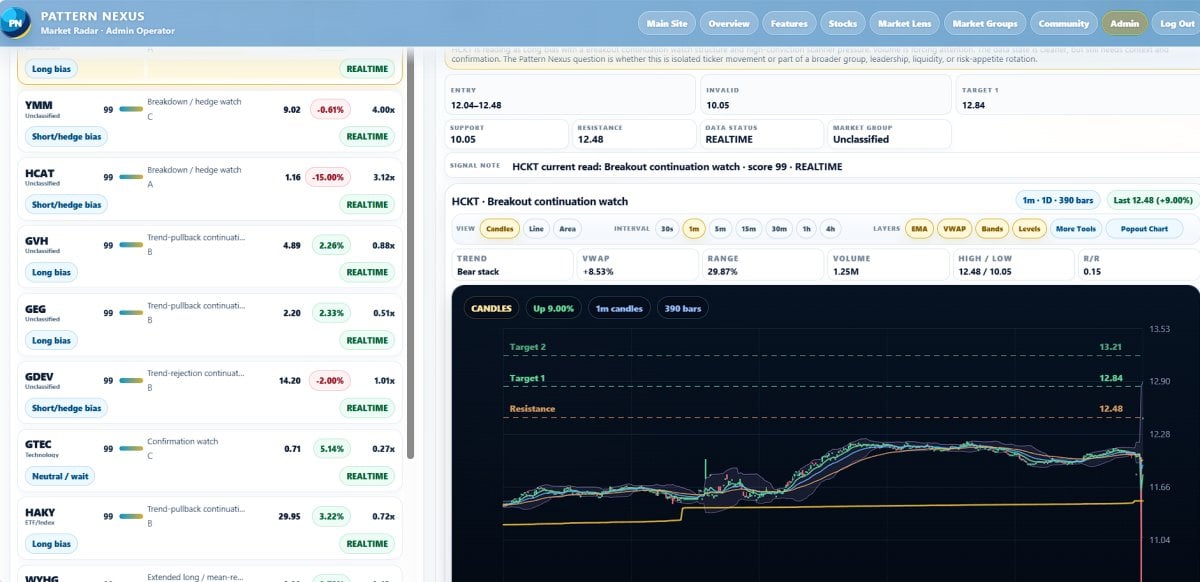
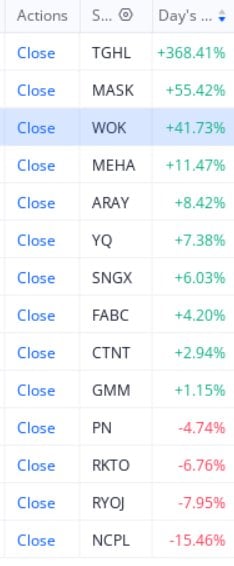
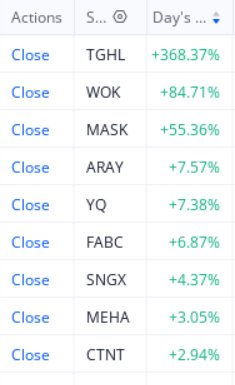
The scanner is the first layer of the app. It is built to surface tickers that deserve attention first, not to make every ticker look important. The visible scanner screen ranks symbols by pressure and separates the list using labels such as best read, long setup, short setup, volume, avoid risk, and clean data.
From the screenshots, the app is already showing the core workflow: loaded rows, feed status, filters, ticker search, minimum score controls, market group filters, setup filters, and export tools. The scanner keeps the user above the full workspace so the list stays readable while deeper tools stay below it.
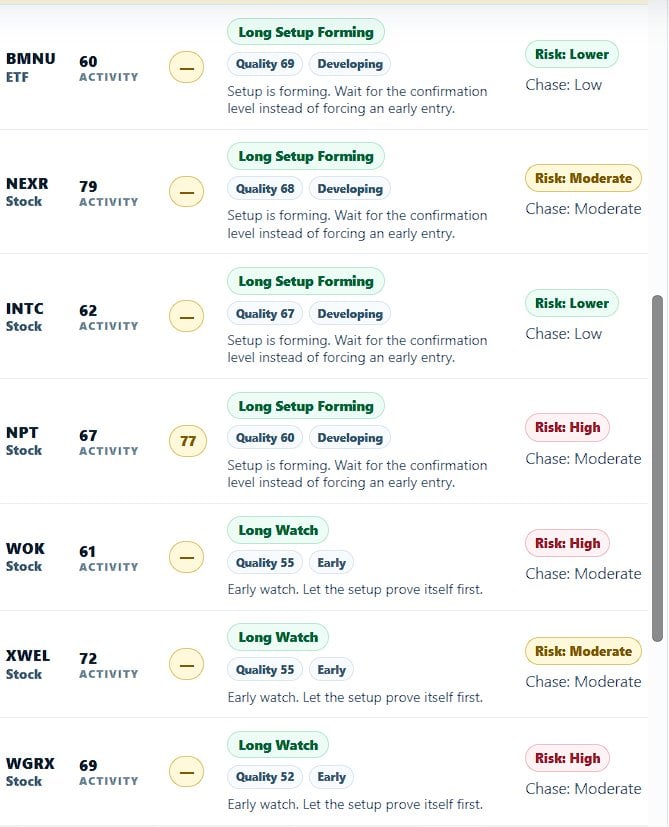
Each row is meant to tell the user three things quickly:
What is the ticker doing?
The app reads whether the row looks like a long watch, short watch, confirmation watch, avoid/chase risk, setup forming, or no-trade state.
What has to happen next?
The dashboard looks for follow-through, VWAP reclaim or rejection, breakout or breakdown behavior, and whether the chart confirms the row.
Is it clean or dangerous?
A ticker can have activity but still be extended, low quality, stale, mixed, or too risky to treat as actionable.
This matters because most bad trades are not caused by a total lack of information. They are caused by reading the wrong information first. A stock can be “moving,” but the better question is whether the move is still early, already extended, or waiting for confirmation.
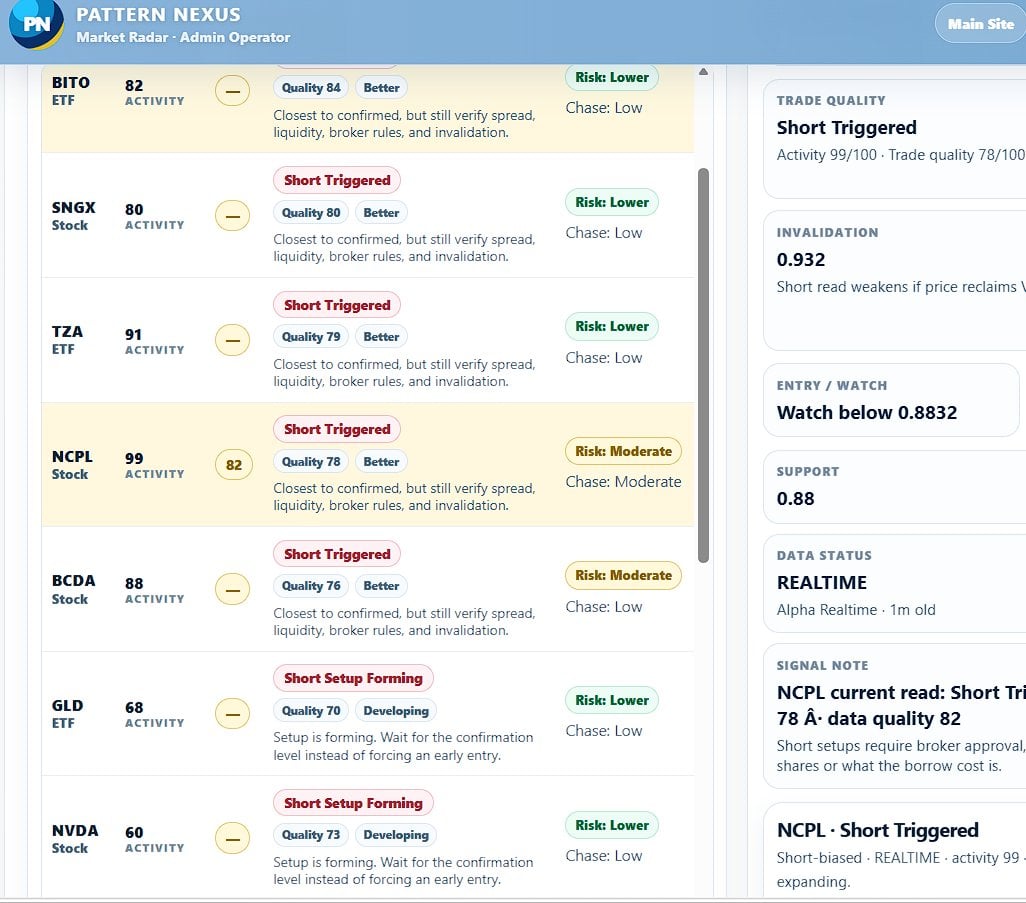
The chart workspace: read the setup before acting
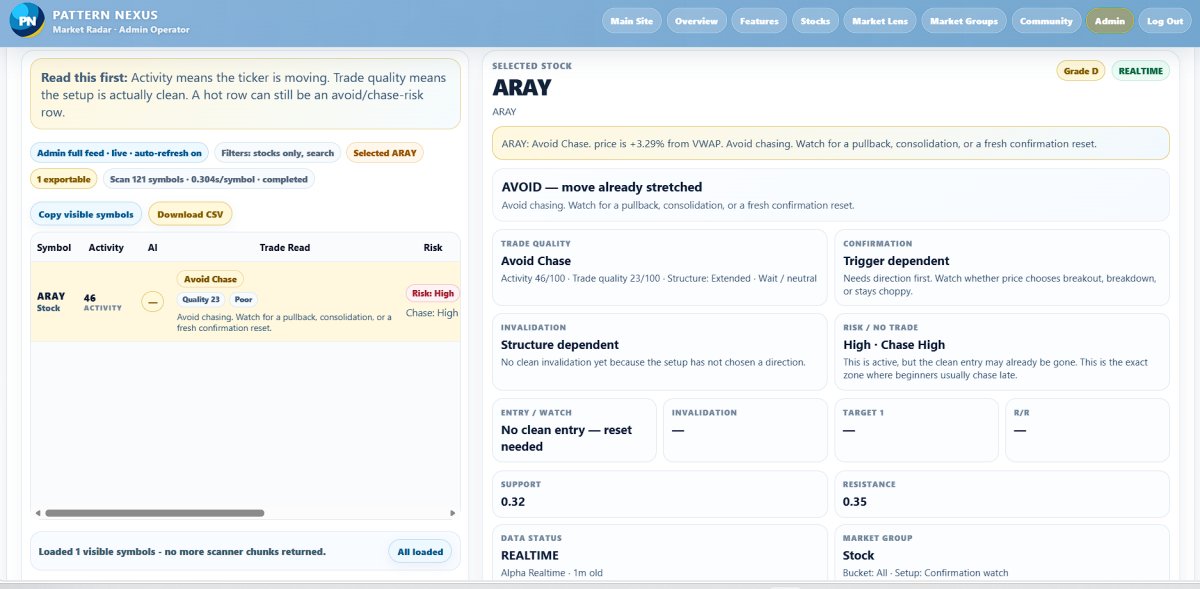
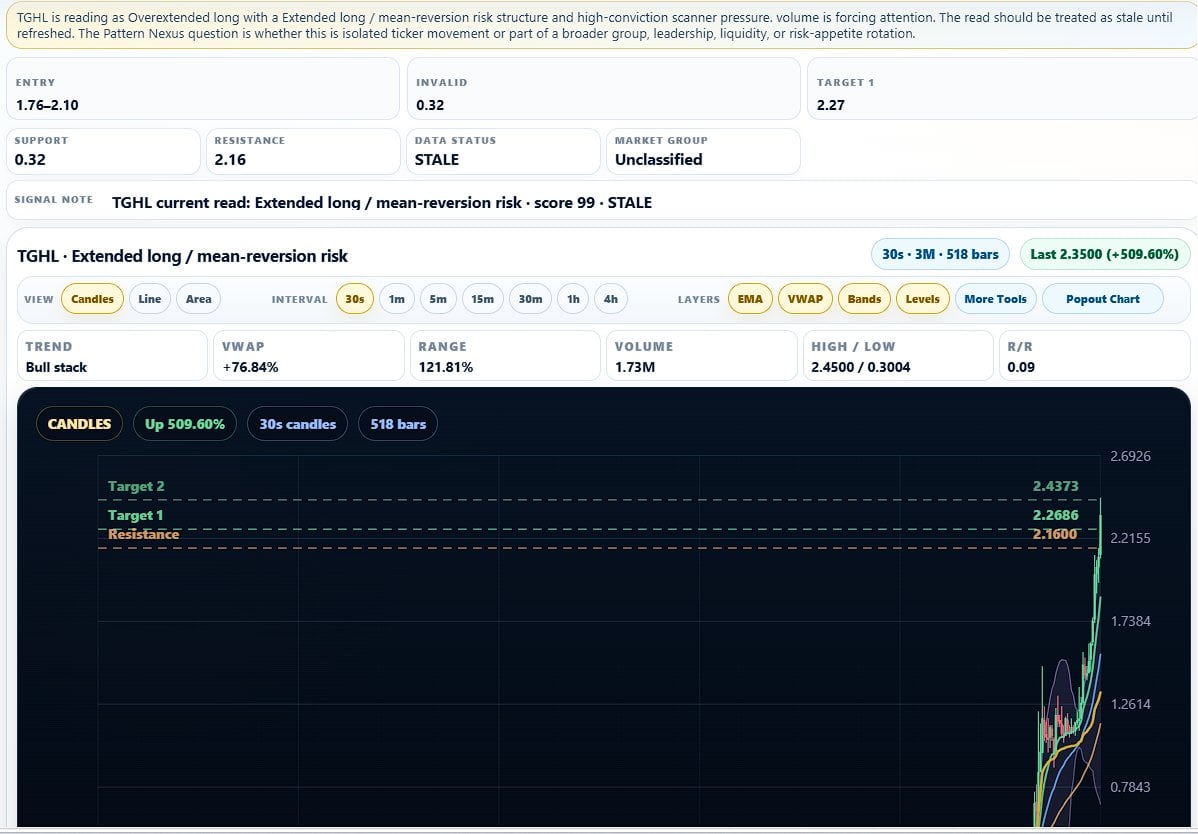
Once a ticker is selected, the app opens the full trade read. In the screenshots, ARAY is used as a visible example row. That does not mean ARAY is a recommendation. It is simply the symbol shown in the captured app state.
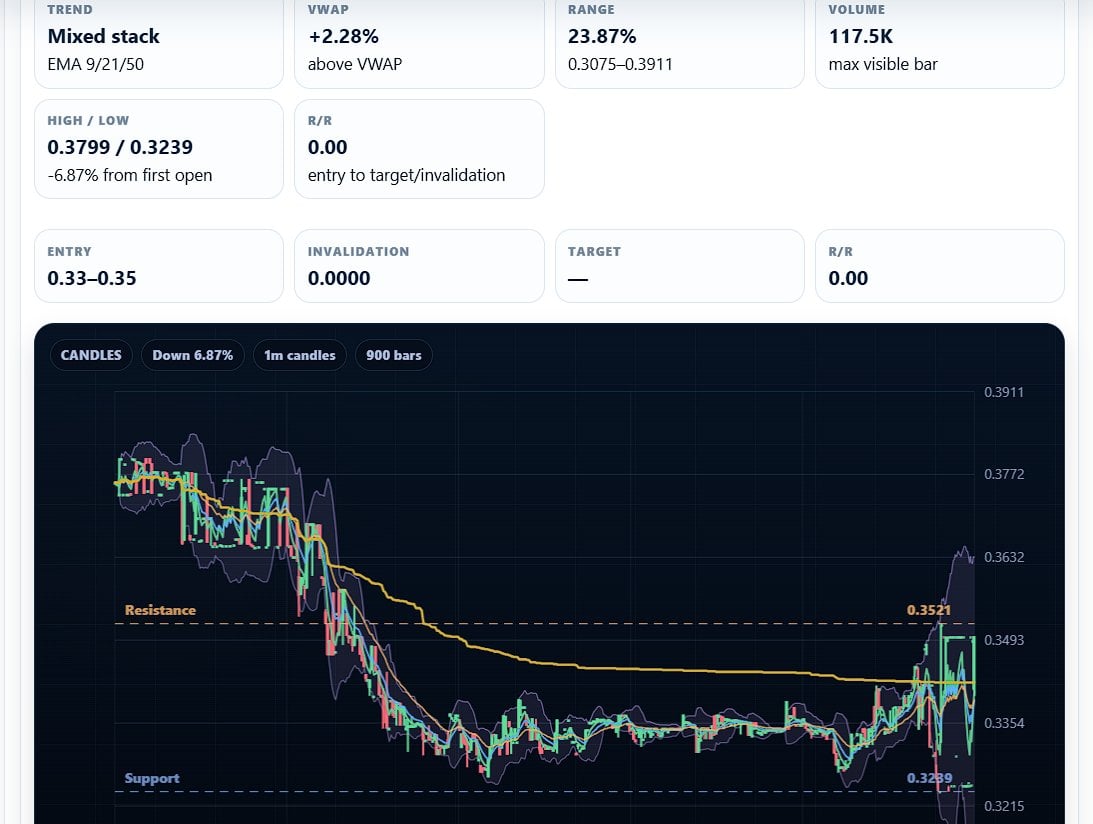
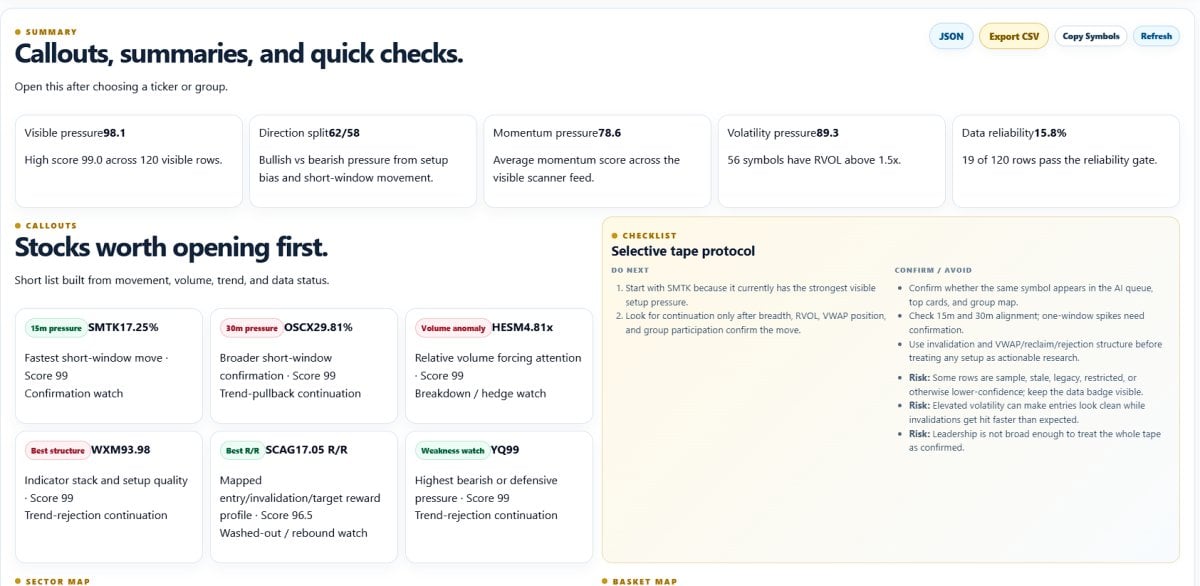
The selected stock panel shows the ticker, grade, real-time/data status, trade read, confirmation state, invalidation logic, risk/no-trade label, entry/watch area, support, resistance, market group, trend, VWAP position, range, volume, high/low, and reward/risk structure.
Example from the visible app state
The selected row shows an “avoid chase” style read. The app is not saying “buy.” It is saying the move is active, but the clean entry may already be gone, so the user should wait for a pullback, consolidation, or fresh confirmation reset.
That is exactly the kind of distinction the app is being built to make: active does not automatically mean actionable.
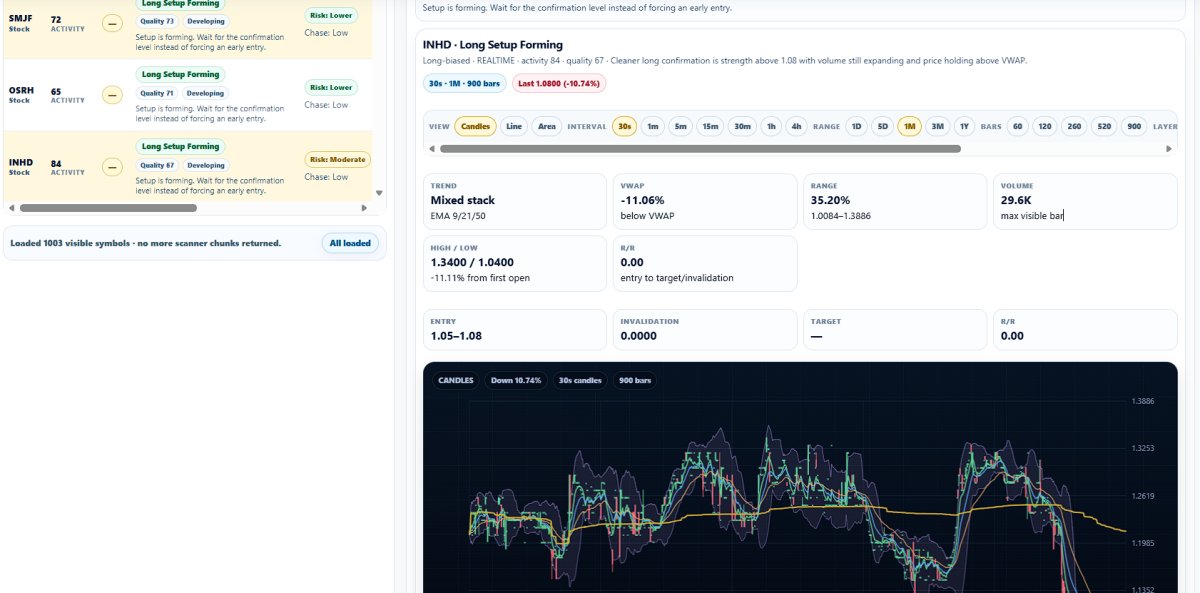
The chart view includes candles, moving-average behavior, VWAP context, support and resistance, range, volume, and intraday structure. The point is to connect the scanner row to the chart instead of letting the user blindly trust a score.
This is why the app language is built around “Trade Read” instead of “Signal.” A signal sounds like a command. A trade read is a structured interpretation. That difference matters. The user still has to check confirmation, invalidation, liquidity, risk, and timing.
The app is designed as a pressure map, not a magic button
The main screen says it directly: use it like a pressure map, not a magic button. A high score means pay attention. It does not mean enter blindly. The Trade Read tells the user whether the row is a possible long setup, short setup, watch-only state, too extended move, or no-trade situation.
That is the core product philosophy. The app is not trying to make trading look easier than it is. It is trying to make the decision environment cleaner. It pulls multiple pieces of market context into one workspace so the user can avoid reacting emotionally to every fast move.
Read the signal
Start with the trade read. Is this a watch, setup, avoid, or no-trade state?
Demand confirmation
Volume, VWAP, trend, and levels have to line up before the row becomes useful.
Respect invalidation
If the setup fails, it becomes information, not action.
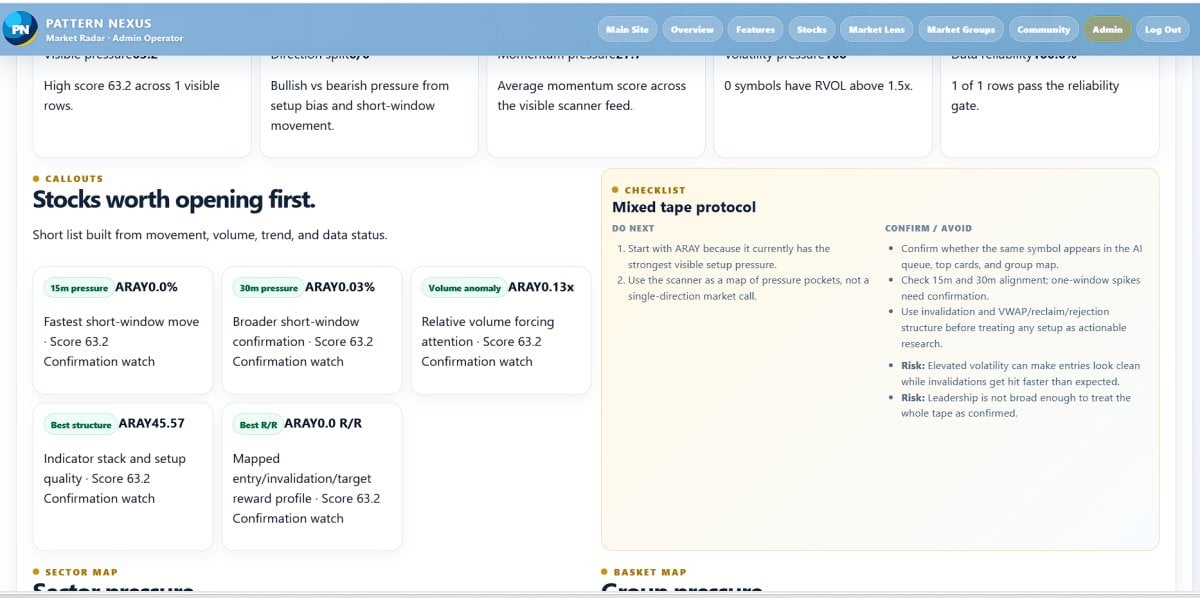
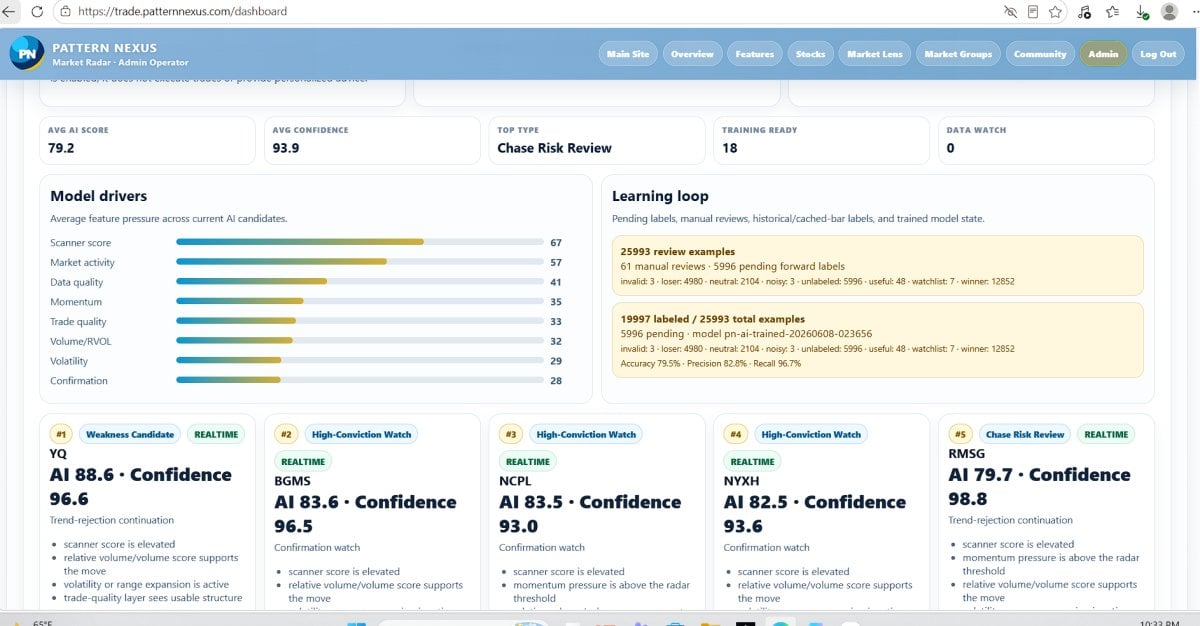
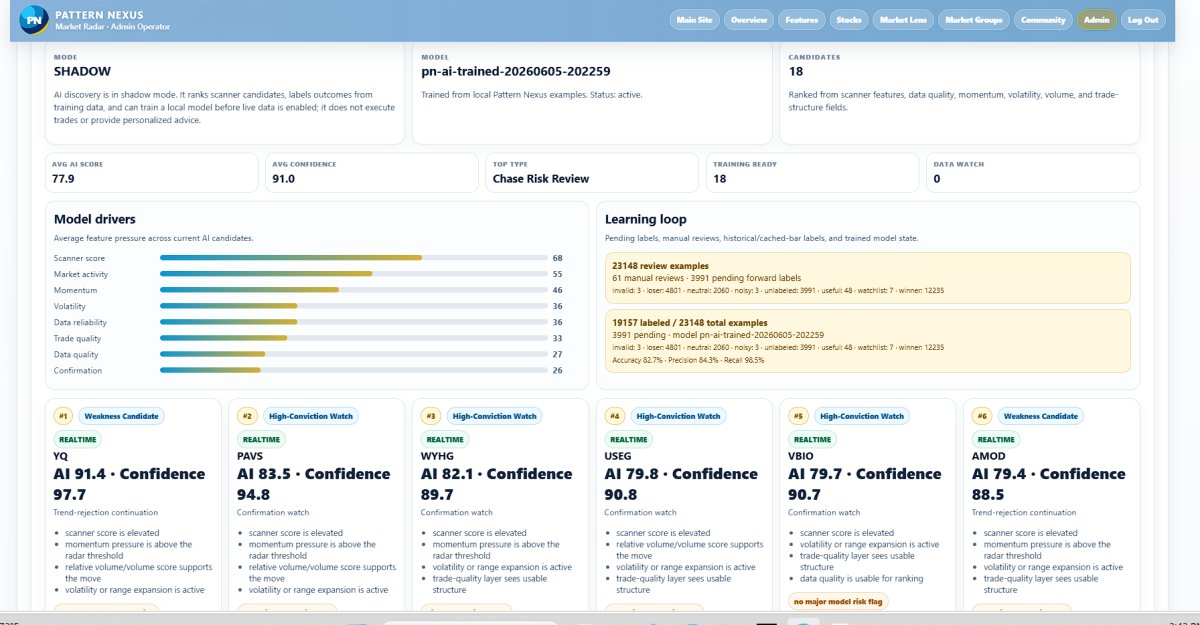
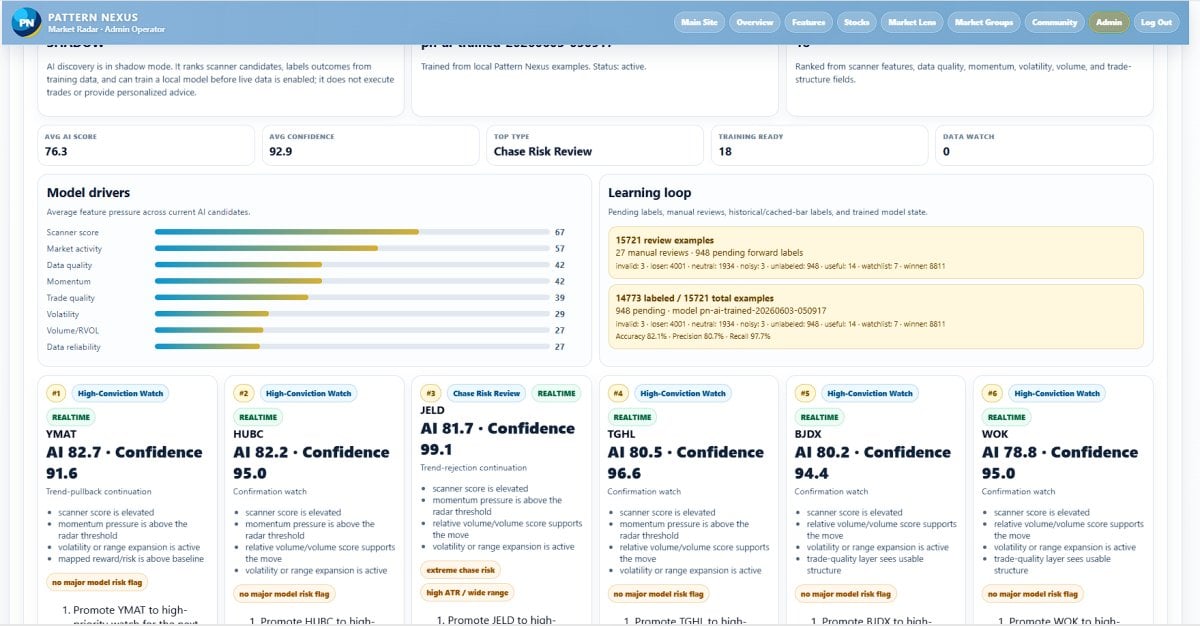
The admin side: feed status, cache, controls, and training rail
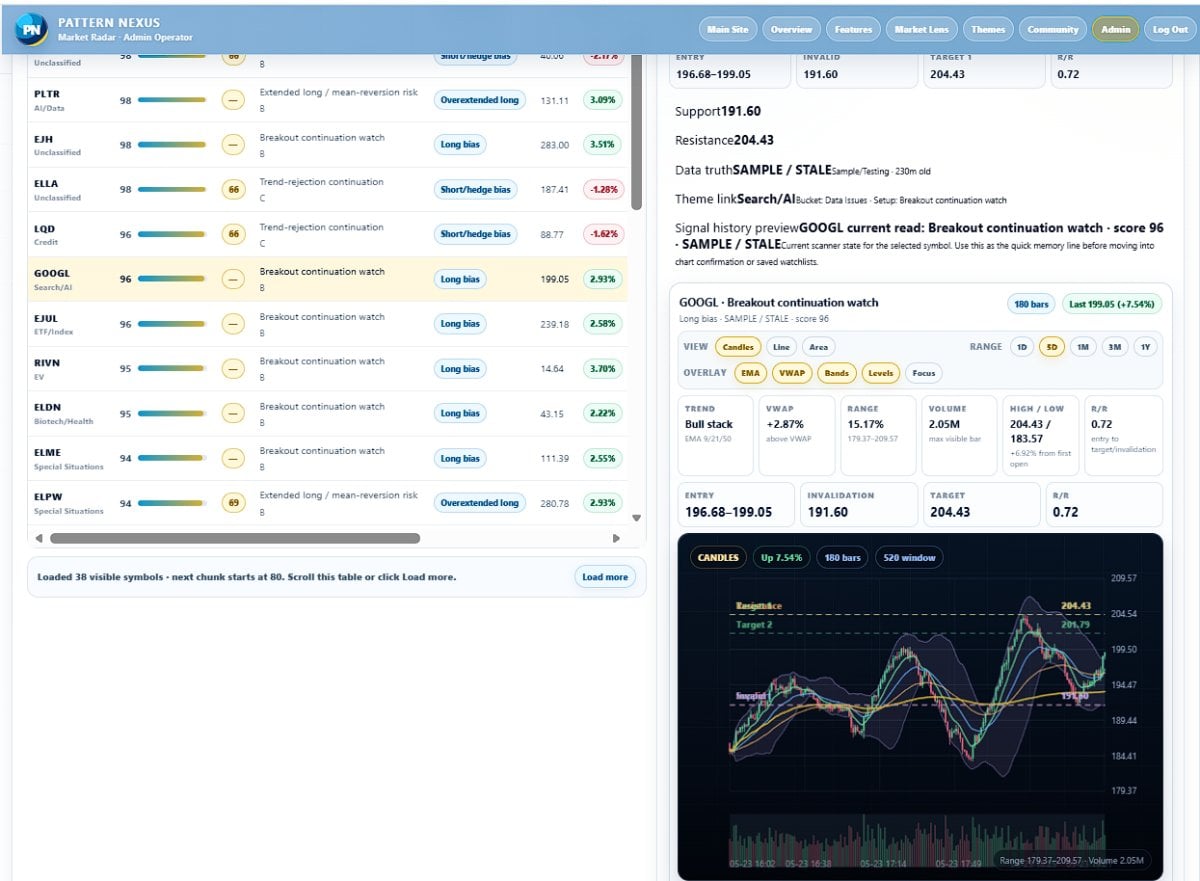
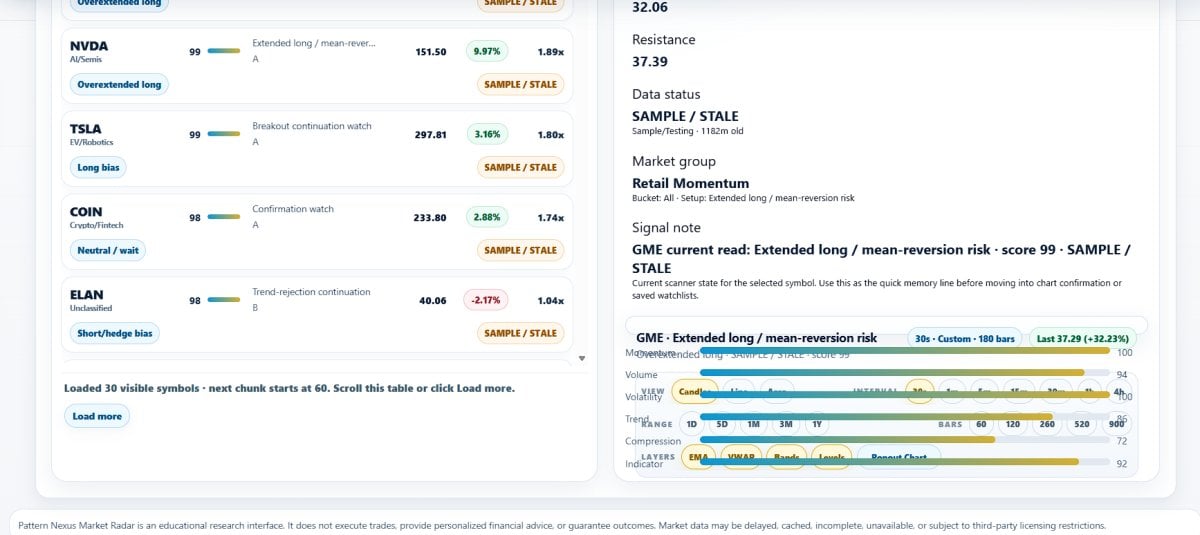
The screenshots also show the admin operator view. That part is not the normal user experience. It exists so the system can be monitored, tested, refreshed, and controlled before public users rely on it.
The admin panel shows access status, market snapshot status, data status, scanner row availability, provider/cache payload status, export controls, and operational tools. This matters because a market app is only useful if the data is fresh, readable, and correctly labeled.
The app currently separates public workflow from admin workflow. Public users should see the scanner, chart, trade read, and education panels. Admin controls, provider operations, full-feed handling, cache behavior, and training tools stay behind restricted access.
Technical architecture in public-safe terms
The app uses a backend data pipeline, server-side processing, a database layer, cached market payloads, PHP-driven web screens, and browser-based chart/scanner interfaces. The system pulls market data into a controlled workflow, processes it into readable scanner rows, and displays the result through the Pattern Nexus dashboard.
The exact formulas, thresholds, endpoints, provider details, and admin procedures are not public. That is intentional. The public version should explain what the system does without exposing the parts that protect the app, the data agreement, or the users.
Why the LLC and data broker process matters
This project cannot be launched like a random hobby page once live market data and paid access are involved. Before the app can be sold publicly, the business side has to be set up correctly.
The plan is to form an LLC, complete the data broker/vendor approval process, finish the required market data paperwork, and make sure the app is allowed to display the data under the correct commercial terms. That includes ongoing communication with the data provider side, exchange/data paperwork, account approval, usage description, billing setup, and compliance with whatever display and redistribution rules apply to the final agreement.
In plain English: the code is one part of the project. The legal data access is the part that determines whether it can become a real public product.
Why this step exists
Paid users cannot be offered a market-data product until the business entity, vendor contract, billing structure, and data-use permissions are handled correctly. That is why the project is moving through LLC formation, data broker communication, and exchange/data approval before a full paid launch.
Why the app has to charge
The app has to charge because the expensive part is not only the website. The real cost is operating a legitimate market-data product.
Current working estimates put the launch path at roughly a few thousand dollars upfront, plus about $1,300 per month in ongoing market-data/vendor cost once the commercial feed is active. There may also be a one-year commitment attached to the data side. Those numbers are not being treated as final public contract terms until everything is signed, but they are enough to explain why this cannot be offered as a free public scanner.
There are also normal business costs: LLC formation, banking, payment processing, server operations, caching, database work, support, development time, logging, maintenance, and future improvements. A scanner that updates, stores, filters, charts, and explains market movement is not just a static website.
Business setup
LLC, payment setup, legal/admin prep, vendor onboarding, and launch infrastructure.
Data and operations
Market-data access, server resources, database/cache work, monitoring, and ongoing maintenance.
Early subscriber target
The first goal is enough committed users to justify activating the commercial data agreement without burying the project in fixed cost.
The working subscription idea is a small private/beta launch around the $50-per-month range, subject to final data-license terms and the finished product scope. The first realistic milestone is not thousands of users. It is proving that enough serious users want the scanner to support the data cost and keep development moving.
What users would actually get
The planned user product is a focused trading dashboard, not a giant bloated platform. The value is in organizing the market read fast.
Live scanner workspace
Search, filter, score, and sort tickers by pressure, setup type, risk, data status, and market group.
Trade Read labels
Readable labels that explain whether the ticker is a watch, setup, avoid, chase risk, or no-trade state.
Chart confirmation
Candles, VWAP, trend behavior, support/resistance, volume, range, and structure in one view.
Risk-first workflow
The app highlights when the move is extended, mixed, stale, or not clean enough to treat as actionable.
Guided education
Built-in explanations for terms like VWAP, RVOL, confirmation, invalidation, and no-trade conditions.
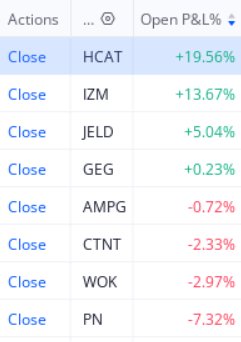
Export and watch workflow
Visible symbols can be copied or exported so users can build a tighter watchlist instead of chasing everything.
What this app is not
This needs to be said clearly: Pattern Nexus Market Radar is not financial advice. It is not a promise of profit. It is not an automated trading system. It is not a guarantee that a ticker will move in the direction of the read.
The app is a decision-support tool. It organizes data, chart context, and risk labels so the user can make a more informed decision. Every trade still carries risk. Every user is responsible for their own entries, exits, position size, and risk management.
Public-safe boundary
Why I built it this way
The scanner is built around the way traders actually get into trouble. Most people do not lose because they never saw a moving stock. They lose because they saw it too late, ignored the structure, chased a candle, missed the invalidation, or treated activity as confirmation.
Pattern Nexus Market Radar is designed to fight that behavior. It puts the warning labels directly next to the opportunity labels. If something is hot but extended, the app says that. If something needs confirmation first, the app says that. If the data is stale or the structure is mixed, the app should not pretend the setup is clean.
That is why the screenshots show language like “Read this first,” “Avoid Chase,” “Confirmation watch,” “No clean entry,” and “Respect invalidation.” The product is built to slow the user down just enough to make a better read.
What comes next
The next stage is turning the working build into a properly structured launch. That means finishing the LLC setup, continuing the data broker/vendor process, confirming the commercial data path, finalizing the subscription model, cleaning up the user-facing workflow, and testing the scanner with a limited group before opening wider access.
The early goal is simple: prove that enough users want this tool to justify the fixed data cost. If the subscriber base is there, the app can move from private build to paid beta and then into a broader Pattern Nexus trading product.
Launch path
- Finish LLC formation and business setup.
- Complete data broker/vendor approval and required data paperwork.
- Confirm final data cost, permitted use, and public display rules.
- Run private testing with the current scanner and chart workflow.
- Open limited paid beta only when the data agreement and product scope are ready.
- Scale features, groups, saved lists, community tools, and AI-assisted review after the core scanner is stable.
Pattern Nexus started as research, writing, and market interpretation. Market Radar is the next step: turning that same pressure-reading mindset into a working scanner. The point is not to make trading look easy. The point is to make the market read clearer before the user risks money.
Pattern Nexus Market Radar is being built as a scanner-first trading dashboard that ranks pressure, explains setup quality, shows confirmation context, and protects the user from treating every fast move as a clean trade. The build is working. The next barrier is not imagination. It is business structure, data licensing, and proving there is enough early demand to support the real cost of launching it correctly.
Pattern Nexus Market Radar is a market-data and decision-support tool. It is not financial advice, not a broker, not an investment adviser, and not a guarantee of trading results. All trading involves risk. Users are responsible for their own decisions, entries, exits, sizing, and risk management.
What's Your Reaction?
 Like
0
Like
0
 Dislike
0
Dislike
0
 Love
0
Love
0
 Funny
0
Funny
0
 Wow
0
Wow
0
 Sad
0
Sad
0
 Angry
0
Angry
0
Founder of Pattern Nexus. I research markets, macro, geopolitics, AI, history, ancient systems, and the patterns most people overlook. I’m also building Market Radar, a trading scanner designed to read pressure, risk, confirmation, and setup quality before chasing a move. Pattern Nexus is where I connect the dots between data, history, technology, and the bigger system playing out around us.

Comments (1)