Gold Was Right. The 10-Year Was Early. The War Premium Changed the Rate Path.
The original Pattern Nexus gold call hit the structural move: gold was not just trading inflation, it was repricing liquidity, policy failure, and the collateral stack. The miss was the 10-year yield. It did not break into the high-2% range because two wars changed the inflation, oil, shipping, deficit, and term-premium path after the gold call was already made.
This is not a victory lap. It is not a walk-back either. It is the honest update to the Pattern Nexus gold call.
The original call was that gold above the $4,300 zone was not a normal inflation trade. It was a structural repricing of liquidity, reserve credibility, collateral, policy credibility, and the deeper claims stack underneath the dollar system. That part was right.
Gold did not just drift higher. It broke into a new regime, pushed into the $5,000–$6,000 zone, and forced the market to treat gold like a balance-sheet signal again instead of a dead old-world hedge.
The part that was wrong was the 10-year yield timing. I expected gold to lead the bond market lower. I expected the 10-year to break toward the high-2% range as liquidity stress, QT exhaustion, policy reversal, and real-rate compression moved through the system. That did not happen.
The reason matters. The gold calls came before the war calls. Once two wars became the macro input, the long end of the Treasury market had to price a different world: oil risk, shipping risk, supply-chain risk, inflation risk, deficit spending, Treasury issuance, and term premium.
Gold was reading monetary stress. The 10-year was reading war inflation and fiscal supply pressure. That split does not kill the gold thesis. It fixes the model.
The useful market read is more precise than right or wrong. The gold call was not one post and not one price target. It was a chain: gold as system reset, gold versus the 10-year, gold front-running liquidity, gold locking into a new post-QT rail, and gold/silver digesting a liquidity-led advance.
Most of that chain aged well. One piece did not. The piece that failed was the bond-confirmation path. That is the part this article corrects.
The infographic is the scoreboard. The monthly gold chart is the proof layer. The prior Pattern Nexus articles are the call history. The current update is the bridge between them.
The final read is simple: gold did not fail. The simple rate path failed.
Gold repriced first. Bonds did not confirm because war changed the path.
Gold moved like a monetary asset because the system was already shifting. QT had reached its useful limit. Liquidity stress was showing up. Reserve behavior kept changing. Central banks kept buying. The old assumption that gold was just a dead hedge did not fit the price action anymore.
That was the right read. Gold moved into the $5,000–$6,000 zone and forced the market to acknowledge that this was a structural reprice, not just a commodity spike.
The problem was the 10-year. I expected the 10-year yield to confirm the gold signal by falling hard. Instead, war kept the long end elevated. War is not just fear. War is energy risk, shipping risk, fiscal risk, issuance risk, inflation risk, and term-premium risk. That is why the bond market did not give the clean confirmation I expected.
The updated Pattern Nexus call is that gold is now base-testing after the first major leg. If the old breakout rail holds, the gold thesis survives and the next leg can build from a higher floor. If the rail breaks, the January blowoff pulled too much forward and gold needs a deeper reset before the secular cycle resumes.
Gold Was a System Signal
Gold was repricing liquidity, reserves, collateral, and policy credibility — not just CPI.
Liquidity Was the Rail
Gold moved before policy language fully caught up with the end of QT and reserve management.
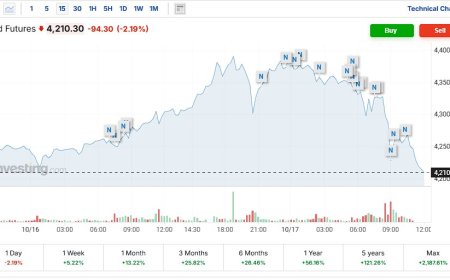
The 10-Year Did Not Break
The high-2% yield path did not happen on the original timeline.
War Changed the Long End
Oil, shipping, inflation risk, issuance, deficits, and term premium kept yields elevated.
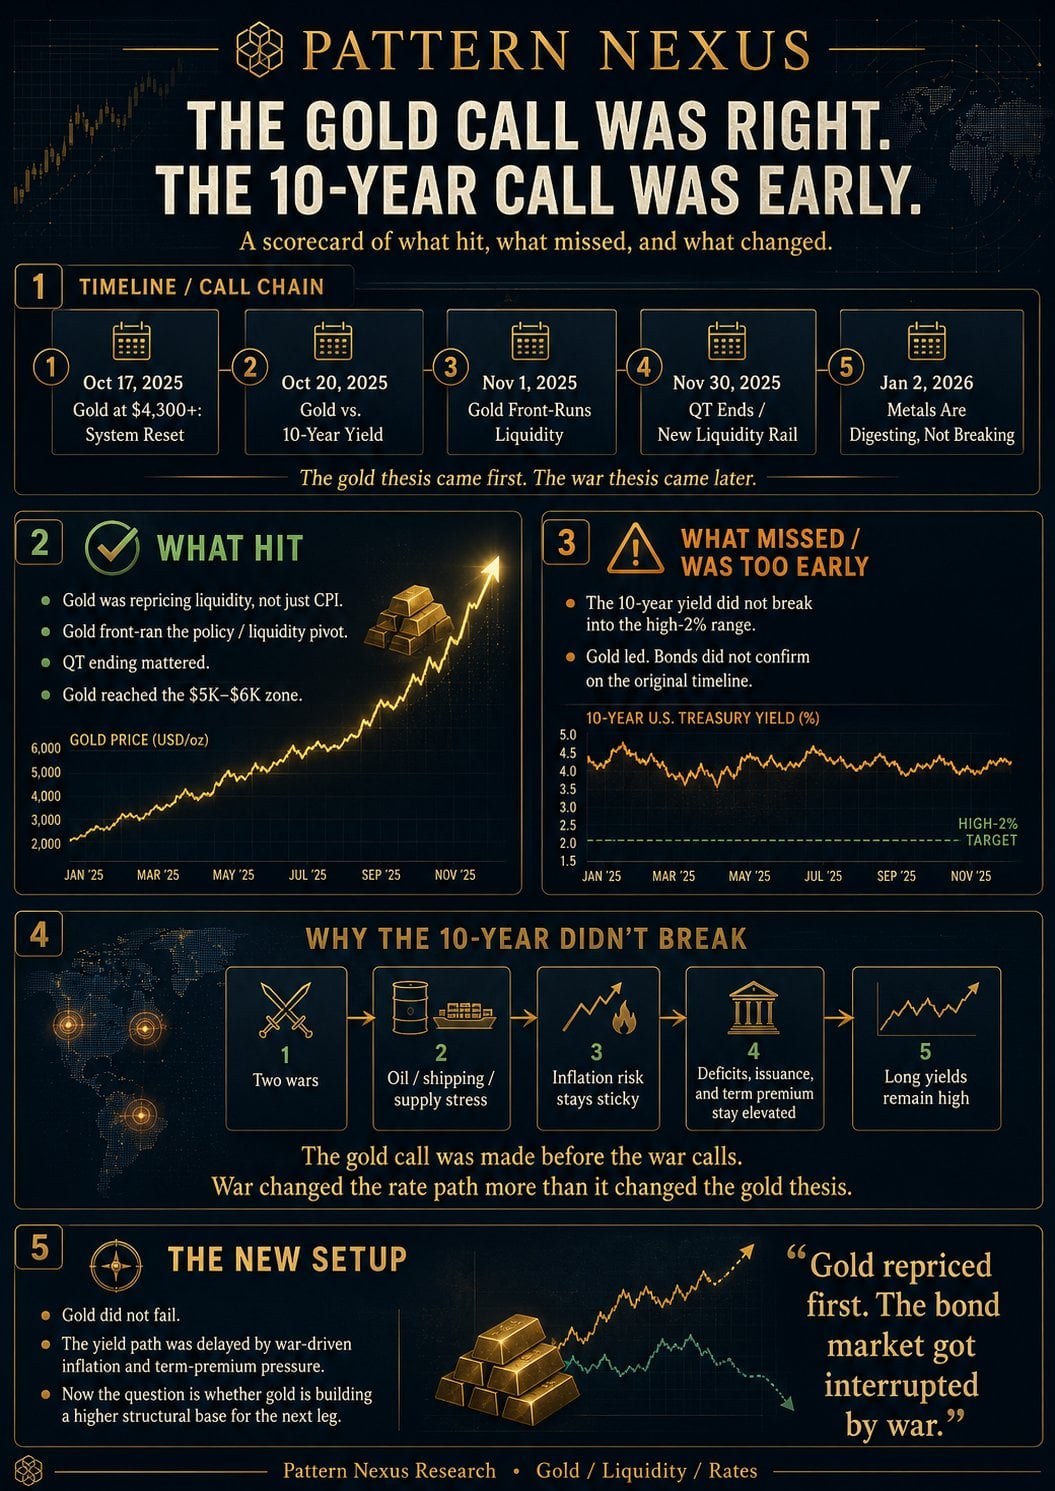
The Scorecard: Gold Hit, the 10-Year Missed, War Changed the Setup
The infographic for this article is the scorecard. It is not just a promotional image. It is the clean summary of the entire update: the gold call was right, the 10-year call was early, and the war premium changed the long-end rate path.
What hit was the structural gold thesis. Gold was not behaving like a normal commodity. It was not just moving because of one CPI print, one Fed meeting, or one safe-haven headline. It was moving because the financial system was repricing liquidity, reserve behavior, collateral value, fiscal strain, and the credibility of paper claims.
What missed was the 10-year yield. I expected gold to lead the bond market lower. I expected the 10-year to break toward the high-2% range once the market accepted that QT was ending, liquidity stress was building, and real rates could not stay pinned forever. That did not happen.
What changed was war. The gold calls came before the war calls. Once war became the dominant macro input, the 10-year had to price oil risk, shipping risk, sticky inflation, deficits, issuance, and term premium. Gold was reading monetary stress. The 10-year was reading war inflation and Treasury supply.
This Is Not Gloating. The Useful Part Is the Correction.
The easy article would be: “Gold ran. I was right.” That is too shallow and it misses the actual market lesson.
The better read is: “The gold thesis hit, but the 10-year confirmation failed on the original timeline.” That is the part that matters because it tells us which part of the model worked and which part needs to be corrected.
The original gold call was not a basic gold-bug article. It was not built around the simple line that inflation makes gold go up. It was built around the idea that gold was becoming a system signal again.
Gold was trading liquidity, reserve credibility, central-bank demand, collateral reweighting, and the fact that every time the financial system gets too tight, policy has to move back toward support.
That structure was validated. Gold moved before the public narrative caught up. QT ended. Reserve-management purchases returned. Gold ran into a new zone. Central-bank demand and reserve behavior stayed part of the backdrop.
But the 10-year did not validate the gold signal the way I expected. That is the miss. I expected the 10-year to fall toward the high-2% range. It did not. The long end stayed elevated because the market was forced to price a different layer of the system: war inflation, Treasury supply, and term premium.
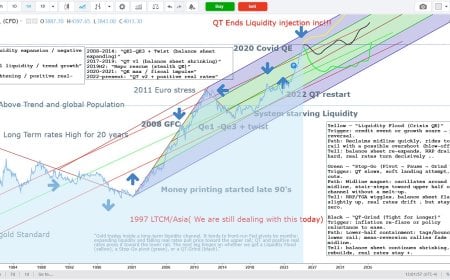
The Monthly Gold Chart: Three Secular Waves and One Rail Test
The chart is the spine of the article. It takes the conversation out of daily noise and puts gold back into its real time frame: long monetary cycles.
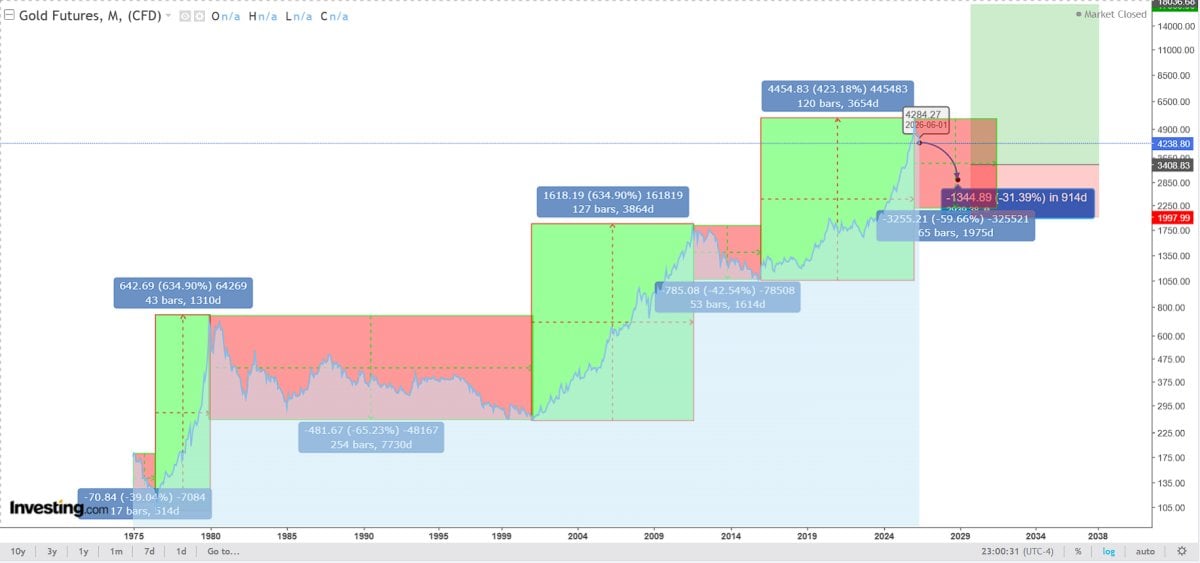
The first major wave was the 1970s move into the 1980 peak. On the chart, that move is marked around +642.69 points, or roughly +634.90%, across 43 monthly bars. That was the monetary-break cycle. The old framework failed, inflation credibility broke, and gold repriced violently.
Then came the digestion. The chart marks a sharp correction of roughly -39.04% across 17 monthly bars. After that came the long post-1980 bear market and sideways collapse, marked around -65.23% across roughly 254 monthly bars. Gold does not just rise forever after a secular spike. It reprices, overshoots, corrects, and then spends years proving whether the new base is real.
The second major wave was the early-2000s to 2011 move. Our chart marks that leg around +1,618.19 points, or roughly +634.90%, across 127 monthly bars. Different era, similar secular extension. This was the debt, dollar, real-rate, and post-crisis monetary-policy wave.
Then gold corrected again. The chart marks the 2011-2015 decline around -42.54% across roughly 53 monthly bars. Again, the point is not that gold failed forever. The point is that secular gold waves have violent digestion phases.
The current wave is the important one. The chart marks the move from the 2015 low into the 2026 high around +4,454.83 points, or roughly +423.18%, across 120 monthly bars. That is already a massive move. It is large enough to prove the gold call was not noise. But it has not matched the prior two measured secular extensions around +635%.
That does not mean gold must mechanically repeat the past. Markets do not owe us symmetry. It means the current cycle belongs in the same family of secular monetary repricing events. The current correction is the rail test after the first major leg.
| Cycle | Chart measurement | What drove it | What came next |
|---|---|---|---|
| 1970s gold wave | About +635% across 43 monthly bars | Monetary break, inflation credibility failure, dollar-system reset | Sharp correction, then long digestion |
| 2000s gold wave | About +635% across 127 monthly bars | Debt cycle, dollar pressure, lower real rates, post-crisis policy | Deep correction into 2015 base |
| Current gold wave | About +423% across 120 monthly bars | Liquidity stress, reserve demand, collateral repricing, fiscal dominance, war premium | Current rail test after first major leg |
The Old Gold Articles Were a Chain, Not One Trade
This update is not built from one old post. It is built from the entire Pattern Nexus gold sequence.
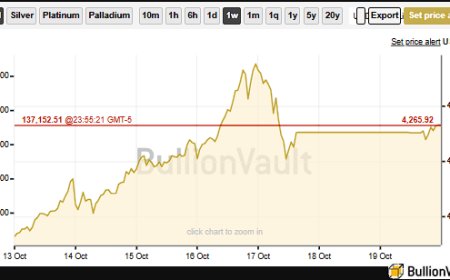
- October 17, 2025 — Gold at $4,300+: System Reset. The first major call said gold breaking the $4,300 zone was not a normal bull run. It was a structural repricing of global value. The market was not just paying more for gold; it was changing the measuring stick.
- October 17, 2025 — The Rough Day Did Not Change the Bigger Picture. The first pullback did not break the thesis. Gold was releasing pressure after a vertical move, but the larger liquidity and reserve framework was still intact.
- October 20, 2025 — Gold vs. the 10-Year Yield. This was the mixed call. Gold was moving first. That part was right. The 10-year was expected to follow lower into the high-2% range. That part did not happen on the original timeline.
- November 1, 2025 — Gold Front-Runs Liquidity. This was one of the strongest calls. Gold was trading plumbing before the policy language caught up. It was front-running QT stress, liquidity relief, and real-rate pressure.
- November 30, 2025 — Gold Locked Into a New Liquidity Rail. The point was not that gold had to moon immediately. The point was that gold had attached itself to a new rail as QT ended and reserve management returned.
- January 2, 2026 — Gold and Silver Were Digesting, Not Breaking. This post matters now because the correction is not automatically a failure. After a liquidity-led surge, metals can digest violently and still remain inside a secular reprice.
The chain is what matters. The old framework was not “gold up forever.” It was: gold is repricing the system, gold is leading liquidity, gold is entering a new rail, and the correction after a vertical move has to be judged as digestion unless the rail breaks.
What Hit: The Gold Thesis Was Right on Structure
The gold thesis hit in several different ways.
First, gold was not simply trading CPI. If the move were only an inflation trade, it would have been easier to dismiss as another commodity spike. But the scale and persistence of the move pointed to something deeper: liquidity, reserve behavior, collateral repricing, and trust in the paper-claim stack.
Second, gold front-ran the liquidity turn. The November liquidity article said to watch the plumbing, not the headlines. That was the right frame. Gold moved before everyone agreed on the policy language.
Third, QT ending mattered. The old call argued that the system could not run balance-sheet reduction forever without eventually hitting reserve and funding limits. When the Fed ended QT and moved into reserve-management purchases, gold had already priced the direction.
Fourth, gold reached the zone that looked extreme when the first article was written. The $5,000-$6,000 window was not random. It was the extension zone for a structural reprice if gold stopped being valued like a normal commodity and started being valued like a monetary-system asset.
Fifth, the January digestion framework held. The correction is large and it matters, but it is still consistent with a vertical liquidity-led advance that needs to clear leverage and reset positioning.
What Missed: The 10-Year Did Not Break Lower
This is the correction section. It should be direct.
The original 10-year call expected gold to lead the bond market lower. The logic was clean: if gold was already pricing liquidity stress, policy reversal, and falling real-rate pressure, then long yields should eventually follow. The 10-year was expected to move toward the high-2% range.
That did not happen. The 10-year stayed elevated. It did not confirm the gold signal on the original timeline.
That does not erase the gold call. It does force a better model.
The mistake was treating the 10-year too cleanly as a liquidity-stress instrument. The 10-year is also an inflation instrument, a fiscal instrument, a Treasury-supply instrument, a global-reserve-demand instrument, and a term-premium instrument. War pushed on those channels at the same time.
Gold was saying the monetary system was trapped. The 10-year was saying inflation, oil, deficits, issuance, and term premium were not dead. Those can both be true at the same time.
Why War Changed the Rate Path More Than the Gold Thesis
The key timing issue is simple: the gold calls came before the war calls.
Before war became the dominant macro input, the clean Pattern Nexus path looked like this: liquidity stress builds, QT ends, the Fed bends, real yields fall, and gold keeps repricing higher.
That was the clean version of the cycle.
But the world did not stay clean. Two wars changed the long-end bond market. War does not just create fear. It creates inflation channels.
War raises energy risk. It threatens shipping lanes and chokepoints. It raises insurance costs and supply uncertainty. It increases defense spending. It widens deficits. It forces more Treasury issuance. It makes inflation harder to kill. It makes investors demand more compensation to hold long-duration debt.
That is the term-premium problem. Even if the liquidity system is weakening, the 10-year can stay elevated if investors believe inflation risk, fiscal risk, and issuance risk are rising at the same time.
Geopolitical stress becomes a persistent macro input instead of a temporary headline.
Energy, transport, chokepoints, insurance costs, and supply-chain risk keep inflation pressure alive.
The market prices a Fed that cannot cut as freely as the liquidity system wants.
War spending and fiscal stress increase the amount of long-duration paper the market must absorb.
Investors demand more compensation to hold long bonds when inflation, fiscal, and geopolitical uncertainty rise together.
The 10-year refuses to validate the gold signal through a clean yield collapse.
War Can Pressure Gold First and Support Gold Later
War can be bullish for gold through safety demand, sovereign-confidence risk, reserve fragmentation, and currency distrust. But war can also be bearish for gold in the short run if the market reads it as inflationary and pushes yields and the dollar higher.
Those two channels can fight each other.
War as inflation pressure: If war pushes oil higher, keeps inflation sticky, raises rate-hike expectations, strengthens the dollar, and lifts real yields, gold can sell off even while the long-term gold thesis remains alive.
War as confidence risk: If war becomes proof of fiscal dominance, deficit finance, sovereign strain, reserve fragmentation, and monetary debasement, the same war premium becomes bullish for gold.
Gold is not simply trading war. Gold is trading which war channel dominates first. If the market sees war mainly as inflation, yields stay high and gold can remain under pressure. If the market sees war as sovereign-confidence damage, gold becomes the cleaner hedge again.
The Future Call From the Chart
The updated call is not that gold must go straight back to the high. It is also not that gold is dead. The updated call is that gold is base-testing after the first major leg of the structural reprice.
The completed advance is the +423% move into the 2026 high. That confirms the structural call. Gold already delivered the first major leg.
The correction window is the rail test. The chart shows that gold can correct hard after a major move and still remain inside a secular structure. A large drawdown from the high would not automatically kill the long-term thesis if the old breakout rail holds.
The key zone is the broad low-$4,000 region, especially the old $4,000-$4,300 breakout rail. That zone is no longer just support. It is the line between two different interpretations of the entire move.
If gold holds that rail and starts rebuilding, the October system-reset thesis survives. It means the market accepted gold on a higher monetary floor after the first blowoff. In that case, the current correction becomes the base before the next leg.
If gold loses that rail and cannot reclaim it, then the January high pulled too much of the thesis forward. In that case, gold may need a deeper reset before the secular cycle can resume.
The upside case from the chart is the long-cycle projection. If the current wave eventually rhymes with the prior secular gold waves, and if the war premium shifts from inflation pressure into sovereign-confidence pressure, gold can move much higher over time. That is not a short-term promise. It is the long-cycle scenario if the monetary reprice continues across the next decade.
| Scenario | What it means | What confirms it |
|---|---|---|
| Base-building case | Gold digests the first leg and builds a higher floor. | Gold holds the $4,000-$4,300 rail and stops making lower structural lows. |
| Bull continuation case | The war premium flips from inflation pressure into sovereign-confidence pressure. | Gold holds while the 10-year stops rising and the dollar loses its rate-pressure bid. |
| Deeper reset case | The January high pulled too much of the thesis forward. | Gold loses the rail, real yields stay elevated, and the dollar remains strong. |
What I’m Watching Now
The next move is not about one headline. It is about which signal wins: the gold signal or the long-rate signal.
- The low-$4,000 gold rail: If gold holds the old breakout rail, the correction is more likely a base. If it loses the rail, the market is forcing a deeper reset.
- The 10-year yield: The gold thesis strengthens if the 10-year stops pressing higher. It weakens tactically if real yields and the dollar keep rising together.
- War premium behavior: If war stays an inflation shock, it pressures gold through rates. If it becomes a sovereign-confidence shock, it becomes a gold catalyst.
- Fed balance-sheet direction: Gold likes the return of liquidity support, but it needs the market to believe that support is bigger than the rate-pressure channel.
- Central-bank and ETF demand: Structural demand confirms the monetary thesis. ETF outflows or weak physical demand can delay the next leg.
- Dollar strength: A stronger dollar and higher rate expectations can pressure gold even when the long-term reserve thesis remains alive.
The Final Pattern Nexus Read
Gold did not fail. The simple rate path failed.
That is the cleanest way to update the call.
The old gold articles were right on the structure. Gold above $4,300 was not a normal bull run. It was a system reset. Gold did front-run liquidity. QT did end. Reserve-management purchases did return. The move into the $5,000-$6,000 range validated the idea that gold was being repriced as a monetary and collateral asset, not just a commodity.
The wrong part was the 10-year. I expected the bond market to confirm gold through lower long yields. That did not happen because two wars changed the long-end equation. War made the 10-year price oil, shipping, sticky inflation, deficits, issuance, and term premium.
The new chart ties it all together. The current gold cycle is already a major secular move, but it is not obviously finished unless the rail breaks. The current correction is the test. If gold holds the low-$4,000 region and rebuilds, the thesis survives. If it loses that region and cannot reclaim it, the January blowoff needs a deeper reset.
Gold repriced first. The bond market got interrupted by war. Now the market has to decide whether that interruption delays the next gold leg or becomes the reason for it.
Sources
- Pattern Nexus — Gold Search Archive
- Pattern Nexus — Gold at $4,300+: This Isn’t a Bull Run — It’s a System Reset
- Pattern Nexus — Gold’s Rough Day Doesn’t Change the Bigger Picture
- Pattern Nexus — Gold vs. the 10-Year Yield
- Pattern Nexus — Gold Didn’t Moon — It Front-Ran Liquidity Again
- Pattern Nexus — Gold Didn’t Moon — It Locked Into a New Liquidity Rail
- Pattern Nexus — Gold Didn’t Moon — It Repriced Liquidity
- Pattern Nexus — Gold and Silver Are Not Breaking — They Are Digesting a Liquidity-Led Advance
- Pattern Nexus — Everything Bubble 3: Markets Priced in Gold
- Pattern Nexus — Gold Didn’t Just Reprice — It Quietly Cut Housing in Half
- Reuters — Gold’s record rally falters as bulls run into Fed rate expectations and stronger dollar
- Reuters — Gold heads for second weekly loss on rate rise expectations
- Reuters — Oil volatility and war-driven market stress
- FRED — Market Yield on U.S. Treasury Securities at 10-Year Constant Maturity
- New York Fed — Statement Regarding Reserve Management Purchases
- World Gold Council — Gold Demand Trends: Full Year 2025
What's Your Reaction?
 Like
0
Like
0
 Dislike
0
Dislike
0
 Love
0
Love
0
 Funny
0
Funny
0
 Wow
0
Wow
0
 Sad
0
Sad
0
 Angry
0
Angry
0
Founder of Pattern Nexus. I research markets, macro, geopolitics, AI, history, ancient systems, and the patterns most people overlook. I’m also building Market Radar, a trading scanner designed to read pressure, risk, confirmation, and setup quality before chasing a move. Pattern Nexus is where I connect the dots between data, history, technology, and the bigger system playing out around us.


Comments (0)