
The 52-Cent Economy: Where the American Output Dollar Actually Goes
America produces nearly $32 trillion a year, but the median W-2 worker experiences only a fraction of the aggregate output. This Pattern Nexus report maps GDP, total employee compensation, cash wages, government purchases, total government current expenditures, taxes, transfers, and the after-tax worker-capture problem. It tests the claim that only 10 cents of each productivity dollar returns to the people producing the system—and replaces the slogan with a defensible multi-layer accounting model.
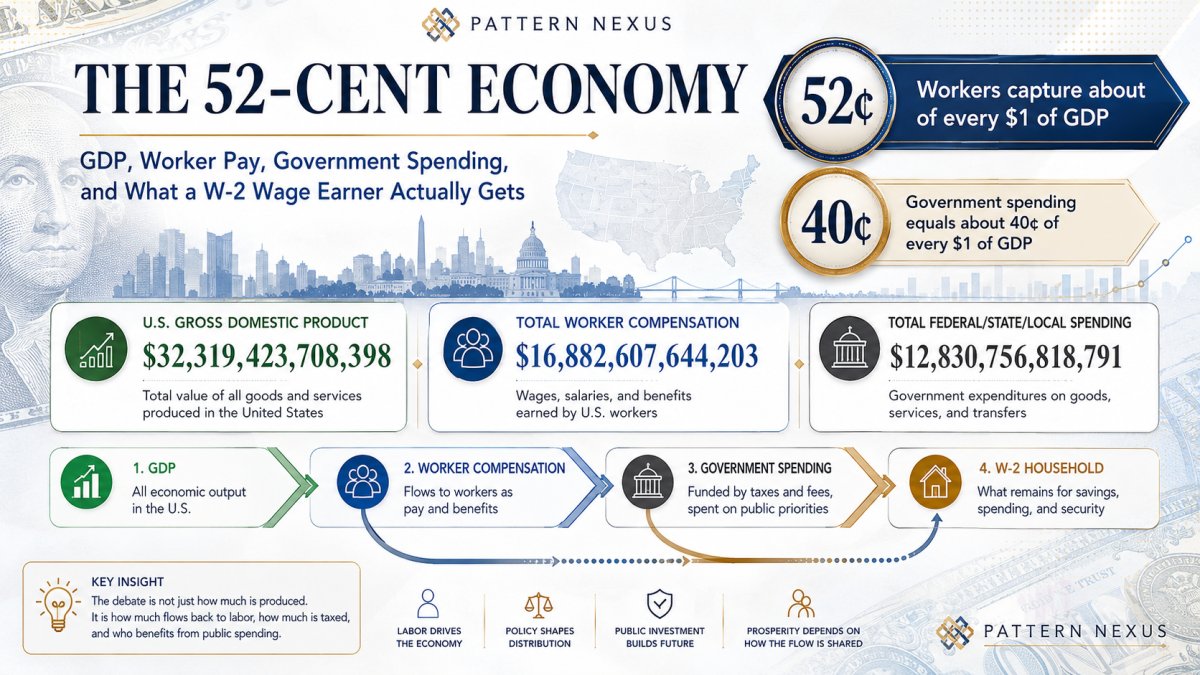
The uploaded counter shows a $32.319 trillion U.S. economy, $16.883 trillion in worker compensation, and $12.831 trillion in combined federal, state, and local spending. On its own terms, that is 52.24 cents of worker compensation and 39.70 cents of broad government spending per dollar of GDP.
The official Q1 2026 national-account benchmark is slightly lower: $31.866 trillion of nominal GDP, $16.104 trillion of employee compensation, and $13.268 trillion of wages and salaries. That translates into 50.54 cents of total employee compensation, 41.64 cents of cash wages, and 8.90 cents of employer supplements per GDP dollar. [1][2][3]
The literal claim that the people producing the economy receive only 10 cents of every output dollar is therefore not supported by aggregate national accounting. But the underlying pressure is real. The median full-time wage was about $64,220 annualized in Q1 2026, while nominal GDP divided by the 121 million full-time wage-and-salary workers produces a deliberately rough denominator of about $263,000 per worker. On that denominator, median gross wages equal about 24 cents, and an illustrative single filer retains about 20 cents after employee payroll tax and federal income tax—before state and local taxes, insurance deductions, housing, food, energy, transportation, or debt service. [12][19][20]
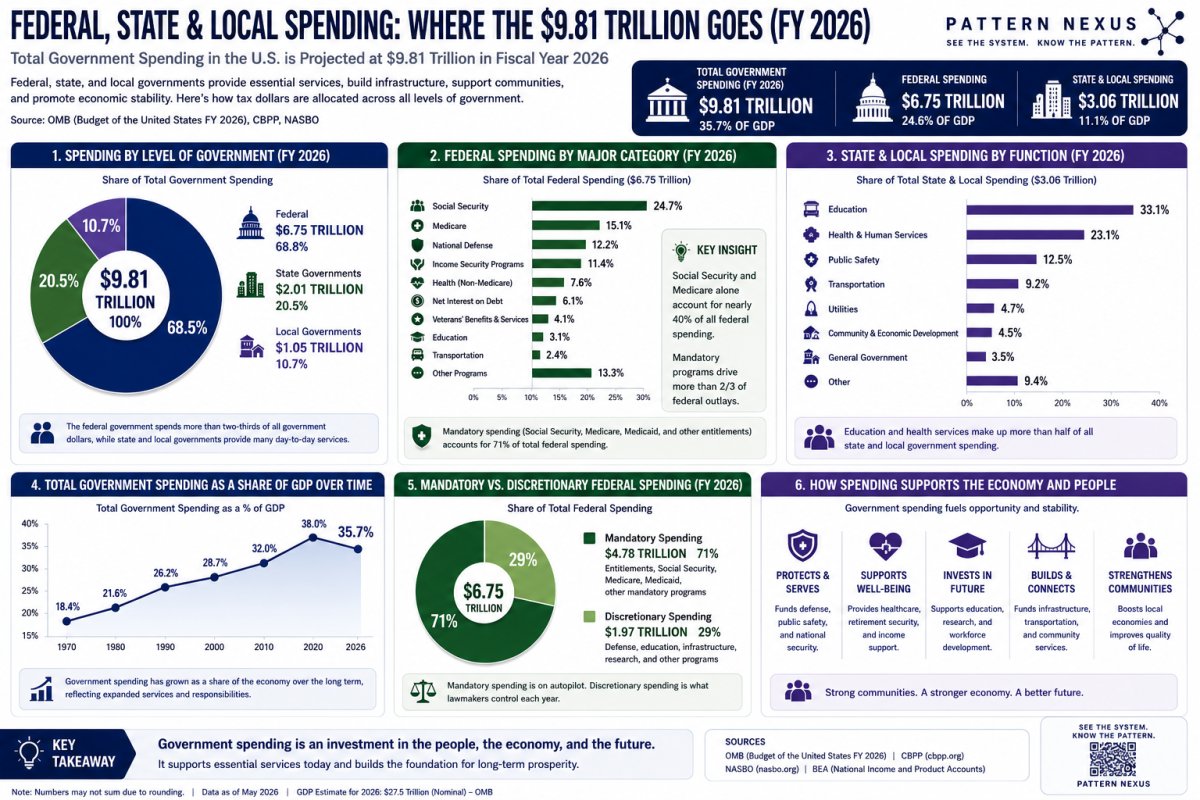
The spending claim also needs to be separated. Official direct government consumption and investment—the government component inside GDP—was about $5.417 trillion, or 17.0% of GDP. Combined government current expenditures were about $10.970 trillion, or 34.4% of GDP, because that broader measure includes transfers, interest, subsidies, and other current transactions. Government social benefits to persons alone ran at roughly $4.994 trillion. [6][7][8]
Pattern Nexus conclusion: the strongest version of the thesis is not that the lower half contributes nothing and receives the entire government. That is not what the data says. The stronger thesis is that the median W-2 worker sits inside a system where the average output number, the labor-compensation number, the paycheck number, the after-tax number, and the after-cost number are radically different layers—and the public debate keeps mixing them together.
This report does not take three live counters, subtract one from another, and call the remainder exploitation. It rebuilds the comparison through the Bureau of Economic Analysis national accounts, Bureau of Labor Statistics wage and compensation data, Congressional Budget Office federal tax-and-transfer incidence, state and local tax-incidence estimates, and current federal budget structure.
It distinguishes GDP from productivity, employee compensation from cash pay, government purchases from total government current expenditures, means-tested transfers from Social Security and Medicare, gross tax payments from net fiscal incidence, and average output from the median W-2 experience.
It also performs the claim test directly. Which parts of the “10-cent economy” survive? Which parts fail? Where does the intuition become mathematically defensible? And what denominator must be used before anyone can honestly say that a worker receives 10 cents, 20 cents, 42 cents, or 52 cents from the system?
The American worker does not occupy one economy. The worker occupies at least five nested economies.
LAYER 1 — NATIONAL OUTPUT
GDP created inside the United States

LAYER 2 — LABOR CLAIM
Wages + employer benefits + payroll contributions

LAYER 3 — CASH PAYCHECK
Wages and salaries actually paid in money

LAYER 4 — FISCAL CLAIM
Income tax + payroll tax + state/local tax + consumption tax

LAYER 5 — LIVED RETENTION
Cash remaining after taxes, benefit deductions, housing, food,
energy, transportation, health costs and debt service
The first layer can exceed $260,000 per full-time worker under a rough division. The third layer can sit near $64,000 for the median full-time worker. The fourth layer is lower. The fifth layer can feel like 10 cents on the dollar even when the aggregate labor share is five times larger.
The analytical mistake is treating those layers as the same number. The political mistake is pretending the gap between them does not matter.
- The Three Numbers and the First-Pass Math
- The Accounting Error Hidden in the Comparison
- GDP Is Output; Productivity Is Output per Hour
- The 52-Cent Labor Claim
- Total Compensation Is Not the Paycheck
- The Median W-2 Translation
- Why “Government Spending” Has Multiple Numbers
- Where the Social-Benefit Dollar Goes
- Does the Lower 50% Receive the Government?
- Who Actually Pays the Taxes?
- The Infrastructure Subsidy Question
- Testing the 10-Cent Thesis
- The Pattern Nexus Output-Dollar Model
- Debt, Deficits, and the Deferred Tax Layer
- What the Data Proves—and What It Does Not
- The Final Pattern Nexus Read
- FAQ
- Sources
The Three Numbers and the First-Pass Math
The starting image is powerful because the three counters appear to describe one machine:
- U.S. gross domestic product: $32,319,423,708,398
- Total worker compensation: $16,882,607,644,203
- Total federal, state, and local spending: $12,830,756,818,791
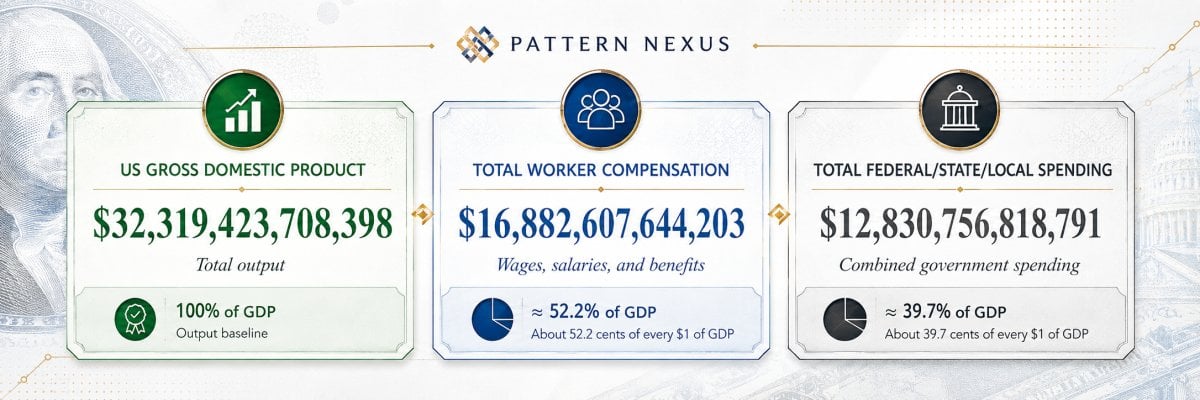
The Ratios Embedded in the Image
| Calculation | Result | First reading |
|---|---|---|
| Worker compensation ÷ GDP | 52.24% | The counter itself says labor compensation equals about 52 cents per output dollar. |
| Government spending ÷ GDP | 39.70% | The broad spending counter equals almost 40 cents per GDP dollar. |
| Government spending ÷ worker compensation | 76.00% | This ratio looks explosive, but it is not a valid “government took 76% of labor compensation” calculation. |
The first ratio immediately falsifies the literal 10-cent statement at the aggregate level. The counter says employees receive more than half of output as compensation. The third ratio is where the trap begins. Government spending is financed by personal taxes, payroll taxes, corporate taxes, production taxes, borrowing, fees, and other receipts. Government also pays wages, purchases output from private businesses, funds benefits, and pays interest. The same economic dollars appear in several institutional ledgers.
That means the $16.9 trillion and $12.8 trillion figures overlap through the circular flow. They are not competing piles placed beside GDP.
The Official Benchmark
The latest completed official quarter gives a cleaner benchmark. Q1 2026 nominal GDP was $31.866 trillion at a seasonally adjusted annual rate. Employee compensation was $16.104 trillion. Wages and salaries were $13.268 trillion. [1][2][3]
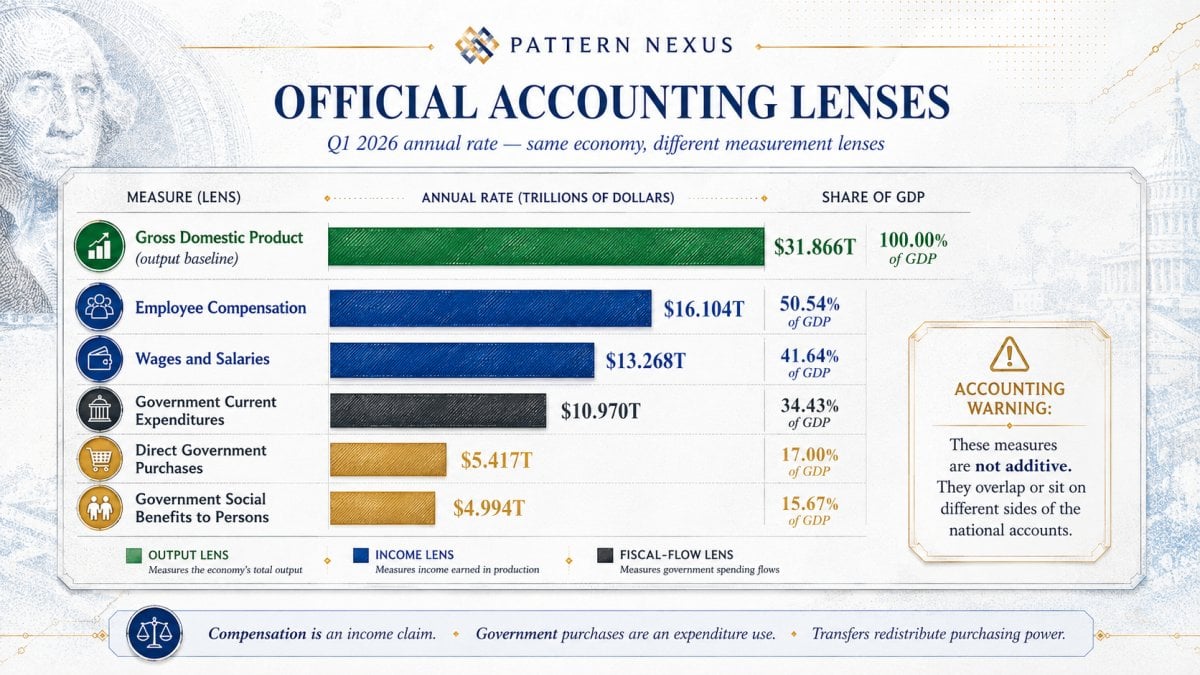
The live GDP counter was about 1.4% above the official Q1 benchmark. The live compensation counter was about 4.8% above the official benchmark. Those gaps are plausible for live extrapolations running between quarterly releases. The broad spending counter was about $1.86 trillion, or 17%, above official combined government current expenditures. That difference is too large to ignore and is why the source definition must be identified before the spending number is used as a fiscal-incidence claim.
The Accounting Error Hidden in the Comparison
GDP can be measured from the expenditure side or the income side. In principle, the two approaches describe the same production from different directions.
EXPENDITURE SIDE
GDP = Consumption + Investment + Government Purchases + Net Exports

INCOME SIDE
GDP ≈ Employee Compensation + Proprietors’ Income + Rental Income
      + Corporate Profits + Net Interest + Production Taxes
      + Depreciation + Statistical Adjustments
Worker compensation is therefore an income-side claim generated by production. Government purchases are an expenditure-side use of production. Government transfers are neither a newly produced good nor service at the instant the payment is made. They redistribute purchasing power, which may later finance consumption counted in GDP.
This distinction prevents three common errors:
- Double counting: adding compensation to GDP as though compensation is output on top of output.
- False subtraction: subtracting total government spending from worker compensation as though every public dollar was removed from employee pay.
- Transfer confusion: treating a Social Security payment, a defense contract, a schoolteacher salary, a Medicaid reimbursement, and a Treasury interest payment as the same kind of spending.
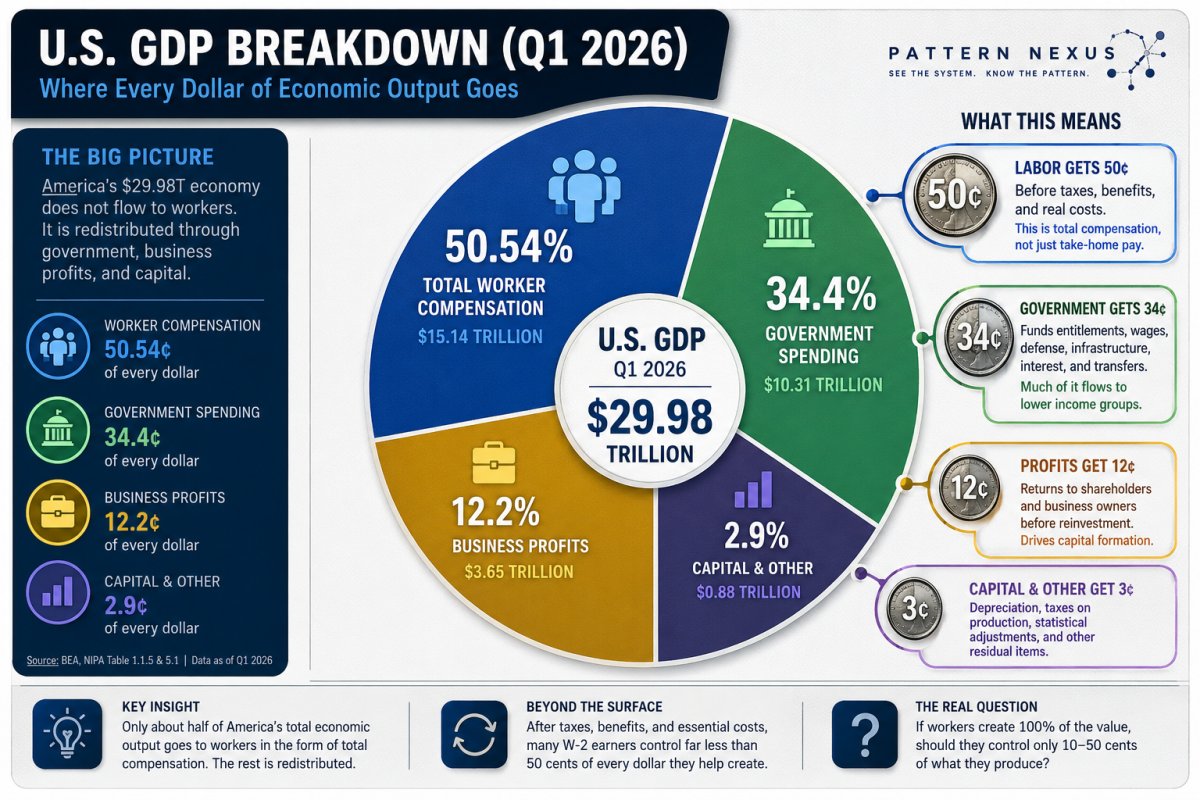
The goal is not to make the system look cleaner than it is. The goal is to locate the exact layer where the worker loses economic control. The loss may occur before wages are paid, through the split between labor and capital income. It may occur inside compensation, where benefits replace cash. It may occur through taxes. It may occur through prices, rents, medical costs, interest, and debt service after tax. Those are separate mechanisms and require separate measurements.
GDP Is Output; Productivity Is Output per Hour
The word productivity is doing too much work in the political version of this argument. GDP is the market value of final goods and services produced by labor and property located in the United States. Labor productivity is real output divided by hours worked. [1][5]
That means a $32 trillion GDP number is not “the productivity of workers” by itself. It includes the output generated through labor, capital equipment, software, intellectual property, land, organization, public infrastructure, financial structures, and the institutional environment that allows transactions to clear.
Defining the Productivity Class Without Turning It Into a Moral Label
There is a real class distinction worth studying, but it must be operational rather than moral. Pattern Nexus can define a productivity class through three separate tests:
| Ledger | Question | Why it matters |
|---|---|---|
| Market-production ledger | Does the person or business produce market-valued labor, goods, services, or capital? | This measures participation in production, not tax status. |
| Fiscal-contribution ledger | How much tax is paid directly and indirectly? | Federal income tax alone misses payroll, sales, excise, property, corporate, and embedded taxes. |
| Benefit-incidence ledger | What cash transfers, in-kind benefits, public services, and infrastructure are received? | A current recipient may be a former contributor, a child, a retiree, a disabled worker, a contractor, or a public employee. |
A warehouse worker receiving Medicaid may still be producing output. A retiree receiving Social Security may have paid payroll taxes for 45 years. A government contractor receives public money while producing a marketable deliverable. A high-income asset owner can be a major federal taxpayer while contributing little labor. A low-income renter pays property tax indirectly through rent and sales tax through consumption.
“Productive” and “net taxpayer” are related but not identical. The article becomes stronger—not weaker—when that distinction is enforced.
The 52-Cent Labor Claim
Official Q1 2026 employee compensation equaled 50.54% of GDP. The uploaded counter placed it at 52.24%. Those are close enough to establish the first major result: roughly half of gross domestic output is claimed by employees through compensation.
BEA defines compensation as wages and salaries plus supplements, including employer contributions for pensions and insurance and employer contributions for government social insurance. [4]
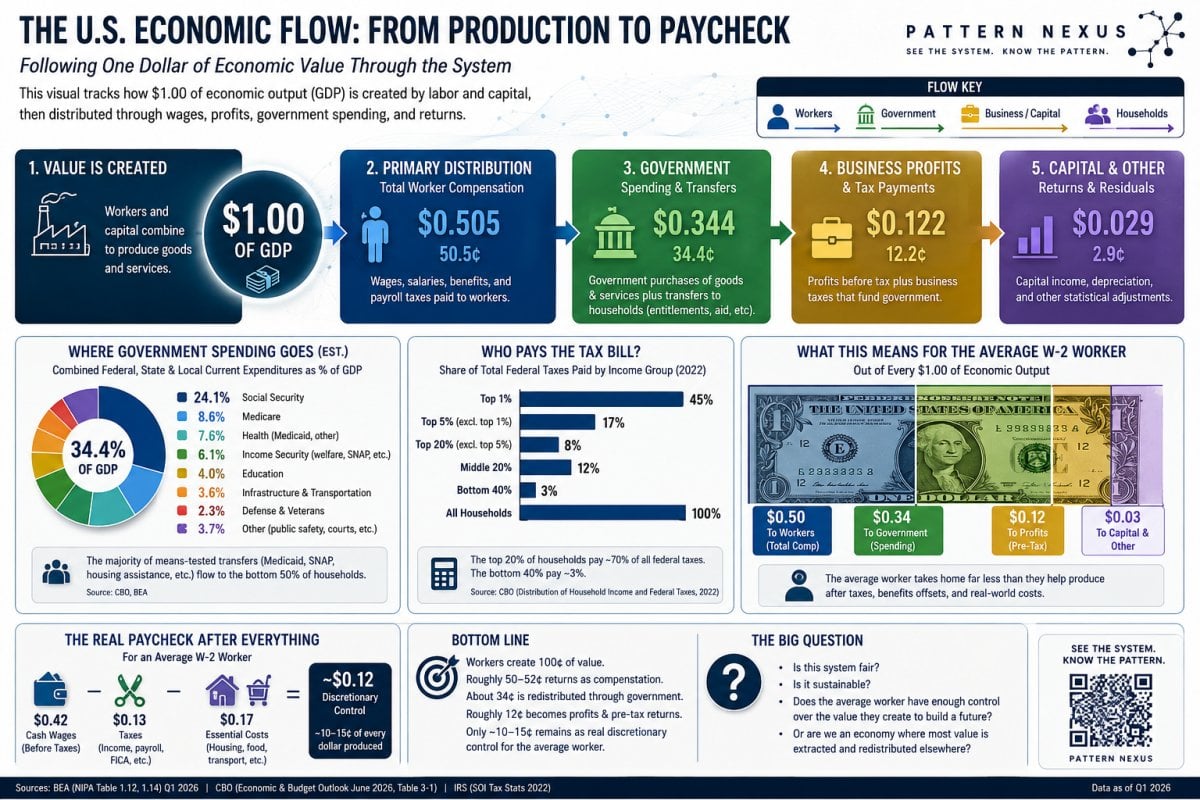
The Official $1 Output Translation
| Measure | Per $1 of GDP | Meaning |
|---|---|---|
| Total employee compensation | 50.54¢ | Cash wages plus employer-paid benefit and social-insurance supplements. |
| Cash wages and salaries | 41.64¢ | The national cash-pay claim before employee taxes and deductions. |
| Employer supplements | 8.90¢ | Pensions, insurance, and employer social-insurance contributions. |
| All other gross income claims and adjustments | 49.46¢ | Profits, proprietors’ income, rents, interest, taxes on production, depreciation, and statistical differences. |
This does not mean every worker receives 50 cents from every dollar they personally create. Compensation is unevenly distributed across occupations, industries, regions, seniority, firm structures, and executive hierarchies. The ratio is aggregate labor income divided by aggregate output.
It also does not mean the remaining 49.46 cents is corporate profit. That remainder contains multiple claims, including the replacement cost of consumed capital. A factory cannot pay its entire gross value added as cash wages and still replace machinery, service debt, pay rent, fund inventories, absorb losses, and pay production taxes.
The real labor question is therefore not whether labor receives 10% or 50% in the aggregate. It is how the aggregate labor claim is distributed—and how much of compensation is usable cash for the median worker.
Total Compensation Is Not the Paycheck
The worker sees gross wages. The employer sees total labor cost. The national accounts see compensation. Those are related, but they are not identical.
In March 2026, BLS estimated average employer compensation cost for civilian workers at $49.32 per hour: $33.72 in wages and salaries and $15.60 in benefits. Private-industry compensation averaged $46.60 per hour, with $32.60 in wages and $14.01 in benefits. [13]
| March 2026 average | Total compensation | Cash wages | Benefits | Benefit share |
|---|---|---|---|---|
| Civilian workers | $49.32/hr | $33.72/hr | $15.60/hr | 31.6% |
| Private industry | $46.60/hr | $32.60/hr | $14.01/hr | 30.1% |
| State and local government | $66.41/hr | $40.82/hr | $25.59/hr | 38.5% |
Paid leave, health insurance, retirement contributions, legally required employer payroll costs, and supplemental pay are economically valuable. But they do not all arrive as freely deployable cash. A worker cannot use an employer health-insurance premium to make the rent. A pension contribution may build long-term wealth while doing nothing for this month’s liquidity. Employer payroll contributions finance a public benefit system but still sit outside the worker’s immediate bank balance.
This is the first place where the 52-cent aggregate economy begins to feel like a much smaller number.
The Median W-2 Translation
BLS reported that the median weekly earnings of 121.0 million full-time wage-and-salary workers were $1,235 in Q1 2026. Annualized across 52 weeks, that is $64,220. [12]
Now place that worker into a simple 2026 federal tax model: single filer, standard deduction, no children, no refundable credits, no itemized deductions, and no pre-tax payroll deductions. The worker pays approximately $5,526 in federal income tax and $4,913 in employee Social Security and Medicare tax, leaving roughly $53,781 before state and local taxes. [19][20]
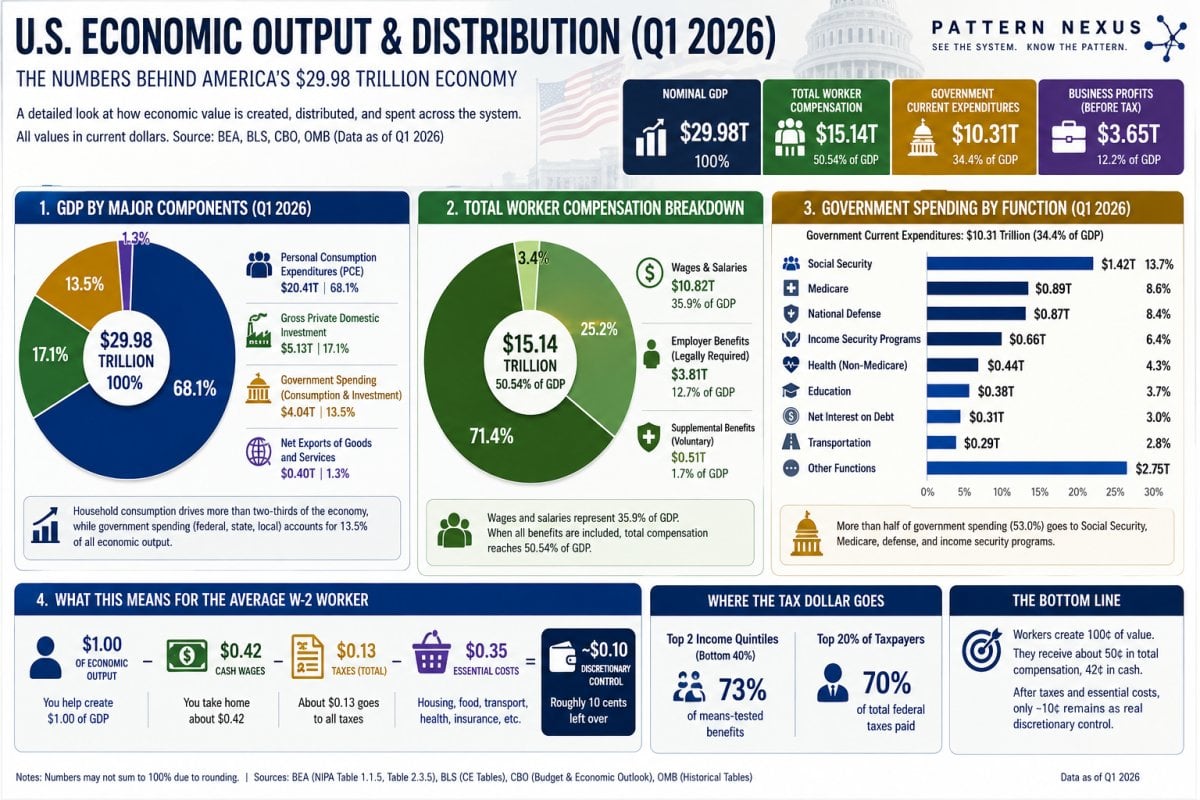
Illustrative Median Full-Time Worker
| Layer | Annual amount | Share of gross wage |
|---|---|---|
| Median gross full-time wage | $64,220 | 100.0% |
| Employee Social Security + Medicare | −$4,913 | −7.65% |
| Illustrative federal income tax | −$5,526 | −8.61% |
| After federal income tax + employee FICA | $53,781 | 83.7% |
| After illustrative 10.5% state/local effective burden | $47,038 | 73.2% |
The final row is not a tax-return forecast. State and local effective rates include sales, excise, property, and income taxes, some paid indirectly and at different times. It is included to show why federal withholding alone understates the total fiscal bite experienced by households.
The Rough Output Denominator
If nominal GDP is divided only by the 120.968 million full-time wage-and-salary workers counted by BLS, the result is about $263,000 of GDP per full-time worker. This is intentionally rough and should never be described as the value personally created by the median employee. It excludes part-time employees and the self-employed while assigning capital-generated and government-generated output to the same denominator.
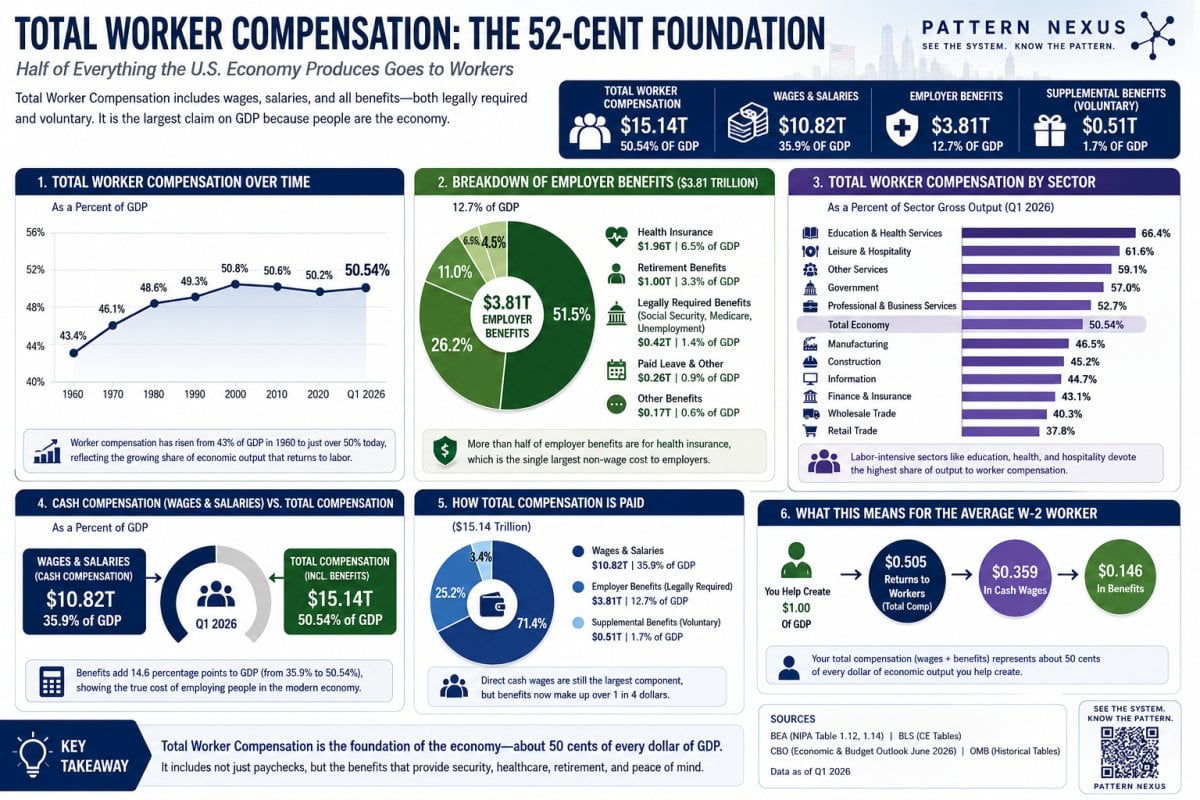
| Measure | Annualized amount | Share of rough GDP/FT-worker denominator |
|---|---|---|
| GDP per full-time wage/salary worker | $263,423 | 100.0% |
| Employee compensation per full-time worker proxy | $133,125 | 50.5% |
| Cash wages per full-time worker proxy | $109,679 | 41.6% |
| Median full-time gross wage | $64,220 | 24.4% |
| Median after federal income tax + employee FICA | $53,781 | 20.4% |
This is where the user’s intuition becomes analytically useful. The aggregate labor claim is 50.5 cents. The median worker’s gross cash wage can look like 24.4 cents against a rough system-output denominator. After federal income tax and employee payroll tax, it can look like 20.4 cents. Add state and local tax incidence and the illustrative ratio falls below 18 cents. Add essential costs, and lived discretionary control can move toward 10 cents.
But the article must label that final number correctly: it is a median household retention ratio after multiple layers, not the national labor share of GDP.
Why “Government Spending” Has Multiple Numbers
The phrase “government spending” can refer to at least four different constructions:
- Government consumption expenditures and gross investment: direct purchases of labor, goods, services, structures, equipment, and intellectual property that enter GDP.
- Government current expenditures: a broader NIPA measure that includes current consumption, transfers, interest, subsidies, and other current transactions.
- Federal unified-budget outlays: Treasury/CBO fiscal-year spending under federal budget accounting.
- Live consolidated counters: modeled federal, state, and local totals that may include gross flows, capital outlays, trust-fund transactions, or real-time extrapolations.
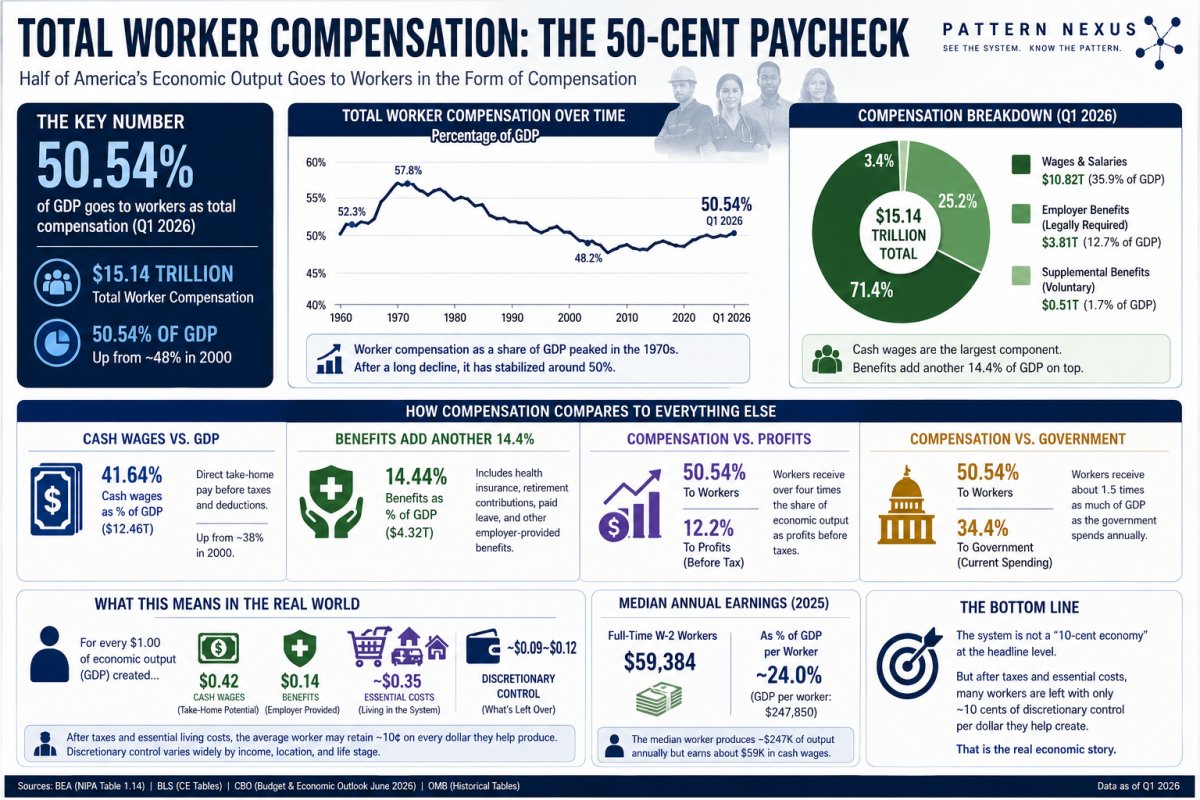
Official Q1 2026 Fiscal Lenses
| Measure | Annualized amount | Share of GDP | Use |
|---|---|---|---|
| Government consumption + gross investment | $5.417T | 17.00% | Direct public purchases counted in GDP. |
| Government current expenditures | $10.970T | 34.43% | Combined federal, state, and local current fiscal flow. |
| Government current receipts | $8.942T | 28.06% | Taxes, contributions, and other current receipts. |
| Current expenditure minus current receipts | $2.027T | 6.36% | NIPA current-account gap; not identical to the federal unified-budget deficit. |
BEA’s government account combines federal, state, and local activity while also publishing federal and state/local sectors separately. [7] The combined total is not found by blindly adding every federal and state/local headline series because intergovernmental grants and other flows must be consolidated to avoid counting the same transaction twice.
The uploaded $12.831 trillion counter equals 39.70% of its live GDP number. That is a valid ratio for that counter. It is not the same as saying government directly consumes 40% of American production. The direct-purchase share is closer to 17%.
Where the Social-Benefit Dollar Goes
Government social benefits to persons ran at a $4.994 trillion annualized rate in Q1 2026—about 15.67% of GDP and 45.5% of combined government current expenditures. [8]
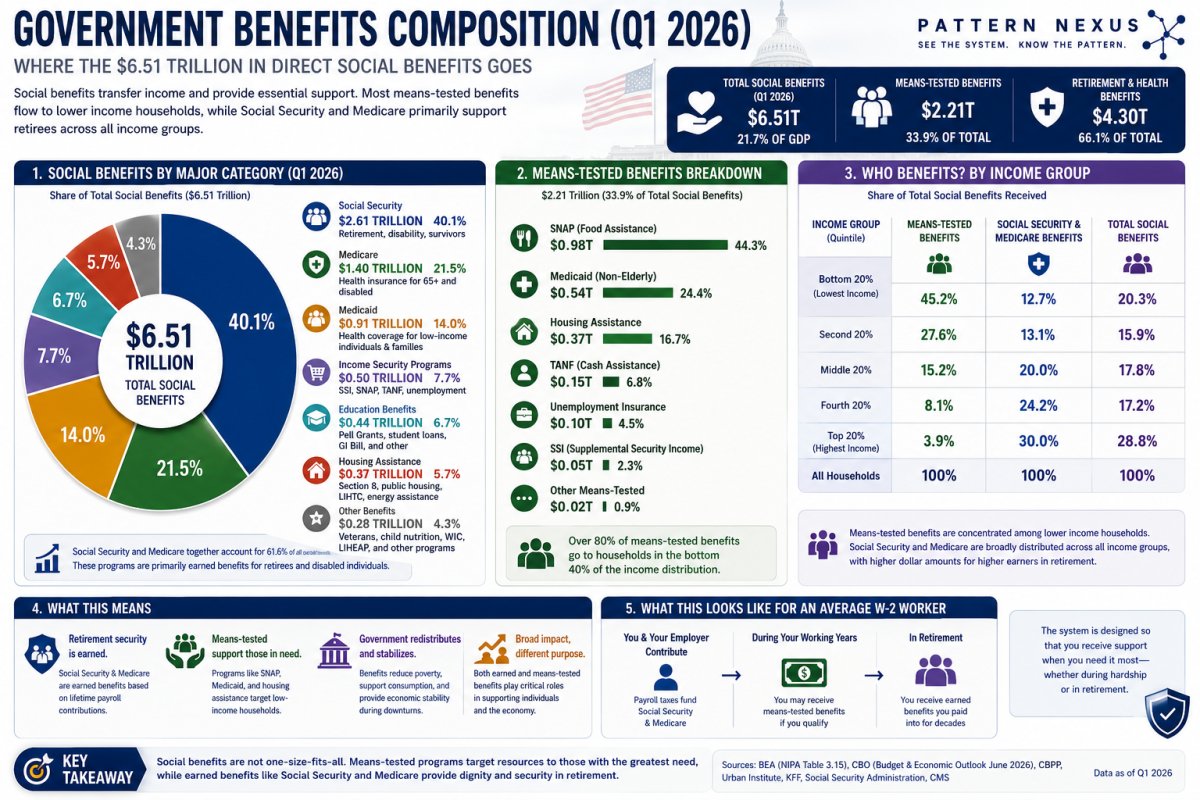
| Program group | Q1 2026 annual rate | Share of social benefits |
|---|---|---|
| Social Security | $1.630T | 32.6% |
| Medicare | $1.301T | 26.1% |
| Medicaid | $1.060T | 21.2% |
| Other social benefits | $1.002T | 20.1% |
Social Security and Medicare primarily follow age, work history, disability, and program eligibility. Medicaid is much more closely tied to low income and categorical eligibility. Other benefits include unemployment insurance, veterans’ benefits, nutrition assistance, and additional cash or in-kind programs. [9][10][11]
The Lifecycle Problem
A worker may be a net taxpayer at age 45 and a net transfer recipient at age 75. A child may receive public education and Medicaid before paying decades of payroll and income taxes. A disabled worker can shift from contributor to beneficiary because of an event rather than because of a permanent class identity.
Static annual analysis will label the same person “productive” in one year and “subsidized” in another. Lifetime fiscal incidence is the more complete question, but it requires longitudinal data, mortality assumptions, discount rates, migration, family structure, health costs, and program rules.
This does not eliminate redistribution. It identifies what kind of redistribution is occurring: cross-income, cross-age, cross-health-status, cross-region, and across time.
Does the Lower 50% Receive the Government?
The clean answer is: the lower half receives a disproportionate share of means-tested transfers, but it does not receive anything close to the entire government-spending total.
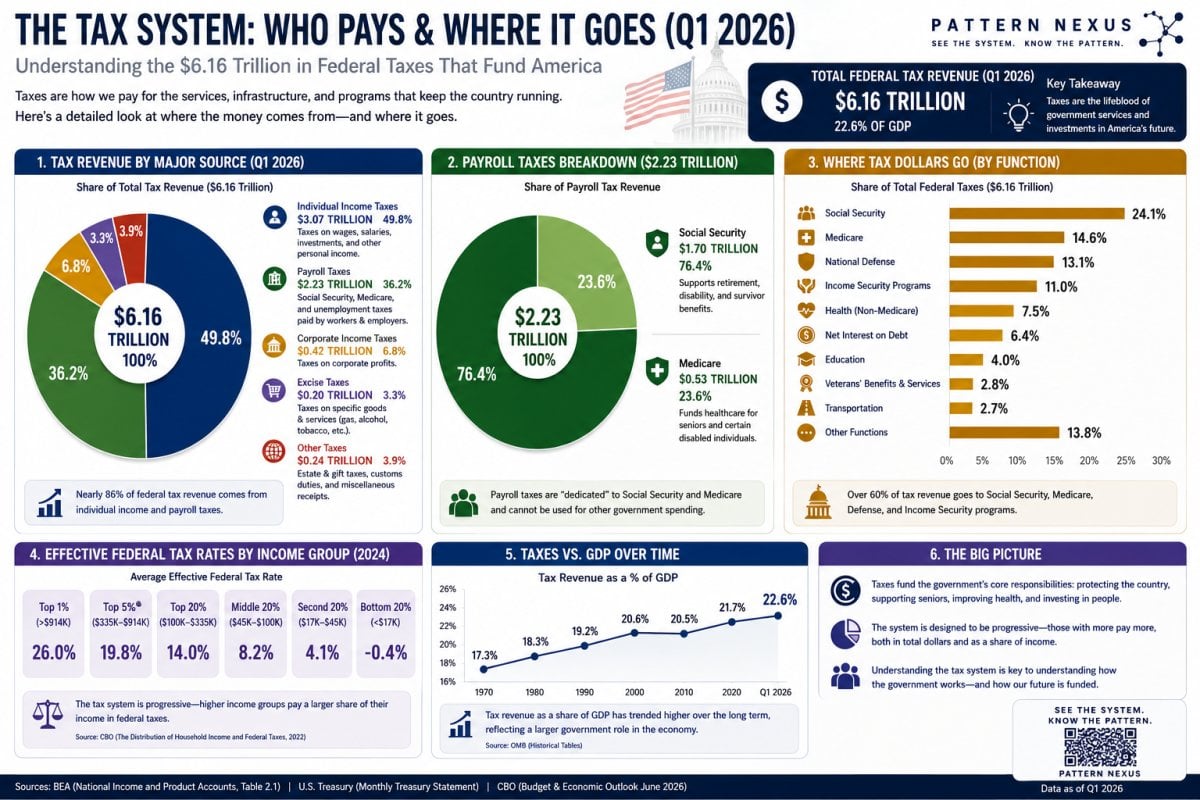
CBO states that most means-tested transfers go to households in the bottom two income quintiles. Its means-tested category includes Medicaid and CHIP, SNAP, Supplemental Security Income, housing and energy assistance, child nutrition, and related programs. [14]
That supports an important part of the user’s premise. Redistribution targeted by current income and assets is concentrated toward the bottom 40%.
But the statement cannot be expanded from “means-tested transfers” to “most of all federal, state, and local spending.” Total spending also reaches:
- Retirees through Social Security and Medicare across the lifetime-income distribution.
- Hospitals, physicians, drug companies, insurers, nursing facilities, and medical workers through health-program reimbursement.
- Defense contractors, technology firms, manufacturers, logistics companies, and military personnel.
- Teachers, police, firefighters, judges, regulators, public-health workers, engineers, and other public employees.
- Construction firms and labor through roads, bridges, water systems, transit, ports, airports, schools, and public buildings.
- Bondholders through interest payments.
- Businesses and industries through procurement, grants, tax expenditures, subsidies, research contracts, and credit support.
- Every income group through courts, public safety, currency, property-right enforcement, environmental systems, national defense, and other public goods.
Why “Zero Contribution” Fails
The lower half can have little or negative federal individual income tax liability after refundable credits while still paying employee payroll tax, employer payroll tax through compensation incidence, sales and excise taxes, property taxes directly or through rent, utility taxes, vehicle taxes, fees, and embedded business taxes.
They also supply labor and consumption demand. A worker can be a net recipient under a full fiscal-incidence model while still being economically productive. Those are not contradictory statements.
The defensible criticism is not “zero contribution.” It is that some households receive public benefits and services greater than their measured tax burden, while other households are persistent net fiscal contributors. The size of those groups depends on whether the calculation is annual or lifetime, whether public goods are allocated, and whether employer and business taxes are assigned to workers, owners, or consumers.
Who Actually Pays the Taxes?
At the federal level, the system is strongly progressive in dollar share. CBO estimates that the top income quintile paid 70% of federal taxes in 2022, up from 55% in 1979. The top 1% paid 27% of federal taxes. [14]
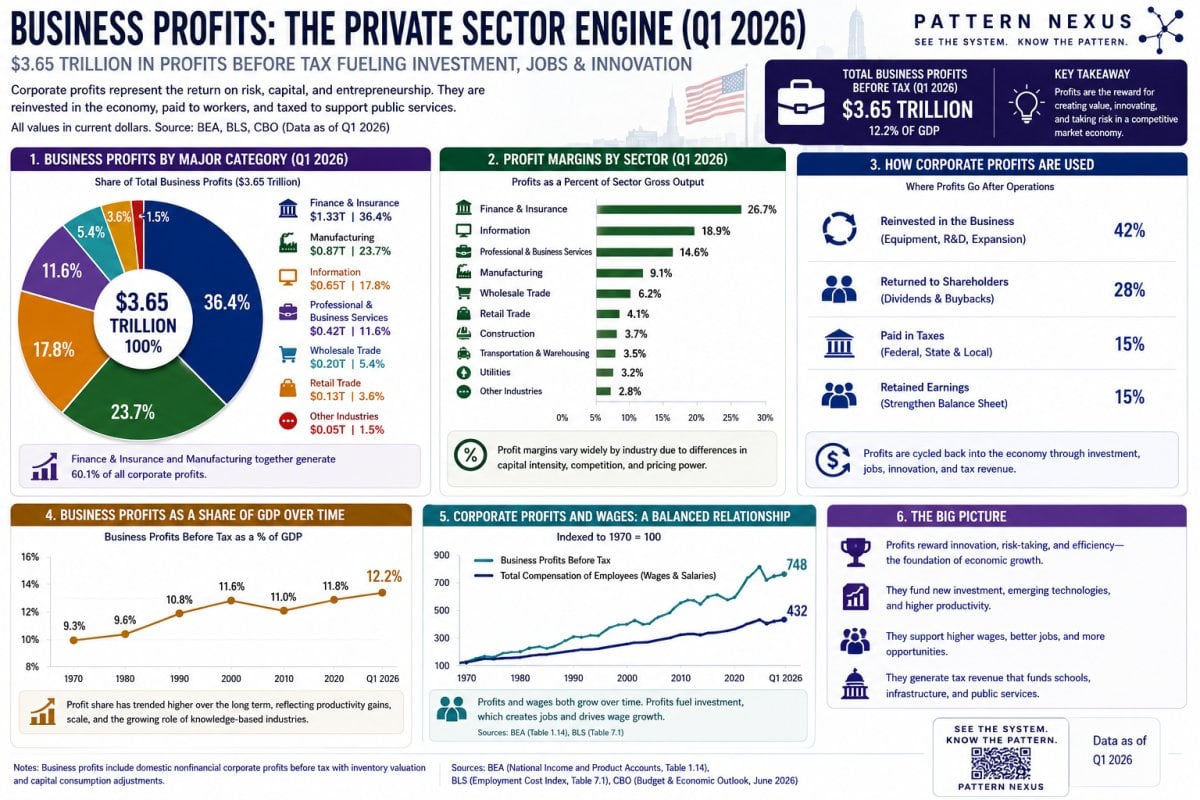
CBO’s federal tax measure includes individual income tax, payroll tax, corporate income tax, and excise tax. The average federal tax rate across all households was 20.6% in 2022. Average individual income-tax rates ranged from negative 10% in the lowest quintile—because refundable credits exceeded liability—to 17% in the highest quintile. [14]
The State and Local Counterweight
State and local systems frequently reverse part of the federal pattern. ITEP’s national microsimulation estimates an effective state and local tax rate of 11.4% for the lowest-income 20%, 10.5% for the middle 20%, and 7.2% for the top 1%. Sales and excise taxes are the most regressive component. [15]
Both Statements Can Be True
- The top quintile pays the overwhelming majority of federal taxes in dollars.
- Lower-income households can pay a larger percentage of income in state and local taxes.
- Payroll tax can be more burdensome relative to wages than federal income tax for many workers.
- Corporate and employer-side taxes ultimately land partly on owners, workers, and consumers through incidence channels that are debated and difficult to observe directly.
The phrase “the productivity class is taxed at a higher percentage rate” is broadly correct for federal average taxation across income groups. It is not universally correct once every state/local tax and every point in the income distribution is included.
The Infrastructure Subsidy Question
The user’s infrastructure argument is more sophisticated than it first appears. Roads, water systems, courts, ports, grids, schools, and public safety create a platform on which private production operates. A household that pays little tax can still use that platform. The difference between tax contribution and public-service benefit is a subsidy in the broad economic sense.
But measuring that subsidy requires an allocation rule.
NET FISCAL POSITION
= Direct and indirect taxes paid
− Cash transfers received
− Allocated value of in-kind benefits
− Allocated value of public services and infrastructure

Alternative sign convention:
Net benefit = transfers + services + infrastructure − taxes
The result changes dramatically depending on how public goods are assigned:
- Equal per person: every resident receives the same value from national defense, courts, or a road system.
- Usage based: heavy drivers, freight firms, homeowners, or businesses receive more infrastructure value.
- Income based: property-right enforcement and financial stability may be worth more to households with more assets.
- Location based: residents near a transit line, school district, port, or flood-control project receive more direct value.
- Production based: infrastructure is allocated according to the output it enables.
A commercial freight network may look like a subsidy to consumers under equal allocation, but a subsidy to business under production allocation. A public school is a transfer to the family, an investment in future labor supply, a support to employers, and a neighborhood property-value input at the same time.
The Correct Pattern Nexus Framing
The lower half does not “build none of it.” Lower-income workers physically build, maintain, staff, clean, drive, teach, repair, and operate large portions of the public and private system. But many households in the lower distribution are likely net fiscal beneficiaries in a given year after cash and in-kind transfers are included. Upper-income households are more likely to be large net federal contributors.
That is a fiscal-incidence claim. It should not be converted into a claim of zero production.
Testing the 10-Cent Thesis
The 10-cent thesis can mean at least five different things. Only one of them is clearly false.
| Possible meaning | Measured result | Verdict |
|---|---|---|
| All employee compensation as a share of GDP | 50.54¢ | The literal 10-cent aggregate claim is false. |
| Cash wages and salaries as a share of GDP | 41.64¢ | Still far above 10 cents. |
| Median full-time gross wage against rough GDP/full-time-worker denominator | 24.38¢ | A defensible illustration of median-versus-aggregate divergence, with major denominator caveats. |
| Median wage after federal income tax and employee FICA against same denominator | 20.42¢ | The worker’s liquid claim falls toward 20 cents. |
| After illustrative federal, payroll, and state/local tax incidence | 17.86¢ | Below 18 cents before essential costs. |
| Discretionary cash after housing, food, health, transport, energy, and debt | Household-specific | Can plausibly fall near or below 10 cents, but this is a cost-of-living retention claim—not labor share. |
The Strongest Defensible Version
That formulation preserves the force of the argument without making a national-account claim that the data immediately disproves.
The Pattern Nexus Output-Dollar Model
A useful framework requires multiple ledgers rather than one pie chart.
Ledger One: Production-Income Split
$1.00 OF GDP
≈ $0.416 cash wages and salaries
+ $0.089 employer benefit/social-insurance supplements
+ $0.495 profits, proprietors’ income, rents, interest,
         production taxes, depreciation and adjustments
This is the cleanest answer to “where does the output dollar become income?”
Ledger Two: Government’s Direct Production Claim
$1.00 OF GDP
≈ $0.170 direct government consumption and gross investment
This amount is already inside GDP. It buys public labor, services, equipment, structures, defense, education, public safety, and other government output.
Ledger Three: Government’s Current Fiscal Circulation
$1.00 OF GDP
≈ $0.344 combined government current expenditures
≈ $0.281 combined government current receipts
≈ $0.064 current-account financing gap
This ledger circulates claims on output. It cannot be stacked on top of the production-income split as though the sum must equal $1.
Ledger Four: Median W-2 Cash Capture
ROUGH SYSTEM DENOMINATOR: GDP ÷ full-time wage/salary workers
≈ $263,353 per worker

Median full-time gross wage ≈ $64,220  → 24.4%
After federal income tax + employee FICA ≈ $53,781 → 20.4%
After illustrative state/local incidence ≈ $47,038 → 17.9%
The first three ledgers are macro accounting. The fourth is a deliberately simplified incidence bridge. Mixing them creates slogans. Separating them creates analysis.
Debt, Deficits, and the Deferred Tax Layer
The combined-government current-expenditure rate exceeded current receipts by roughly $2.03 trillion annualized in Q1 2026, equal to about 6.36% of GDP. That NIPA current-account gap is not identical to the federal unified-budget deficit, but both reveal the same structural reality: part of the public-spending system is financed outside current revenue.
CBO reports that federal mandatory outlays totaled $4.2 trillion in fiscal year 2025, with more than half going to Social Security and Medicare. Discretionary outlays were about $1.9 trillion. The federal deficit was about $1.8 trillion. [16][17][18]
Borrowing Is a Distribution Decision
Debt financing changes who pays and when:
- Current taxpayers avoid the full immediate tax cost.
- Bondholders receive an interest-bearing asset.
- Future taxpayers inherit debt-service and rollover requirements.
- Inflation can redistribute from holders of nominal claims toward debtors.
- Asset owners can benefit if deficit spending supports nominal income, collateral, and asset prices.
- Recipients receive the current transfer or service before the financing burden is fully resolved.
This is why a high-income worker can feel taxed twice: once through current tax payments and again through inflation, interest-rate pressure, or future fiscal adjustment. It is also why a low-income household can receive current support without the current budget showing the full cost as a contemporaneous tax.
The fiscal system is not only redistribution across income. It is redistribution across time.
What the Data Proves—and What It Does Not
What Is Strongly Supported
- Employee compensation equals roughly half of U.S. GDP, not 10%.
- Cash wages equal materially less than total compensation because employer benefits and social-insurance contributions are included in compensation.
- The median full-time worker earns far less than average GDP, compensation, or wages divided by the full-time workforce.
- Direct government purchases and total government current expenditures are different measures and produce radically different spending-to-GDP ratios.
- Social benefits are dominated by Social Security, Medicare, and Medicaid rather than one narrow cash-welfare category.
- Most means-tested transfers go to lower-income households.
- The top income quintile pays most federal taxes in dollar-share terms.
- State and local tax systems can impose higher effective rates on lower-income households than on the top 1%.
- The median worker’s after-tax and after-cost command over resources can be far below the aggregate labor share.
What Is Not Proven
- The data does not prove that the lower 50% contributes nothing.
- The data does not prove that the lower 50% receives all or most total government spending.
- The data does not permit adding compensation and government expenditures into one distribution pie.
- The rough GDP-per-full-time-worker denominator does not measure each worker’s marginal product.
- An annual net-recipient status does not establish a lifetime net-recipient status.
- The 10-cent figure is not a national labor-share statistic.
- Public infrastructure cannot be allocated by income group without an explicit benefit-incidence model.
- Federal tax progressivity does not prove that the full federal-state-local system is progressive at every income level.
The Final Pattern Nexus Read
The original image captures the architecture of the American economy better than it first appears. A $32 trillion output machine sits beside a $17 trillion compensation machine and a nearly $13 trillion public-spending machine. The instinct is to ask who is actually carrying whom.
The first answer is uncomfortable for both sides of the normal political argument.
The worker is not receiving only 10% of GDP in the aggregate. Labor receives about half. But the average worker does not receive the average labor share. A large part of compensation is not cash. A large part of cash wages sits above the median. Taxes reduce the remainder. Housing, health care, transportation, energy, food, and debt service reduce it again. The worker lives at the final liquidity layer, not inside the $16 trillion compensation headline.
The lower half is not making zero contribution. It works, consumes, pays payroll and consumption taxes, pays property tax directly or through rent, and physically operates large portions of the system. But lower-income households do receive a disproportionate share of means-tested transfers, and many are annual net fiscal beneficiaries once in-kind benefits are counted.
The upper distribution does not simply “keep everything.” It pays a dominant share of federal taxes. But high-income households also own a disproportionate share of the assets, firms, contracts, collateral, and financial claims that benefit from the same public system, deficit spending, monetary support, legal enforcement, and infrastructure.
Government spending does not flow in one direction. It moves downward through means-tested programs, sideways through retirement and health insurance, upward through interest and asset support, outward through contractors and public payrolls, and forward through debt placed on future taxpayers.
That is the real Pattern Nexus conclusion:
The system does not hide the answer in one number. It hides it by forcing the public to compare five different numbers as though they were one.
FAQ
Does worker compensation equal what employees take home?
No. Employee compensation includes cash wages and salaries plus employer-paid supplements such as health insurance, retirement contributions, and employer social-insurance contributions. Take-home pay is lower after employee taxes and payroll deductions.
Does government spending equal 40% of GDP?
It depends on the definition. The uploaded broad counter is about 39.7% of its GDP counter. Official combined government current expenditures were about 34.4% of Q1 2026 GDP. Direct government consumption and investment counted in GDP was about 17.0%.
Do transfers count as GDP?
Not at the moment the transfer is paid, because the payment itself is not payment for newly produced output. When the recipient spends the transfer on final goods and services, that consumption can enter GDP.
Does the lower 50% receive most government spending?
Most means-tested transfers go to the bottom two quintiles, but total government spending includes Social Security, Medicare, defense, public payroll, procurement, infrastructure, interest, courts, education, and many other categories. The broad claim is not supported.
Why can the median worker feel like only 10 cents comes back?
Because the worker compares personal after-tax, after-cost cash to aggregate output. That comparison mixes mean output, median wages, noncash benefits, taxes, and essential costs. The result can approach 10% for some households, but it is not the aggregate labor share.
Who pays most federal taxes?
CBO estimated that the top income quintile paid 70% of federal taxes in 2022, including 27% paid by the top 1%.
Are lower-income households untaxed?
No. Refundable credits can make federal individual income tax negative for some households, but payroll, sales, excise, property, and other taxes remain. State and local systems are often regressive as a percentage of income.
Sources
- Federal Reserve Bank of St. Louis / BEA — Gross Domestic Product
- Federal Reserve Bank of St. Louis / BEA — Compensation of Employees, Paid
- Federal Reserve Bank of St. Louis / BEA — Wages and Salaries Paid
- Bureau of Economic Analysis — Compensation of Employees Definition
- Bureau of Labor Statistics — What Is Labor Productivity?
- Federal Reserve Bank of St. Louis / BEA — Government Consumption Expenditures and Gross Investment
- Bureau of Economic Analysis — Government Receipts and Expenditures
- Federal Reserve Bank of St. Louis / BEA — Government Social Benefits to Persons
- Federal Reserve Bank of St. Louis / BEA — Social Security Benefits
- Federal Reserve Bank of St. Louis / BEA — Medicare Benefits
- Federal Reserve Bank of St. Louis / BEA — Medicaid Benefits
- Bureau of Labor Statistics — Usual Weekly Earnings, First Quarter 2026
- Bureau of Labor Statistics — Employer Costs for Employee Compensation, March 2026
- Congressional Budget Office — The Distribution of Household Income, 2022
- Institute on Taxation and Economic Policy — Who Pays? 7th Edition
- Congressional Budget Office — Mandatory Spending in Fiscal Year 2025
- Congressional Budget Office — Discretionary Spending in Fiscal Year 2025
- Congressional Budget Office — The Federal Budget in Fiscal Year 2025
- Internal Revenue Service — Tax Year 2026 Inflation Adjustments
- Internal Revenue Service — Publication 15 (2026), Employer’s Tax Guide
What's Your Reaction?
 Like
0
Like
0
 Dislike
0
Dislike
0
 Love
0
Love
0
 Funny
0
Funny
0
 Wow
0
Wow
0
 Sad
0
Sad
0
 Angry
0
Angry
0

Founder of Pattern Nexus. I research markets, macro, geopolitics, AI, history, ancient systems, and the patterns most people overlook. I’m also building Market Radar, a trading scanner designed to read pressure, risk, confirmation, and setup quality before chasing a move. Pattern Nexus is where I connect the dots between data, history, technology, and the bigger system playing out around us.




Comments (0)