
The Debt Genome: Which Presidents’ Policies Built America’s Debt—and Which Actually Paid Back?
A 70-year counterfactual audit of presidential policy, inherited law, tax cuts, entitlements, crisis packages, and the compounding interest tail. The analysis separates who originated a policy from who expanded, extended, financed, or weakened it—and distinguishes Treasury cost from social return.
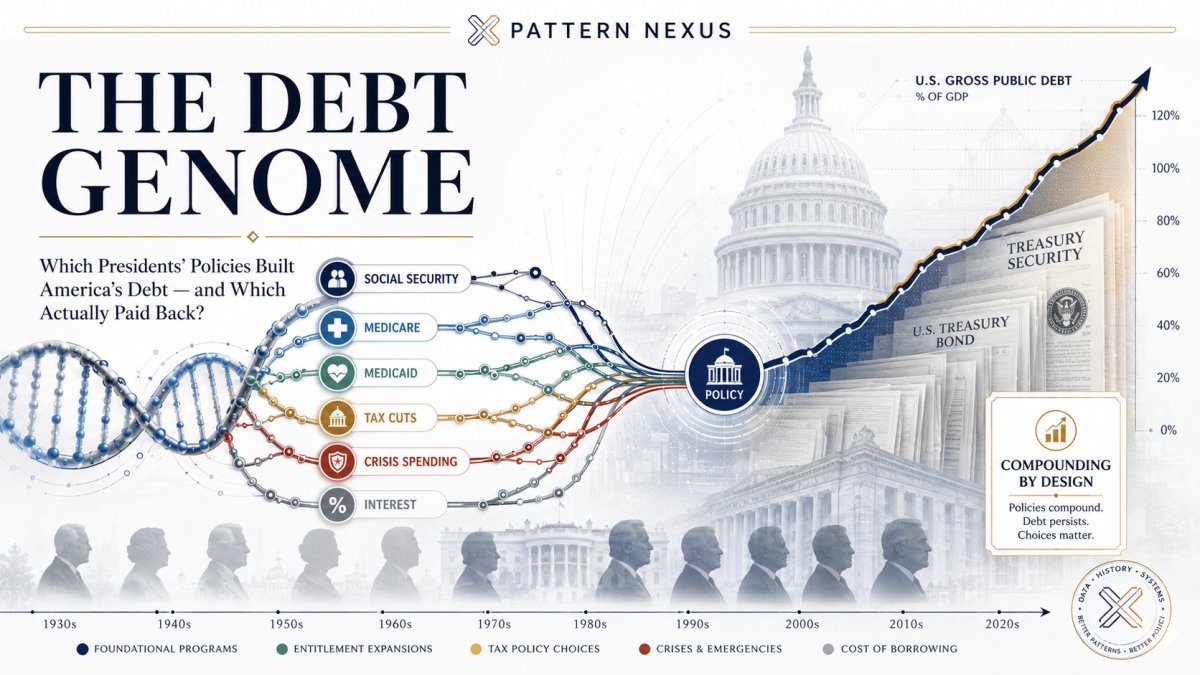
The Debt Genome: Which Presidents’ Policies Built America’s Debt—and Which Actually Paid Back?
A 70-year counterfactual audit of presidential policy, inherited law, permanent tax reductions, automatic benefit growth, crisis packages, economic feedback, and the compounding interest tail.
The answer changes by debt mechanism
The central answer is not one president. America’s debt is the accumulated result of a legal operating system built across generations. Different presidents dominate different categories.
- Greatest structural health-entitlement legacy: Lyndon B. Johnson’s 1965 Medicare and Medicaid architecture, followed by decades of expansions, demographic aging, medical-cost growth, and payment changes.
- Greatest multi-president automatic-benefit lineage: Social Security—originating under Franklin D. Roosevelt, expanded repeatedly, indexed automatically after the Nixon-era reforms, and financially restructured under Reagan and the 1983 bipartisan agreement.
- Largest identifiable policy family since 2001: the Bush tax cuts, their Obama-era extensions and permanent modifications, and the Trump-era Tax Cuts and Jobs Act. One integrated estimate places those five major tax laws at nearly $8.4 trillion through 2023.[2]
- Largest comparable modern presidential approval total: Trump’s first term, at an estimated $8.4 trillion of ten-year borrowing approved, or $4.8 trillion excluding major COVID relief. That is an enacted-policy measure, not simply the amount debt rose while he occupied the White House.[12]
- Largest recent single structural law in the current baseline: the 2025 reconciliation act, which CBO estimates adds $4.7 trillion to deficits over 2026–2035 after economic and interest effects, partly offset at the broader administration-policy layer by tariffs.[1]
- Biggest misconception: Obama’s Affordable Care Act was not the largest debt driver. CBO and JCT originally estimated the law would reduce deficits by $124 billion over 2010–2019 and by roughly 0.5 percent of GDP in the following decade.[3]
Why This Is Premium
Most “debt by president” graphics commit the same analytical error: they assign every dollar borrowed between inauguration and departure to the person sitting in the Oval Office. That mixes inherited law, recession-driven revenue losses, automatic stabilizers, emergency legislation, monetary conditions, congressional appropriations, trust-fund accounting, and interest on debt accumulated decades earlier.
This analysis does not ask who happened to be president when Treasury issued the debt. It asks a harder question:
Which law changed the future stream of federal spending or revenue, who originated it, who extended or expanded it, what did it do to the economy, and how much additional debt service followed?
The answer requires a policy genealogy rather than a partisan scoreboard.
Executive Thesis
Federal debt is not a pile of presidential receipts. It is a compounding network of legal promises and revenue decisions. A president can originate a policy, but Congress writes and funds it; later presidents extend it; courts alter it; agencies implement it; recessions change enrollment and tax collections; and Treasury refinances the resulting debt at whatever interest rates the market demands.
The strongest defensible conclusion is therefore a four-part verdict:
- Johnson has the strongest claim to the largest structural spending legacy because Medicare and Medicaid established permanent federal health-benefit architecture whose costs have grown with aging, utilization, prices, medical technology, and later eligibility expansions.
- Bush has the strongest claim to the most consequential modern policy lineage because the 2001 and 2003 tax cuts, war-era spending, Medicare Part D, and crisis legislation materially altered the fiscal path—and because most of the tax cuts were later extended rather than allowed to expire.
- Trump’s first term has the largest comparable modern total of newly approved ten-year borrowing in the available integrated presidential comparison, driven by the 2017 tax law, spending increases, and pandemic relief. Trump’s second-term 2025 reconciliation law also creates a large new structural deficit stream.
- Obama does not rank first once policies are separated correctly. His record includes substantial temporary recession response and the costly 2010 and 2013 continuation of much of the Bush tax-cut architecture. But the ACA itself was scored as deficit-reducing, and the 2011 Budget Control Act and several health-payment changes reduced projected spending.
The deeper Pattern Nexus read is that the largest debt machine is no longer one program or one president. It is the interaction of permanent primary deficits, aging-linked benefits, a revenue base repeatedly reduced below promised spending, and the interest charged on the entire accumulated stock.
1. The Answer Before the Model
If the question is, “Which president caused the most debt?” there is no single intellectually honest answer. The answer changes depending on which debt mechanism is being measured.
| Question | Strongest Candidate | Why | Confidence |
|---|---|---|---|
| Largest structural program architecture | Lyndon B. Johnson, plus later Congresses and presidents | Medicare and Medicaid became permanent health-financing systems with automatic long-run growth. | High on direction; low on an exact lifetime dollar assignment |
| Largest automatic-benefit lineage | FDR–Nixon–Reagan–later Congresses | Social Security was created, expanded, automatically indexed, and repeatedly refinanced across administrations. | High on lineage; impossible to assign to one president |
| Largest identifiable policy family since 2001 | Bush tax cuts and later extensions, plus TCJA | Five major tax laws cost nearly $8.4 trillion through 2023 in an integrated estimate. | Medium-high; baseline assumptions matter |
| Largest comparable modern presidential approved borrowing | Trump I | Estimated $8.4 trillion of ten-year borrowing approved, including COVID legislation. | Medium; depends on the policy inventory and scoring conventions |
| Largest recent single law in the 2026 baseline | Trump II / 2025 reconciliation act | CBO estimates $4.7 trillion of added deficits over 2026–2035 including economic and interest effects. | High for the scoring window; future implementation can change it |
| Most overstated debt culprit | Obama’s ACA | The enacted package paired coverage expansion with taxes and Medicare savings and was scored as reducing deficits. | High for the law as enacted; retrospective isolation remains difficult |
| Strongest clear deficit-reduction presidencies or laws | George H.W. Bush’s 1990 agreement, Clinton’s 1993 law, ACA as enacted | Each included explicit revenue or spending changes scored to reduce projected deficits. | High on official scores; broader economic causation is shared |
This is not an attempt to spread blame evenly. It is an attempt to identify the actual system. Some presidents clearly added more enacted borrowing than others. But the largest current expenses often originate in programs created long ago and repeatedly modified afterward, while a later president can inherit most of the cash cost without having created the formula.
2. Why “Debt by President” Charts Are Usually Wrong
Debt growth during a term is not policy causation
Debt can rise under a president because of laws enacted before that president took office. Social Security benefits, Medicare claims, veterans’ benefits, prior tax cuts, interest on old debt, and prior-year appropriations do not reset on Inauguration Day. At the same time, legislation enacted near the end of a term may impose most of its cost on future administrations.
The baseline changes the answer
A tax law can be scored as enormously expensive relative to “current law” if current law assumes a temporary tax cut expires. The same law can look much smaller relative to a “current policy” baseline that assumes Congress would continue the tax cut anyway. Neither baseline is neutral. One measures the legal change; the other measures deviation from expected political behavior.
Congress owns the statute
Presidents propose, negotiate, sign, veto, and administer. Congress legislates and appropriates. A policy score should therefore identify both presidential lineage and congressional support. This matters because much of the post-2001 debt accumulation came from bipartisan legislation, including military appropriations, emergency packages, tax-cut extensions, and pandemic relief.[2]
Macroeconomic conditions alter both sides of the ledger
A recession reduces income and payroll-tax receipts while raising unemployment benefits, Medicaid participation, food assistance, and other automatic stabilizers. Those costs are not all newly enacted policy. Likewise, inflation can raise nominal tax collections and nominal GDP, making debt-to-GDP ratios look better even while the dollar debt rises.
Interest is pooled, not labeled by law
Treasury does not issue a bond stamped “Bush tax cut,” “Medicare,” or “COVID relief.” It finances the government’s combined cash shortfall. Any policy-level interest attribution is therefore synthetic: the analyst must construct a counterfactual debt path without that law and calculate the difference in debt service over time.
Correct unit of analysis: a policy node with an origin, extensions, expansions, repeals, primary deficit effects, macroeconomic feedback, and an interest tail—not a president’s inauguration-to-inauguration debt total.
3. The Compounding Debt Engine
The federal debt stock evolves through a simple accounting identity:
Debt this year = last year’s debt + the primary deficit + net interest.
In simplified form:
Dt = Dt−1(1 + rt) + Primary Deficitt
A law that creates a one-time $1 trillion deficit is expensive. A law that creates a permanent $100 billion annual deficit can eventually be much more expensive because every annual shortfall remains in the debt stock and attracts interest.
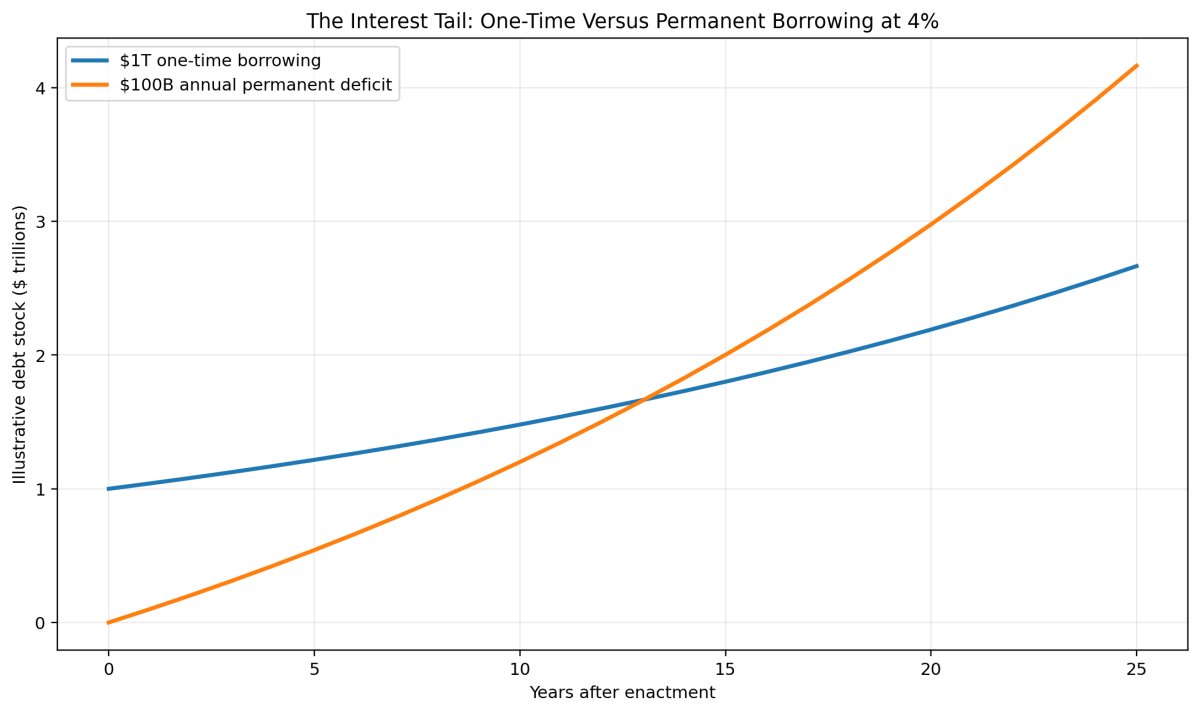
This is why the crucial distinction is not merely “large” versus “small.” It is temporary versus permanent. A recession package can be larger at enactment, but a permanent tax reduction or open-ended benefit formula can outrun it over a generation.
The federal government does not literally compound each law in a separate account
The illustration above is the analytical counterfactual. Actual federal debt is continually refinanced across maturities. The proper historical model would apply the Treasury’s marginal financing cost in each year, account for inflation and GDP growth, incorporate any effects on revenue and automatic spending, and calculate how the law changed the debt stock relative to a no-law path.
The interest-growth differential matters
Debt-to-GDP can stabilize even with some deficit if nominal economic growth exceeds the effective interest rate and the primary deficit is controlled. It becomes much harder when the interest rate approaches or exceeds growth while the government continues running large primary deficits. This is the transition now visible in the federal outlook: interest has stopped being a secondary line item and is becoming an independent expenditure engine.
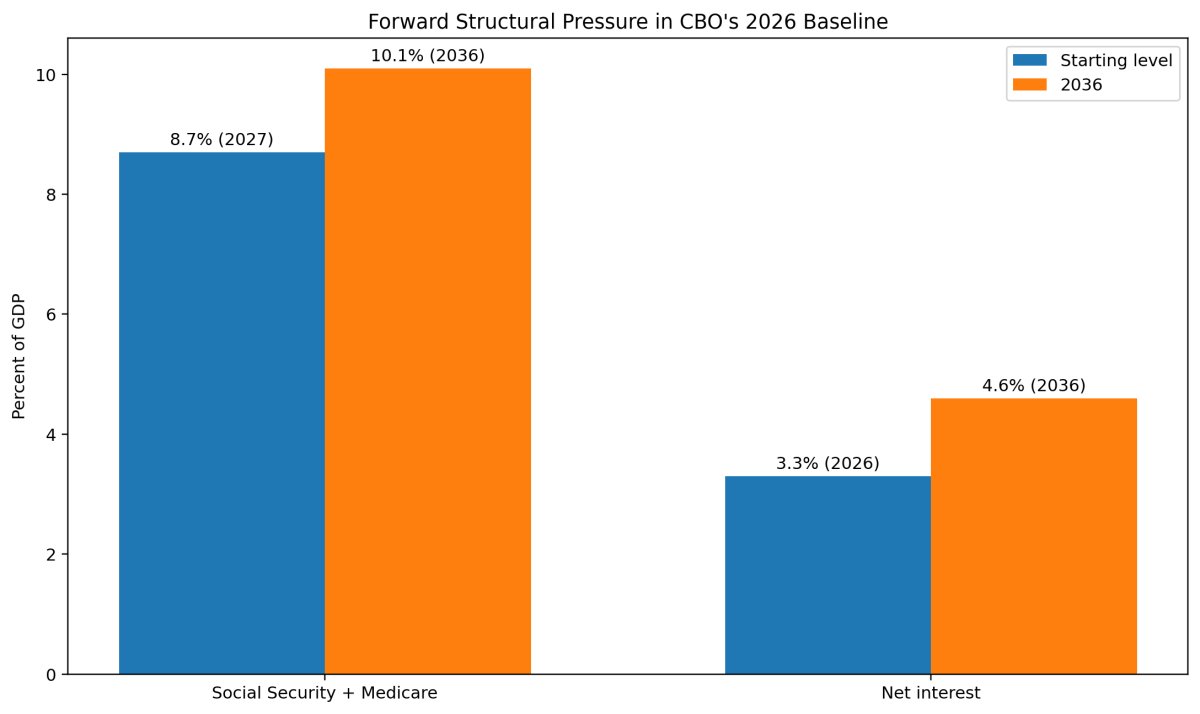
The current debt problem is therefore the intersection of two old systems and one new one:
- the aging-linked benefit system;
- the repeated decision not to collect enough revenue to finance promised spending; and
- the interest bill created by the accumulated mismatch.
4. The Structural Legacy Timeline
1935: Roosevelt creates Social Security
Franklin D. Roosevelt signed the Social Security Act in 1935. The original system was far narrower than today’s program. Later laws expanded survivor, dependent, disability, and coverage provisions. It is historically wrong to assign the entire modern cost to FDR, but he created the legal base from which the automatic benefit system grew.
1972–1975: Nixon-era automatic indexing changes the growth mechanism
The 1972 amendments established automatic cost-of-living adjustments, with automatic increases beginning in 1975. That was a major structural change because Congress no longer had to vote separately for each nominal benefit increase. Indexing protected beneficiaries from inflation, but it also transformed inflation into an automatic federal expenditure escalator.[15]
1983: Reagan and Congress prevent near-term Social Security insolvency
The 1983 Social Security amendments were a bipartisan financing repair, not simply an expansion. They broadened coverage, changed taxation and retirement provisions, accelerated scheduled tax changes, and built reserves that delayed the financing crisis for decades. Reagan therefore belongs in Social Security’s lineage as a reformer who strengthened financing, even though the system again faces a major imbalance.[16]
1965: Johnson creates Medicare and Medicaid
Lyndon B. Johnson signed the Medicare and Medicaid programs into law in 1965. This is arguably the most important structural spending event in the postwar fiscal system. Medicare created a federal health entitlement for older Americans; Medicaid created a federal-state financing framework for eligible low-income and medically vulnerable populations.[14]
The current cost cannot be attributed solely to Johnson. The original programs were expanded, payment systems changed, new beneficiary classes were added, prescription-drug coverage was introduced, medical technology advanced, life expectancy changed, and per-person health costs rose. But Johnson created the architecture that makes those later costs flow through the federal budget automatically.
1981: Reagan changes the revenue trajectory
Ronald Reagan’s tax policy permanently lowered statutory tax rates and helped establish tax reduction as a central governing strategy. Subsequent legislation partly reversed some provisions and broadened the tax base, especially in the 1986 reform. Reagan’s net long-run debt contribution cannot be reduced to one tax bill because defense spending, recession effects, later tax increases, and economic feedback all matter. Still, his presidency is a major turning point in the political willingness to accept structurally lower revenue without equivalent permanent spending reductions.
1990 and 1993: George H.W. Bush and Clinton enact real deficit reduction
The 1990 budget agreement under George H.W. Bush combined revenue increases and spending restraint. CBO estimated it would reduce the deficit relative to baseline by $33 billion in 1991, $69 billion in 1992, and $160 billion in 1995.[19]
Clinton’s 1993 budget law was also a direct deficit-reduction package. CBO estimated $433 billion of deficit reduction over 1994–1998, including $47 billion of lower debt service.[18] The later surpluses cannot be credited to that law alone: strong economic growth, capital-gains receipts, defense reductions after the Cold War, prior and later budget rules, and divided-government restraint also mattered. But the statute moved the fiscal path in the correct direction.
2001–2003: George W. Bush creates the modern tax-cut lineage
The 2001 and 2003 tax cuts reduced revenue and contained scheduled expirations that shifted the political burden to future Congresses. That design became critical. When expiration approached, later policymakers could either allow a visible tax increase or extend the cuts and book a large cost relative to current law.
This creates shared lineage. Bush originated the policy architecture. Obama signed major extensions and then the 2013 law that made most provisions permanent. Trump later enacted a new major tax law. A serious debt genealogy must preserve both the original node and each continuation node.
2003: Bush adds Medicare Part D
The Medicare Modernization Act added outpatient prescription-drug coverage. CBO’s original estimate placed the drug benefit at roughly $425 billion over 2004–2013, although actual Part D costs later ran far below the original projection.[20][21] The policy delivered substantial benefits and market negotiation through private plans, but it was not matched by an equivalent dedicated financing stream. That made it a clear structural debt addition even though the realized cost was lower than first feared.
2008–2010: crisis policy crosses Bush and Obama
The financial crisis began under Bush and continued into Obama’s presidency. TARP, financial stabilization, Federal Reserve intervention, automatic stabilizers, and Obama’s recovery legislation formed one continuous crisis-response chain. It is analytically dishonest to assign the recession entirely to either administration, just as it is misleading to count all crisis borrowing as permanent structural policy.
2010–2013: Obama extends tax cuts and restructures health financing
Obama’s largest long-run debt contribution may not be the ACA. It may be the continuation of the Bush tax architecture. The 2010 agreement extended the cuts temporarily. The American Taxpayer Relief Act of 2012, signed in January 2013, made most of them permanent. CBO estimated that act would add roughly $4 trillion to deficits over 2013–2022 relative to then-current law, mostly through tax provisions.[22]
That does not mean Obama “created” the full $4 trillion. The law prevented scheduled tax increases embedded in the baseline. But it means the Obama administration and Congress chose to preserve most of the Bush system. In a lineage model, Bush receives origin attribution and Obama receives extension/permanence attribution.
2017: Trump’s Tax Cuts and Jobs Act
CBO estimated that the 2017 tax law would add roughly $1.9 trillion to deficits over 2018–2028 after incorporating macroeconomic feedback and additional debt service. CBO estimated economic feedback would recoup part of the primary revenue loss, but not enough to make the law self-financing, and the larger debt stock generated additional interest expense.[4]
This is one of the cleanest examples of the difference between economic growth and fiscal payback. A policy can raise GDP relative to baseline and still increase debt because the added tax base is smaller than the revenue reduction plus interest.
2020–2022: pandemic and recovery legislation
CBO estimated that major 2020 pandemic-response laws would add about $2.6 trillion to deficits over 2020–2030. Those laws supported GDP sharply in the near term, but CBO also projected that the additional debt would reduce output modestly later through crowding out.[5]
Biden’s American Rescue Plan added an estimated $1.844 trillion over 2021–2031.[6] The Infrastructure Investment and Jobs Act added about $256 billion over its scoring window.[7] The Inflation Reduction Act, as enacted, was estimated to reduce the unified deficit by about $58 billion over 2022–2031.[8]
2025: Trump II creates a new structural tax-and-spending node
CBO’s 2026 outlook estimates that the 2025 reconciliation act increased cumulative deficits by $4.7 trillion over 2026–2035 after economic effects and net interest. Higher tariffs reduce deficits by an estimated $3.0 trillion over the same broad update, while immigration-related administrative actions add about $0.5 trillion.[1]
Therefore, the law itself is a major debt addition, while the wider administration policy package is smaller after tariff revenue. Those are two different measurements and should not be collapsed.
5. Did Obama and the ACA Create the Biggest Debt Problem?
No. The evidence does not support the claim that Obamacare or Medicaid expansion was the largest cause of today’s debt.
The ACA expanded Medicaid eligibility in participating states and created subsidized insurance marketplaces. Those provisions increased federal outlays. But the law also raised revenue and reduced projected Medicare payments. CBO and JCT estimated the complete enacted package would reduce federal deficits by $124 billion over 2010–2019 and by roughly one-half of one percent of GDP in the next decade.[3]
Later CBO work explained why a clean retrospective score is difficult: health spending changed, the economy changed, implementation changed, courts altered the law, and later legislation repealed or weakened some financing provisions. CBO nevertheless stated that it had no reason to conclude the original deficit-reduction assessment was wrong; an adjusted calculation implied more than $150 billion of deficit reduction in the first decade.[3]
An integrated post-2001 fiscal decomposition reaches the same direction. It finds that the ACA likely explains less than one-tenth of the increase in federal health spending as a share of GDP from 2001 through 2023 because its coverage costs were offset by Medicare savings and revenue—some of which later laws reversed.[2]
Where Obama’s debt contribution actually sits
- Temporary crisis response: the recovery act and other Great Recession measures raised near-term deficits but were not all permanent.
- Tax-cut continuation: the 2010 extension and 2013 permanence of most Bush-era tax cuts materially reduced future revenue relative to current law.
- ACA: expanded coverage but, as a complete enacted package, was scored as deficit-reducing.
- Spending restraint: the Budget Control Act imposed discretionary caps, although later Congresses repeatedly relaxed those limits.
- Economic inheritance: weak receipts and automatic stabilizer spending from the financial crisis inflated deficits early in the term.
The fairest conclusion is that Obama participated in preserving the low-revenue architecture created under Bush, while also enacting a health law designed to finance its coverage expansion. Anyone searching for Obama’s largest structural debt contribution should look first at the tax-cut extensions and the failure to secure a broader long-run fiscal settlement—not at the ACA alone.
6. The Presidential and Policy-Family Rankings
Ranking A: Structural Legacy
- Johnson-era Medicare and Medicaid architecture. Strongest candidate for the largest permanent spending structure, especially Medicare.
- Multi-president Social Security architecture. Roosevelt created it; later administrations broadened, indexed, and refinanced it. No single-president assignment is defensible.
- Bush-era tax cuts and their descendants. The origin of the largest identifiable post-2001 revenue-loss lineage.
- Trump-era tax laws. TCJA created a large additional revenue reduction; the 2025 reconciliation act creates another major structural deficit node.
- Bush-era Medicare Part D. A permanent entitlement expansion without a matching dedicated financing increase.
Ranking B: Identifiable Post-2001 Policy Families
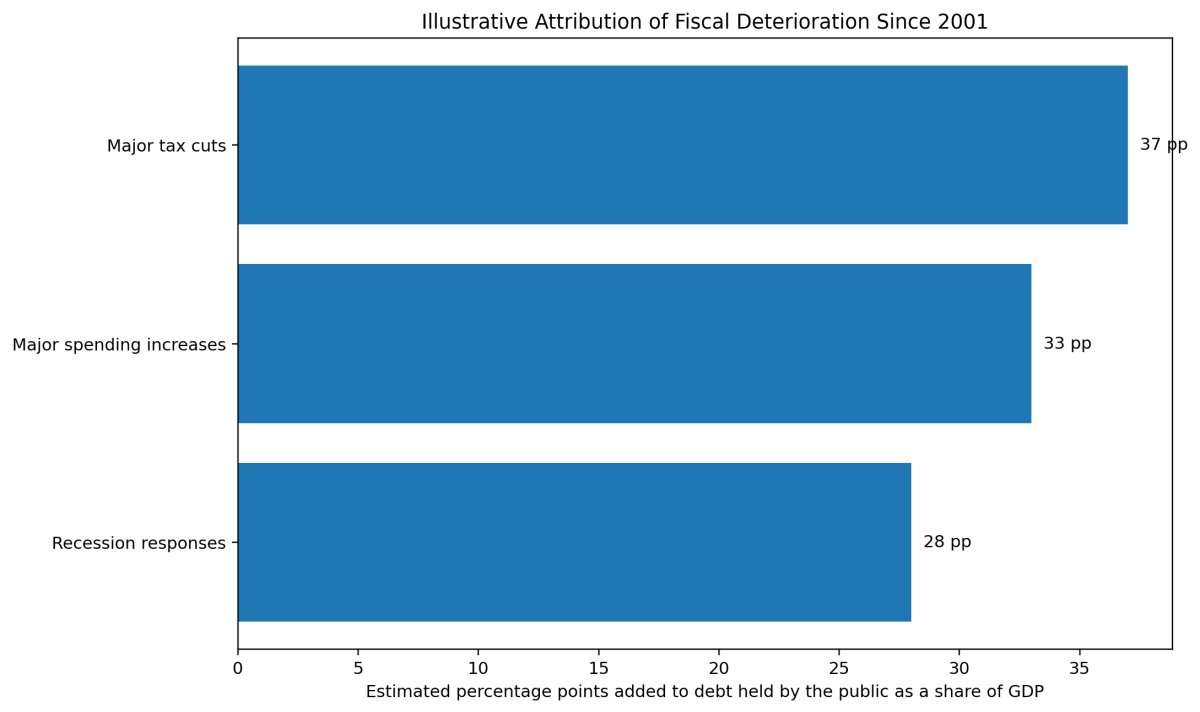
The most important result is that the debt cannot be explained honestly by saying “entitlements did it” or “tax cuts did it.” Both sides are large. Since 2001, repeated tax reductions, discretionary and Medicare expansions, and crisis responses each created a major portion of the deterioration.
Ranking C: Comparable Modern Approved Borrowing
A 2024 Committee for a Responsible Federal Budget inventory estimated that Trump approved $8.4 trillion of ten-year borrowing during his first term and Biden approved $4.3 trillion through the first three years and five months of his term. Excluding major COVID legislation, the estimates were $4.8 trillion for Trump and $2.2 trillion for Biden.[12]
This is useful but not final. The Biden window was incomplete at the time of the estimate. The method depends on which executive actions and laws are included. It also measures approved ten-year borrowing, not the exact debt stock at the end of a presidency.
Ranking D: Selected Official Policy Scores
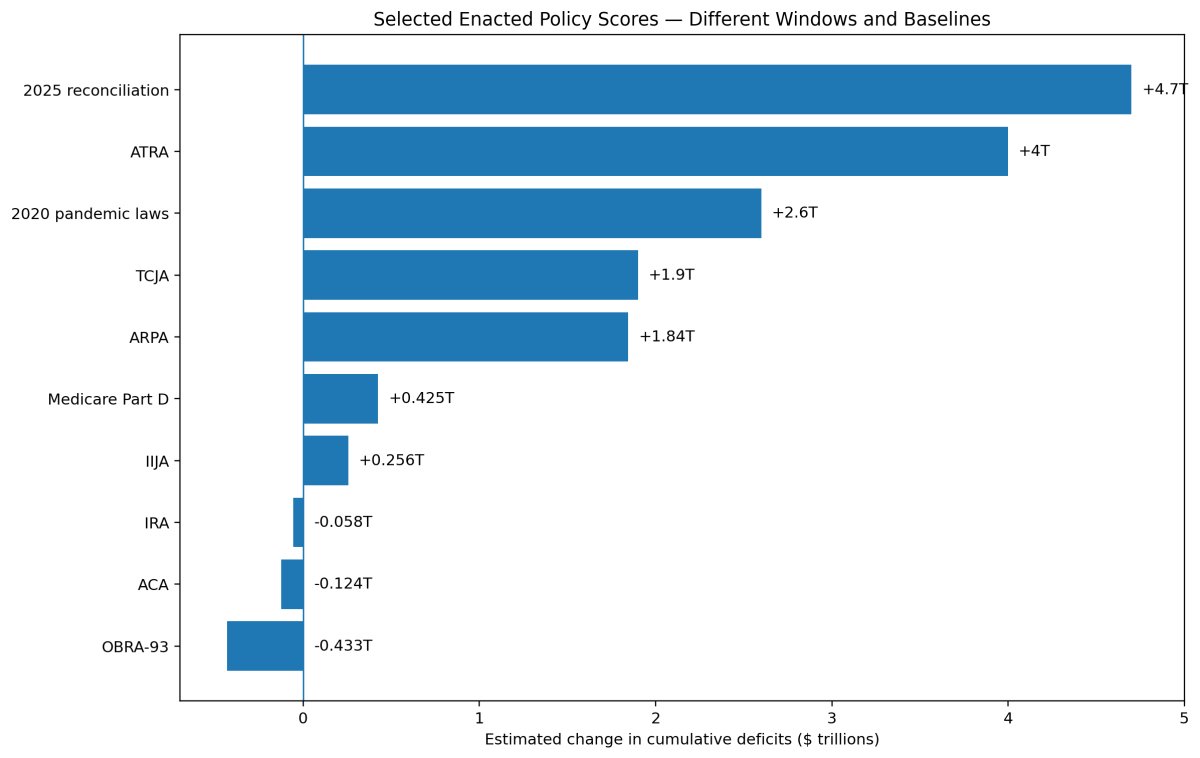
Do not add the bars together. Some policies overlap, some include interest, some do not, and the scoring windows differ. This is a comparative scale board, not a unified historical total.
7. Which Policies Actually Paid Back?
“Paid back” can mean at least four different things:
- Direct Treasury cash return: the government receives more cash than it disbursed.
- Unified-budget return: the law reduces spending or raises revenue enough to lower total deficits.
- Macroeconomic return: the policy raises GDP and future taxable income, recouping part of the cost.
- Social return: health, security, longevity, stability, education, or infrastructure benefits exceed the resource cost even when the Treasury does not earn a profit.
Clear fiscal winners
The 1990 and 1993 deficit agreements were direct fiscal improvements. They combined revenue and spending changes that lowered projected deficits and, in Clinton’s 1993 package, explicitly lowered future debt service.[18][19]
The ACA as enacted belongs in the deficit-reducing category, even though individual components increased spending.[3]
The bank-capital portion of TARP produced a direct positive cash return. Treasury ultimately received roughly $225 billion from institutions against about $205 billion disbursed under the Capital Purchase Program, with an estimated lifetime gain of $16.1 billion.[9] That does not mean every TARP component was profitable; housing and auto interventions had net costs.[10]
Partial fiscal payback with broader social return
Childhood Medicaid has evidence of meaningful long-run fiscal recapture. One major study estimated that higher later-life tax payments allow government to recoup 56 cents of each dollar spent on childhood Medicaid by age 60, before counting lower mortality and higher college attendance.[11] That is a strong return, but it is not proof that all Medicaid populations or services self-finance.
Federal investment can raise productivity. CBO has estimated an average annual return of roughly 5 percent for productive federal investment, while emphasizing that the result depends heavily on project quality and financing.[13] Borrowing for weak projects can still increase the debt burden; well-selected infrastructure, research, and education can raise future output and tax capacity.
Pandemic relief generated a strong near-term stabilization return but not a complete fiscal payback. CBO estimated that the 2020 laws substantially raised GDP in 2020 and 2021, while the larger debt stock modestly reduced long-run output.[5]
Programs that should not be judged as profit centers
Social Security, Medicare, Medicaid, disability insurance, veterans’ benefits, and disaster relief are social insurance or transfer systems. Their purpose is not to generate Treasury profit. The correct question is whether the social protection is worth the tax and debt cost, whether financing is sustainable, and whether the same benefit could be delivered more efficiently.
Calling Social Security or Medicaid “net negative” without defining the ledger is too crude. They can be negative to the unified federal cash balance while positive to household security, health, labor-market attachment, or long-run tax receipts. Fiscal sustainability and social value are related, but they are not identical.
8. Social Security, Medicare, and Medicaid: What the Ledgers Actually Say
Social Security was not simply “borrowed and stolen”
When payroll-tax income exceeded benefit payments, Social Security trust funds invested the surplus in special Treasury securities. The rest of the federal government used the cash, while recording a legal obligation to the trust funds. In unified-budget accounting, those surpluses reduced the amount Treasury needed to borrow from the public. In gross-debt accounting, they increased intragovernmental debt.
The accounting matters:
- The trust-fund bonds are real federal obligations.
- They are not marketable debt held by the public.
- Redeeming them requires Treasury to use taxes, cut other spending, or borrow from the public.
- The past surplus period did not eliminate the program’s future demographic imbalance.
The 2026 Trustees project that combined reserves can cover scheduled benefits until 2034. At depletion, continuing income would cover about 83 percent of program cost. The 75-year actuarial deficit is 4.42 percent of taxable payroll.[17]
Medicare is the larger pure federal health-pressure problem
Medicare is linked directly to population aging and high per-person health spending. Its hospital-insurance component has dedicated payroll-tax financing, but the physician, outpatient, and prescription-drug components receive large general-revenue transfers. That means Medicare’s fiscal pressure cannot be described as merely spending down a self-contained account.
Medicaid is different
Medicaid is a federal-state program, heavily concentrated in children, disabled people, low-income adults, older beneficiaries, and long-term services and supports. It expands during downturns and varies by state. Its social and fiscal returns differ sharply by beneficiary group.
For the ACA expansion population, the federal government assumed a high share of costs. But the ACA’s overall federal score incorporated taxes and Medicare savings designed to finance the coverage provisions. To isolate Medicaid expansion alone and then call that number “the ACA’s debt impact” removes the financing side of the law and produces a misleading result.
The forward baseline does not identify ACA programs as the dominant accelerator
In CBO’s 2026 projection, Social Security and Medicare are the central mandatory-spending growth engines. CBO projects other mandatory spending—which includes Medicaid, marketplace premium tax credits, CHIP, and many other programs—to decline as a share of GDP on net over the projection period. That does not make Medicaid cheap; it means it is not the primary source of the projected increase relative to the economy.[1]
9. The Tax-Cut Lineage: The Largest Modern Policy Family
The most important modern revenue story is a chain, not a single statute:
- the 2001 Bush tax cuts;
- the 2003 Bush tax cuts;
- the 2010 Obama-era extension;
- the 2013 Obama-era permanence and modification;
- the 2017 Trump Tax Cuts and Jobs Act; and
- the 2025 Trump-era reconciliation tax provisions.
An integrated estimate finds that the first five major tax laws cost nearly $8.4 trillion through 2023.[2] This is the strongest quantitative case for naming tax policy—not the ACA—as the largest identifiable legislative family behind the post-2001 debt deterioration.
Who owns the Bush tax cuts after Obama extended them?
Both administrations do, but in different ways.
- Origin attribution: Bush receives credit or responsibility for creating the policy and its initial expiration design.
- Continuation attribution: Obama and the Congresses that extended the law receive responsibility for choosing not to let it expire.
- Permanent-law attribution: the 2013 law becomes a new node because it converted much of a temporary system into a permanent one.
The same method applies whenever a later president extends a predecessor’s temporary spending program or tax provision. The original president owns the architecture; the extender owns the continuation.
Did the tax cuts grow the economy?
Some tax changes can improve incentives, investment, labor supply, and the allocation of capital. That does not imply they pay for themselves. The fiscal question is whether the additional taxable economic activity generates enough revenue to replace the static loss and cover added interest.
For TCJA, CBO estimated that macroeconomic feedback recouped part of the conventional cost, but the law still added roughly $1.9 trillion to deficits over the scoring window after feedback and interest.[4] The law can therefore be described as pro-growth relative to a baseline in some dimensions and still be a net debt addition.
10. Wars, Recessions, and Emergency Spending
Wars create long interest tails and downstream obligations
The fiscal cost of war is not limited to annual Pentagon appropriations. It includes veterans’ health and disability benefits, equipment replacement, reconstruction, homeland-security expansion, intelligence spending, and decades of interest on borrowed funds. Attribution also crosses administrations because a president can begin a conflict while successors continue, expand, or terminate it.
An integrated post-2001 estimate places roughly $2 trillion of real discretionary increases in the Iraq and Afghanistan war category through 2023, within a broader $7.6 trillion of real discretionary increases.[2]
Recession response should be split into three layers
- Automatic recession cost: lower receipts and higher existing safety-net spending without a new law.
- Temporary enacted stabilization: checks, unemployment supplements, business support, state aid, and emergency health spending.
- Permanent post-crisis changes: any temporary program or tax provision later extended or embedded into the baseline.
The first two can prevent a deeper collapse and partially protect the future tax base. The third is where crisis policy becomes structural debt policy.
TARP demonstrates why gross outlay is not net cost
A loan, equity purchase, or guarantee is not economically equivalent to a grant. TARP’s bank-capital program returned more cash than it disbursed, while other components lost money. A correct policy ledger must track repayments, dividends, asset sales, defaults, and financing costs rather than treating every initial disbursement as permanent spending.
11. The Pattern Nexus Debt-Attribution Model
Step 1: Build the policy genealogy
Every major law becomes a node. Each node records:
- originating administration and Congress;
- scheduled expiration date;
- later extension, expansion, reduction, or repeal;
- affected spending and revenue categories;
- whether effects are temporary, permanent, or automatically indexed; and
- whether the law creates a financial asset, direct transfer, tax expenditure, or public investment.
Step 2: Build the annual primary-effect stream
For each policy i and year t:
Primary Effect(i,t) = Added Outlays(i,t) − Added Revenues(i,t)
A positive result adds to the deficit. A negative result reduces it.
Step 3: Add macroeconomic feedback
The model then estimates how the policy changes GDP, taxable income, employment, inflation, interest rates, and automatic-program spending:
Net Primary Effect(i,t) = Conventional Effect(i,t) − Fiscal Feedback(i,t)
This is the point at which infrastructure, research, education, health interventions, tax changes, and crisis stabilization can recover part of their cost. The feedback must be estimated, not assumed.
Step 4: Add the marginal interest tail
The counterfactual debt path is rolled forward using annual financing rates:
Attributed Debt(i,t) = Attributed Debt(i,t−1) × [1 + Marginal Rate(t)] + Net Primary Effect(i,t)
This produces a synthetic debt stock caused by the law relative to a no-law counterfactual.
Step 5: Separate origin from continuation
When a temporary law is extended, the model does not rewrite history. The original law receives the cost through its legal expiration. The extension receives the cost after the expiration date. A lineage view can still show that the later node descends from the original policy.
Step 6: Grade confidence
| Grade | Meaning | Example |
|---|---|---|
| A | Distinct law with an official score and limited overlap | ARPA, IIJA, IRA scoring windows |
| B | Official score but highly sensitive to baseline, expiration, or macro assumptions | ATRA, TCJA, 2025 reconciliation |
| C | Old program embedded in the baseline; lifetime counterfactual required | Medicare, Medicaid, Social Security |
| D | Broad social return or macroeconomic benefit difficult to monetize | Health, education, war deterrence, basic research |
Step 7: Publish multiple leaderboards
A single rank would create false precision. The model should publish:
- cumulative primary deficit caused;
- interest tail;
- debt-to-GDP effect;
- structural persistence;
- macroeconomic fiscal recapture;
- direct asset recovery;
- social return; and
- confidence grade.
What the model cannot honestly know
No model can observe the alternate America in which Medicare was never created, the Bush tax cuts expired in full, the financial crisis received no federal response, or COVID relief was radically smaller. Economic behavior, elections, state policy, private insurance, wages, health outcomes, interest rates, and later legislation would all have changed.
The goal is not fake precision. The goal is disciplined approximation with visible assumptions.
12. The Selected Policy Ledger
| Policy | Presidential Lineage | Score Window | Estimated Deficit Effect | Interpretation |
|---|---|---|---|---|
| 1993 deficit package | Clinton | 1994–1998 | −$433B | Direct deficit reduction, including lower debt service. |
| Medicare Part D | George W. Bush | 2004–2013 original estimate | +$425B | Permanent benefit expansion; actual cost later ran below the original estimate. |
| ACA as enacted | Obama | 2010–2019 | −$124B | Coverage expansion financed by taxes and Medicare savings in the full-law score. |
| American Taxpayer Relief Act | Obama / Bush lineage | 2013–2022 | Approximately +$4.0T | Made most Bush tax cuts permanent; cost is relative to scheduled expiration. |
| TCJA | Trump I | 2018–2028 | Approximately +$1.9T | Includes macro feedback and debt service; not self-financing. |
| 2020 pandemic laws | Trump I / bipartisan Congress | 2020–2030 | Approximately +$2.6T | Large temporary stabilization with near-term GDP support and a later debt drag. |
| American Rescue Plan | Biden | 2021–2031 | +$1.844T | Large front-loaded recovery and transfer package. |
| Infrastructure Investment and Jobs Act | Biden | 2021–2031 | +$256B | Debt addition partly associated with public investment that can raise output. |
| Inflation Reduction Act | Biden | 2022–2031 | −$58B | Modest unified-budget deficit reduction in the enacted score. |
| 2025 reconciliation act | Trump II | 2026–2035 | +$4.7T | Large structural deficit increase after economic and interest effects. |
Critical warning: the rows use different baselines and windows. This ledger is designed to trace policy lineage and scale, not to imply direct comparability or permit simple summation.
13. Final Pattern Nexus Verdict
The American debt system was not built in one administration. It was built as a chain of decisions that rarely disappeared:
- a benefit was created;
- eligibility expanded;
- payments indexed;
- a tax cut became politically difficult to reverse;
- a war or recession required borrowing;
- temporary policy became permanent;
- the debt stock remained; and
- interest began reproducing the original cost.
If forced to name the presidents with the greatest long-term fiscal impact, the honest answer is categorical:
Johnson built the most consequential health-entitlement architecture. Roosevelt began the Social Security architecture, but Nixon-era indexing and later expansions transformed its growth path, while Reagan’s 1983 agreement repaired its financing for decades. Bush created the most consequential modern tax-cut lineage and added Medicare Part D. Obama preserved most of the Bush tax system but did not create the largest health-related debt driver; the ACA was deficit-reducing as enacted. Trump’s first term approved the largest comparable modern amount of ten-year borrowing, and the 2025 reconciliation law adds another large structural deficit stream. Biden added major pandemic recovery borrowing and infrastructure spending, while the IRA modestly reduced projected deficits as enacted.
The most dangerous policy is not necessarily the largest one-year bill. It is the policy that creates a permanent annual gap between promised spending and dedicated revenue. The second-most dangerous is the later extension that converts a temporary gap into the baseline. The third is the political refusal to revisit either side after the interest tail becomes visible.
That is where the United States now sits. CBO projects debt held by the public rising from 101 percent of GDP in 2026 to 120 percent by 2036. Net interest rises to 4.6 percent of GDP, while Social Security and Medicare continue expanding relative to the economy.[1]
The debt is no longer merely the consequence of old policy. The interest on old policy has become new policy.
Sources and Method Notes
- Congressional Budget Office, The Budget and Economic Outlook: 2026 to 2036.
- Committee for a Responsible Federal Budget, From Riches to Rags: Causes of Fiscal Deterioration Since 2001.
- Congressional Budget Office, Estimating the Budgetary Effects of the Affordable Care Act.
- Congressional Budget Office, The Budget and Economic Outlook: 2018 to 2028 / TCJA effects.
- Congressional Budget Office, The Effects of Pandemic-Related Legislation on Output.
- Congressional Budget Office, Estimated Budgetary Effects of the American Rescue Plan Act.
- Congressional Budget Office, Estimated Budgetary Effects of the Infrastructure Investment and Jobs Act.
- Congressional Budget Office, Estimated Budgetary Effects of Public Law 117-169, the Inflation Reduction Act.
- Government Accountability Office, Capital Purchase Program: Revenues Exceeded Disbursements.
- Government Accountability Office, Troubled Asset Relief Program Status.
- National Bureau of Economic Research, Medicaid as an Investment in Children.
- Committee for a Responsible Federal Budget, Trump and Biden: Debt Growth.
- Congressional Budget Office, The Macroeconomic and Budgetary Effects of Federal Investment.
- Centers for Medicare & Medicaid Services, Program History.
- Social Security Administration, Cost-of-Living Adjustments.
- Social Security Administration, 1983 Social Security Amendments.
- Social Security Administration, 2026 Trustees Report Conclusion.
- Congressional Budget Office, Budgetary Effects of the Omnibus Budget Reconciliation Act of 1993.
- Congressional Budget Office, The Economic and Budget Outlook: Fiscal Years 1992–1996.
- Congressional Budget Office, Medicare Prescription Drug Legislation Cost Estimate.
- Congressional Budget Office, Competition and the Cost of Medicare’s Prescription Drug Program.
- Congressional Budget Office, Budget and Economic Outlook including American Taxpayer Relief Act effects.
Methodological caution: official scores are estimates relative to specified baselines, over specified windows, using information available at the time. They are not retrospective causal truth. The CRFB integrated estimates are useful for cross-policy decomposition but remain model-dependent and should be read alongside primary CBO, JCT, SSA, CMS, Treasury, and GAO material.
What's Your Reaction?
 Like
0
Like
0
 Dislike
0
Dislike
0
 Love
0
Love
0
 Funny
0
Funny
0
 Wow
0
Wow
0
 Sad
0
Sad
0
 Angry
0
Angry
0

Founder of Pattern Nexus. I research markets, macro, geopolitics, AI, history, ancient systems, and the patterns most people overlook. I’m also building Market Radar, a trading scanner designed to read pressure, risk, confirmation, and setup quality before chasing a move. Pattern Nexus is where I connect the dots between data, history, technology, and the bigger system playing out around us.





Comments (0)