The Sixes Are Never Good: Q3, October Surprises, and the Pattern Window Opening in 2026
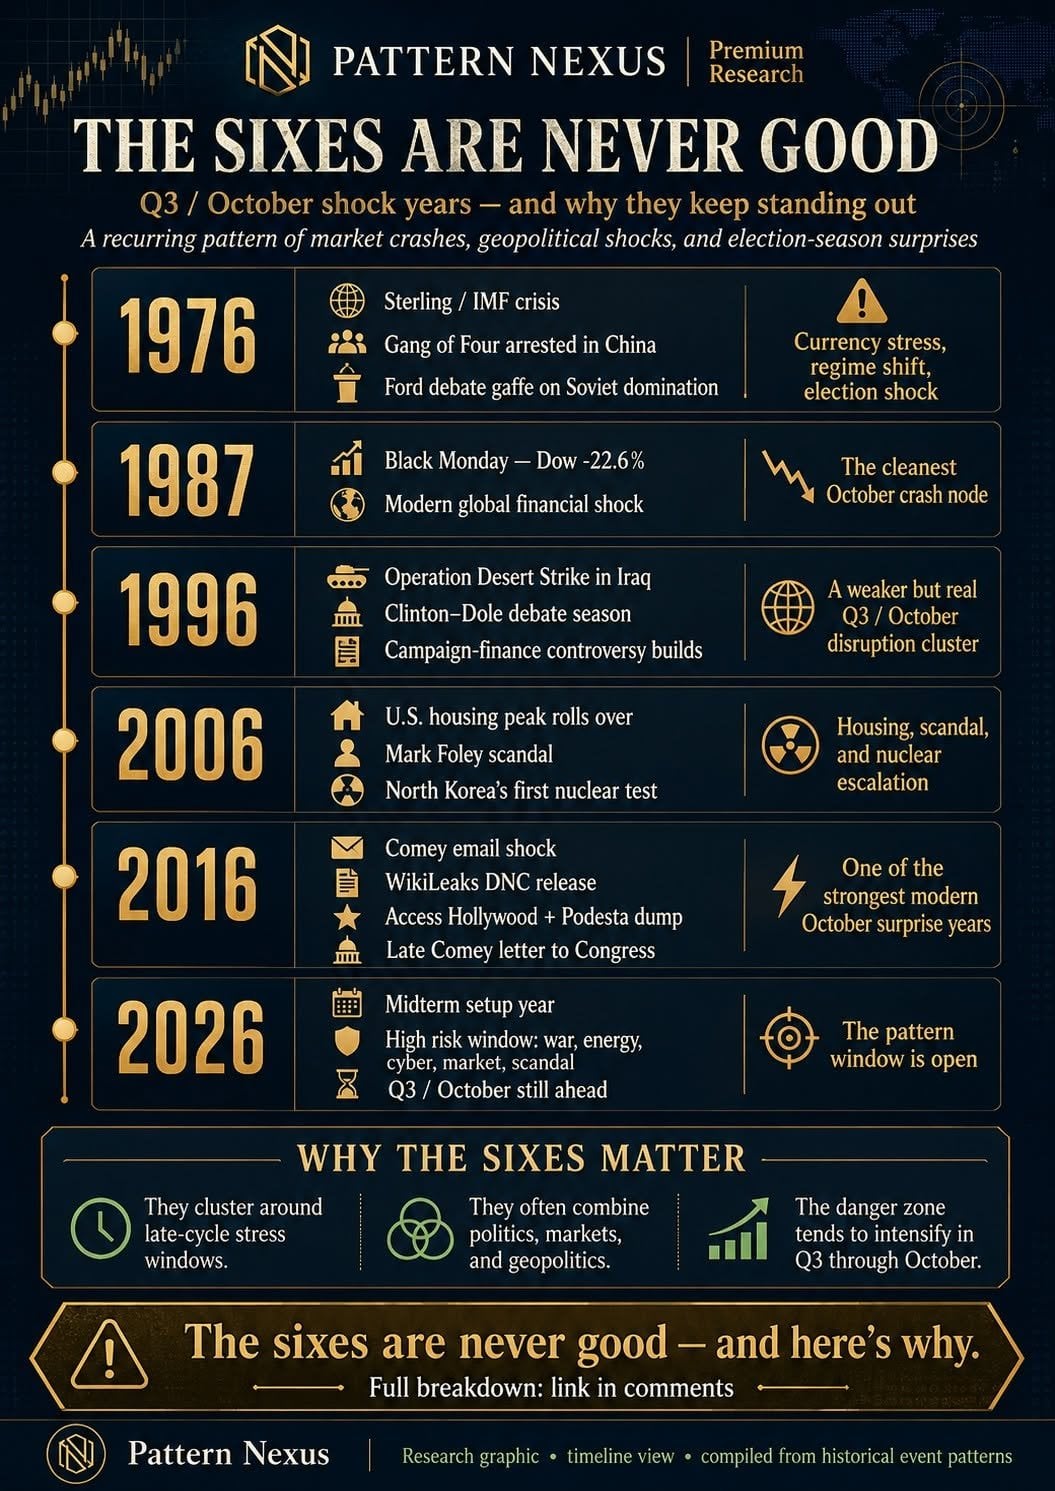
The number is not the mechanism. The window is. Across 1976, 1987, 1996, 2006, and 2016, major shocks kept clustering around Q3 and October: currency pressure, regime transition, market crashes, military strikes, housing rollover, political scandal, nuclear escalation, cyber leaks, and election-season institutional stress. This Pattern Nexus research piece maps the “sixes are never good” pattern as a late-cycle stress window, then applies the same framework to the open 2026 midterm year.
Deep macro plumbing, liquidity mechanics, and system analysis. No sponsors. No paywalls.
Support Pattern Nexus
Independent macro research and system-level analysis. No sponsors. No paywalls.
Pattern Nexus Premium Research
The Sixes Are Never Good
Q3 and October shock years, the stress windows behind them, and why 2026 deserves a real watchlist instead of lazy numerology.
Published: June 2026 · By Christopher Grenke / Pattern Nexus · Read Time: 38–55 minutes
Pattern Nexus Visual Board
Q3 / October Shock Stack
The number is not the mechanism. The timing window is the mechanism. Late-cycle stress becomes visible when markets, elections, fiscal calendars, military signaling, intelligence releases, and media attention collide.
1976currency / regime / election
1987market crash
1996weaker disruption cluster
2006housing / scandal / nuclear
2016information shock year
2026open pattern window
Premium Quick Read
The “sixes are never good” line works because the pattern is memorable: 1976, 1987, 1996, 2006, 2016, and now 2026. But the serious Pattern Nexus argument is not that a number causes history. The serious argument is that Q3 into October is a recurring stress window where buried pressure becomes public.
1976 carried currency stress, regime transition, and election credibility damage. 1987 gave the cleanest market crash node: Black Monday. 1996 is weaker, but still shows military signaling and campaign-cycle disruption. 2006 is stronger than people remember because housing was already rolling over, the Mark Foley scandal hit before the midterms, and North Korea crossed its first nuclear-test threshold. 2016 became the modern information-shock model: FBI, email, WikiLeaks, Access Hollywood, Podesta, and a late Comey letter all colliding in one election season.
2026 is not evidence yet. It is the open test. The midterms are still ahead. Q3 and October are still ahead. That makes it a watch window, not a prophecy. The point is not panic. The point is pattern discipline.
Why This Is Premium
This topic gets ruined the same way every pattern topic gets ruined. One side treats the pattern like magic. The other side pretends repeated timing clusters mean nothing because they are afraid of sounding superstitious. Both are lazy.
The better question is not: “Does the number six cause shocks?” It does not. The better question is: “Why do late Q3 and October repeatedly become reveal windows for stress that was already building?” That question is useful because it brings the conversation back to real systems: election calendars, fiscal deadlines, liquidity positioning, military timing, intelligence release strategy, media cycles, and institutional trust.
The pattern is not the cause. The pattern is the map. And the map says that when political, financial, and geopolitical systems are already fragile, Q3 and October are dangerous months for the public discovery of that fragility.
Executive Thesis
The strongest version of the “sixes” argument does not require numerology. It only requires one fact: complex systems are calendar-driven. Elections have dates. Budgets have dates. earnings cycles have dates. policy meetings have dates. military decisions are timed. opposition research is timed. leaks are timed. markets are positioned around quarters. foreign governments understand domestic windows.
That means October is not random. It is the final full political narrative month before U.S. federal elections. It is also deep enough into the year for financial stress, policy error, and geopolitical pressure to have built up. When a system is already weak, October does not have to create the shock. It only has to expose it.
The Pattern Nexus conclusion is simple: the number is the hook, but the window is the mechanism. The “six” sequence matters because it gives us a clean historical lens for studying late-cycle shock clustering. 2026 belongs in the article not because disaster is guaranteed, but because the same window is about to open again.
Choose Your Reading Level
Pick the version that matches how deep you want to go.
Reader-Friendly Version: What the Sixes Pattern Is Really Saying
The phrase “the sixes are never good” is not a mathematical proof. It is a shorthand. It points to a weird historical row where several “six” cycle years produced visible stress around Q3 and October.
The clean version is this: the second half of the year is where hidden pressure starts becoming impossible to hide. By Q3, markets have digested most of the year. By October, elections are close enough that one scandal, one leak, one gaffe, one war shock, or one market break can become the whole story. The public experiences it as sudden. The system usually weakened first.
That is why this matters. The pattern is not saying history is magic. It is saying stress has a reveal window.
Simple version: October shocks are usually not born in October. October is when the pressure finally becomes visible.
The Six-Year Timeline
Year
Main Shock Cluster
Plain-English Meaning
1976
UK sterling / IMF crisis, Gang of Four arrest, Ford debate gaffe
Currency stress, regime transition, and election credibility damage hit the same broad window.
1987
Black Monday
The cleanest October crash node: the Dow fell 22.6% in one day.
1996
Operation Desert Strike, Clinton-Dole debate season, campaign-finance controversy building
A weaker year, but still a disruption cluster around military signaling and election timing.
2006
Housing rollover, Mark Foley scandal, North Korea nuclear test
The financial crack was forming before the public panic, while scandal and nuclear escalation hit the election window.
2016
Comey email statement, DNC leak, Access Hollywood, Podesta emails, late Comey letter
The modern information-shock model: law enforcement, leaks, cyber, media, and election trust collided.
2026
Open midterm window
Not evidence yet. A live watch window because Q3 and October are still ahead.
Why October Keeps Showing Up
October sits close to the edge. It is close to Election Day. It is late in the financial year. It is late enough for economic narratives to harden. It is late enough for campaigns to be exhausted. It is late enough for opposition research, intelligence questions, lawsuits, scandals, leaks, and foreign moves to land with maximum damage.
That does not mean everything in October is planned. It means October is a high-leverage month. A shock that lands in May has time to be investigated, absorbed, spun, forgotten, or replaced. A shock that lands in October has less runway. That gives the event more power.
Why 2026 Is the Open Window
2026 is not on the list because something has already happened in October. October 2026 has not happened yet. It is on the list because the setup is obvious. It is a national midterm year. Every House seat is on the ballot. Senate control is exposed. Markets are sensitive. Energy, war, cyber, and legal/institutional risk are already part of the national background.
The honest read is not “something must happen.” The honest read is: the pattern window is open, and Q3 into October is where the risk concentrates.
Reader-Friendly Bottom Line
The sixes are not magic. They are a pattern hook. The useful part is the timing: late-cycle stress, election calendars, market positioning, foreign leverage, scandal timing, and public trust all compress in Q3 and October.
That is why the sequence matters. Not because the calendar controls history, but because the systems that make history are calendar-bound.
Non-Technical Advanced Version: The Sixes as a Stress-Reveal System
The deeper Pattern Nexus read is that these years are not connected by mystical causation. They are connected by stress visibility. A complex system can carry hidden pressure for months or years. Then a specific timing window forces the pressure into public view.
Markets do this when liquidity disappears. Campaigns do this when scandals become impossible to contain. States do this when currency confidence fails. Foreign governments do this when they time escalation around a distracted opponent. Institutions do this when their credibility becomes part of the story instead of the referee above the story.
That is the useful framework: not prophecy, not numerology, not coincidence-hunting. Calendar compression.
1976: Currency, Regime, and Debate Shock
1976 starts the pattern with three different systems under pressure. The UK sterling crisis was not just an exchange-rate problem. It represented a deeper postwar confidence break: inflation, borrowing, public spending pressure, and the humiliating need for IMF support. Currency stress is never only financial. It is political because it tells the public that national policy has hit an outside constraint.
Then China’s post-Mao power struggle produced the arrest of the Gang of Four. That was a regime-transition event, not a normal political shuffle. It cleared the path away from the Cultural Revolution faction and toward the eventual reform era.
In the United States, Gerald Ford’s October debate answer about Soviet domination in Eastern Europe became a late-campaign credibility wound. One statement does not decide all history by itself, but the timing matters. Late-cycle gaffes have more force because there is less time to rebuild trust.
PN read: 1976 matters because it combines sovereign confidence, regime transition, and election credibility in the same late-year pressure field.
1987: The Cleanest Market-Crash Node
1987 is the simplest row because it does not need much interpretation. Black Monday hit on October 19, 1987. The Dow fell 22.6% in one session. That made it the most severe one-day percentage drop in the modern Dow record.
The crash exposed a market-structure problem: portfolio insurance, program trading, index arbitrage, valuation concerns, and liquidity assumptions all interacted badly. The system looked tradable until everyone needed the exit at the same time. Then the exit became the event.
This is the market version of the broader pattern. The risk was not invisible because it did not exist. It was invisible because the feedback loop had not yet been triggered.
1996: Weak Signal, But Not Empty
1996 is the weakest row, and a serious analysis should say that directly. It does not match 1987, 2006, or 2016 in intensity. But it still carries a Q3 / October disruption cluster.
Operation Desert Strike in September 1996 showed U.S. military signaling against Iraq inside a campaign year. The Clinton-Dole debate cycle landed in October. The campaign-finance questions around the 1996 election were not fully metabolized until later, but the pressure was forming inside the same election environment.
The correct label is not “major crisis.” The correct label is “low-to-medium disruption cluster.” That actually strengthens the analysis because it avoids forcing every row to be equally dramatic.
2006: The Crack Before the Collapse
2006 is more important than it looked in real time. The public memory of the financial crisis is centered on 2008, but the housing system was already turning in 2006. That is a classic Pattern Nexus signal: the visible crisis comes later, but the structural crack forms earlier.
Then the Mark Foley scandal hit right before the midterms, damaging Republican leadership credibility. North Korea announced its first nuclear test on October 9, crossing a geopolitical threshold. Housing, scandal, and nuclear escalation are not the same domain, but that is exactly why the year matters. It is a cross-domain stress year.
2006 is the warning that the most important event in a pattern year may not be the loudest event. Sometimes the quiet rollover is the real signal.
2016: The Modern October Surprise Machine
2016 is the strongest modern political-information shock year in the sequence. The FBI’s July statement kept the Clinton email issue alive. The DNC email release hit during the convention window. The Access Hollywood tape and Podesta email release landed on the same October day. Then the late Comey letter reopened the email story less than two weeks before Election Day.
The point is not simply that there were scandals. The point is that law enforcement, cyber operations, media incentives, campaign strategy, platform distribution, and public trust all became fused. The institutions that were supposed to interpret the election became part of the election.
That is why 2016 still matters. It showed that October is no longer just an election-surprise window. It is an information-warfare window.
The System Pattern Across the Years
Domain
What Breaks
Years Where It Shows
Pattern Nexus Meaning
Currency / sovereign confidence
A government loses control of the confidence narrative.
1976
Markets discipline politics.
Market liquidity
The exit disappears once everyone reaches for it.
1987, 2006 setup, 2026 watchlist
Hidden fragility becomes public all at once.
Election narrative
A late event changes the story with little time left.
1976, 1996, 2006, 2016, 2026 watchlist
Timing multiplies damage.
Geopolitical threshold
A state crosses a visible escalation line.
1976, 1996, 2006, 2016 background, 2026 watchlist
External actors understand domestic calendars.
Institutional trust
The referee becomes part of the fight.
2016 strongest, 1976 and 2006 secondary
When trust breaks, facts alone do not stabilize the system.
2026: What Would Confirm the Pattern?
2026 should not be treated as completed evidence. The correct analytical posture is conditional. These are the lanes that would matter if they intensify in Q3 or October.
Market / Credit
Sudden equity repricing, credit stress, bank stress, liquidity freeze, AI valuation break, or Treasury-market plumbing problem.
Energy / War
Oil shock, shipping disruption, sanctions escalation, regional war expansion, or energy-price pressure entering campaign narratives.
Cyber / Leak
Campaign breach, infrastructure hack, manipulated media dump, or a late information release timed for maximum political damage.
The number is the branding. The window is the mechanism. The pattern works because it forces attention onto the calendar structure underneath modern systems.
When systems are already stressed, Q3 and October become the point where liquidity, public trust, election timing, geopolitical opportunism, and narrative control are forced into the open.
Technical Advanced Version: Method, Scorecard, and Limits
This article uses a qualitative Pattern Nexus stress-cluster model. It is not a statistical proof and should not be treated like one. The sample is small. The sequence is selected after pattern recognition. One year, 1987, is included because it is part of the user’s selected “sixes” row despite not ending in six. That makes the model useful as a narrative-risk lens, not as a formal predictive engine.
The proper question is not whether the number six predicts shocks. It does not. The proper question is whether the selected years reveal recurring Q3 / October stress clustering across markets, elections, geopolitics, scandal, and institutional trust. The answer is yes, with uneven intensity.
Method boundary: This is a pattern-mapping article, not a causal model. The correct use is watchlist construction, not prediction certainty.
PN Stress Index
The PN Stress Index scores each year on a 0–10 qualitative scale. It weighs severity, timing concentration, cross-domain overlap, and historical aftershock.
Year
Severity
Timing
Cross-Domain
Aftershock
PN Score
1976
High
High
High
Medium
7.8
1987
Extreme
Extreme
Medium
High
9.5
1996
Medium
Medium
Medium
Low
5.5
2006
High
High
High
Extreme
8.4
2016
High
Extreme
Extreme
High
9.1
2026
Open
Pending
High setup
Unknown
Watchlist
Chart: Qualitative Shock Intensity
PN graphic: qualitative shock intensity. 2026 is a risk-window placeholder, not a completed historical score.
Technical Event Dataset
Year
Event
Window
Domain
Model Role
1976
UK sterling / IMF crisis
Q3–Q4
Currency / sovereign finance
Confidence break
1976
Gang of Four arrested
October
Regime transition
Power-structure shock
1976
Ford-Carter debate gaffe
Oct. 6
Election credibility
Late narrative damage
1987
Black Monday
Oct. 19
Market crash
Liquidity cascade
1996
Operation Desert Strike
Sept. 3
Military / geopolitical
Campaign-year escalation
2006
Housing rollover
Mid-2006 onward
Credit / housing
Hidden systemic crack
2006
North Korea first nuclear test
Oct. 9
Nuclear / geopolitical
Threshold crossing
2016
FBI / WikiLeaks / Access Hollywood / Podesta / Comey letter
July–October
Information / election trust
Modern October-surprise stack
2026
Midterm risk window
Q3 / October pending
Election / market / geopolitical / cyber
Open watchlist
The October Compression Effect
October is mechanically dangerous because it compresses reaction time. The closer an event lands to a scheduled decision point, the less time institutions have to verify, absorb, investigate, correct, spin, or stabilize it. This is true for elections, markets, and military crises.
Mechanism
Effect
Example
Information runway collapses
Public reaction happens before verification stabilizes.
2016 Comey letter / leak cycle
Liquidity becomes conditional
Markets can gap because everyone wants out together.
1987 Black Monday
Foreign actors gain timing leverage
Escalation lands when domestic attention is split.
1996 Iraq / 2006 DPRK
Institutional trust becomes the battlefield
The public fights over the referee, not only the event.
2016 FBI / media / platform environment
Technical Bottom Line
The pattern is not strong enough to claim prediction. It is strong enough to justify a watchlist. The strongest nodes are 1987, 2006, and 2016. 1976 is a real multi-domain stress year. 1996 is a weaker signal. 2026 is not evidence yet; it is the open window.
The clean technical conclusion is this: the “six” row is useful because it forces analysis around Q3 / October compression, where economic, political, geopolitical, cyber, and institutional stress can become visible at the same time.
Pattern Nexus Note: The sixes are not magic. They are a pressure map. The pattern is not that a number reaches into history and makes things break. The pattern is that modern civilization runs on clocks: election clocks, fiscal clocks, market clocks, military clocks, media clocks, and institutional clocks. When enough stress builds behind those clocks, Q3 and October become the reveal window. The public calls it a surprise. The system usually saw it coming.
Founder of Pattern Nexus. I research markets, macro, geopolitics, AI, history, ancient systems, and the patterns most people overlook. I’m also building Market Radar, a trading scanner designed to read pressure, risk, confirmation, and setup quality before chasing a move.
Pattern Nexus is where I connect the dots between data, history, technology, and the bigger system playing out around us.
 Like
0
Like
0
 Dislike
0
Dislike
0
 Love
0
Love
0
 Funny
0
Funny
0
 Wow
0
Wow
0
 Sad
0
Sad
0
 Angry
0
Angry
0


Comments (0)