
Pending Home Sales Confirm the Hard-Asset Rotation — Not a Housing “Surprise”
November pending home sales rose 3.3% month over month and 2.6% year over year, confirming a liquidity-driven rotation within hard assets. This analysis explains why housing strength can coincide with gold and silver weakness, and why “housing is overvalued” misunderstands credit, currency, and easing dynamics.
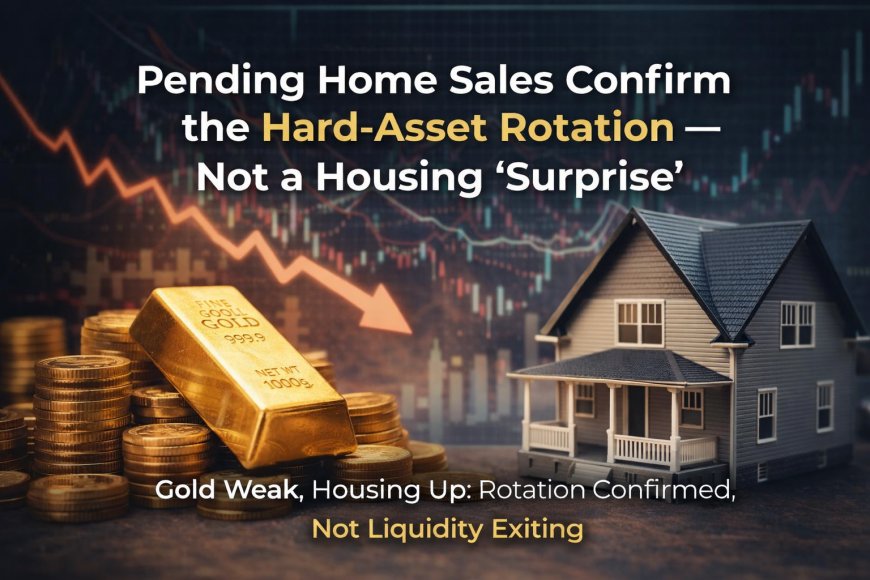
November pending contracts just printed the strongest seasonally adjusted performance of the year and the best showing in nearly three years. In the Pattern Nexus framework, this is not a standalone housing story. It is a liquidity and rotation story: when one hard asset front-runs the cycle, the next leg is often a baton pass into the assets that can absorb leverage and scale.
What the Release Said
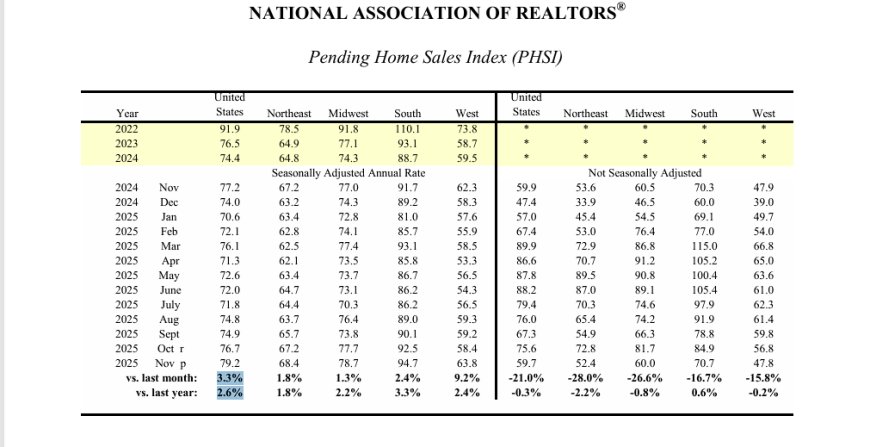
WASHINGTON (December 29, 2025) – Pending home sales in November jumped 3.3% from the prior month and rose 2.6% year over year, according to the National Association of REALTORS® Pending Home Sales Report. Month-over-month and year-over-year pending sales increased in the Northeast, Midwest, South, and West.
November’s REALTORS® Confidence Index survey also shifted modestly upward: 22% of members expect an increase in buyer traffic over the next three months (up from 17% in October), and 18% expect an increase in seller traffic (up from 16% last month).
“Homebuyer momentum is building. The data shows the strongest performance of the year after accounting for seasonal factors, and the best performance in nearly three years, dating back to February 2023,” said NAR Chief Economist Lawrence Yun. “Improving housing affordability–driven by lower mortgage rates and wage growth rising faster than home prices–is helping buyers test the market. More inventory choices compared to last year are also attracting more buyers to the market.”
November 2025 PHSI (Seasonally Adjusted):
- United States: +3.3% month over month, +2.6% year over year
- Northeast: +1.8% month over month, +1.8% year over year
- Midwest: +1.3% month over month, +2.2% year over year
- South: +2.4% month over month, +3.3% year over year
- West: +9.2% month over month, +2.4% year over year
The Pending Home Sales Index (PHSI) is a forward-looking indicator based on contract signings. An index level of 100 equals the contract activity level in 2001.
Why This Matters More Than People Think
Pending sales are not an opinion poll. They are forward contracts—capital commitments that typically translate into closed sales within one to two months. That timing link is exactly why this print matters: it is an early signal of near-term transaction throughput.
But the deeper signal is structural. In the Pattern Nexus view, housing does not trade like a normal consumer good. It trades like a hard asset embedded in the credit system. That means its marginal buyer is heavily influenced by financing conditions, risk appetite, and the market’s evolving belief about the path of policy and liquidity.
Hard-asset hierarchy (how liquidity typically rotates):
- Fast repricers: gold and silver (no financing needed, instant market clearing)
- Credit-embedded repricers: housing (long duration, naturally levered, large capacity)
- Real economy hard assets: energy, industrial inputs, land (policy, growth, and investment cycles)
When one hard asset outruns the others, rotation begins. Liquidity doesn’t exit the hard-asset bucket. It re-allocates inside it.
This is why a strong PHSI print can show up at the same time as weakness in precious metals: the market can be moving from “front-run easing” trades into “absorb scale” trades.
Why Gold and Silver Can Drop on a “Hard-Asset-Positive” Day
People treat gold and housing like they should rise together every day. That assumption fails in real time because hard-asset flows are not binary. They are rotational.
Gold and silver often move first when the system starts anticipating easier conditions because they are liquid and immediate. But once that repricing is established, marginal liquidity looks for assets that can take size and leverage. Housing is one of the largest liquidity sinks in the U.S. system because it is financed, securitized, and broadly held across households, banks, and institutional balance sheets.
Stated plainly: if precious metals lead the hard-asset complex early, it is normal for them to consolidate or sell off while housing catches up. That is not a contradiction. It is a baton pass.
Mechanism: Precious metals can be the “signal.” Housing can be the “throughput.”
Metals reprice the currency narrative quickly. Housing reprices more slowly, but when it moves, it absorbs far more balance-sheet capacity.
Why “Housing Is Overvalued” Misses the Mechanism
The most common critique is also the most incomplete: “Housing is overvalued.” Usually what that means is “housing is expensive in dollars.” But that is not the correct lens at turning points in liquidity regimes.
In a hard-asset framework, the central question is not whether housing is expensive relative to yesterday’s wages. The question is whether the currency and the credit system are moving toward tightening or easing conditions, and how quickly markets reprice that change.
If policy expectations shift toward easing, or if financial conditions loosen for any reason (rates, spreads, term premiums, risk tolerance), hard assets can reprice even when people keep repeating “overvalued.” That doesn’t mean fundamentals do not matter. It means the liquidity layer sets the range before narratives catch up.
Housing has a unique advantage in that environment: it is the hard asset most directly coupled to leverage. When buyers can finance a large notional asset with a relatively small equity check, the price level becomes more sensitive to credit conditions than to day-to-day sentiment.
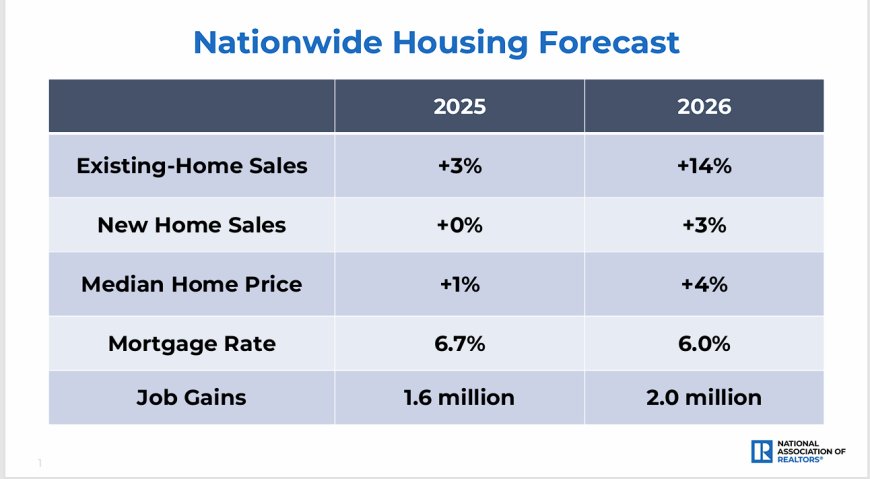
Even if someone believes housing should be “lower,” the real market question is whether the system is moving toward conditions that allow housing to clear at higher prices anyway. Hard assets do not wait for consensus.
What to Watch Next
- Follow-through: pending sales should translate into near-term existing-home sales as closings finalize (the usual one-to-two month lag).
- Financing friction: watch for mortgage availability, appraisal gaps, inspection renegotiations, and underwriting constraints that can break the pipeline between “pending” and “closed.”
- Inventory and seller behavior: more choice can lift transactions even if prices do not immediately surge. A market can “heal” through volume first.
- Hard-asset rotation: if housing strengthens while precious metals consolidate, that is consistent with rotation inside the hard-asset bucket, not a collapse of the thesis.
Release calendar note (from NAR): Existing-Home Sales for December will be reported on January 14. The next Pending Home Sales Index will be released on January 21. All release times are 10 a.m. Eastern.
Sources and Notes
- NAR Pending Home Sales Report text excerpt provided in-prompt (December 29, 2025).
- PHSI definition notes: pending sales are contracts signed but not yet closed; closings typically occur within one to two months; the index model uses a sample covering about 40% of MLS data each month and aligns with closed existing-home sales in the following two months.
- Regional changes listed are seasonally adjusted, as provided in the release excerpt.
Disclosure: This analysis is a structural liquidity-and-rotation framework discussion. It is not investment advice. Housing is local and financing dependent, and contract-to-close timelines vary by market and borrower conditions.
What's Your Reaction?
 Like
0
Like
0
 Dislike
0
Dislike
0
 Love
0
Love
0
 Funny
0
Funny
0
 Wow
0
Wow
0
 Sad
0
Sad
0
 Angry
0
Angry
0

Founder of Pattern Nexus. I research markets, macro, geopolitics, AI, history, ancient systems, and the patterns most people overlook. I’m also building Market Radar, a trading scanner designed to read pressure, risk, confirmation, and setup quality before chasing a move. Pattern Nexus is where I connect the dots between data, history, technology, and the bigger system playing out around us.















Comments (0)