
Scale Is Destiny: Why China Didn’t Pass the U.S. — and Why That Matters
A data-driven breakdown of U.S. versus China economic growth from 2000–2024, showing why China failed to overtake the United States despite years of projections. Using GDP levels, growth rates, and scale mathematics, this report explains how demographics, housing collapse, trade regimes, and financial infrastructure reshaped the outcome — and why marginal U.S. growth now moves the global system.
For 15 years, the standard narrative said China would overtake the United States as the world’s largest economy. Depending on the metric, that either already happened (PPP) or hasn’t happened at all (nominal current USD). This report uses 2000–2024 GDP level data and derived nominal YoY growth rates to show what actually occurred, and then explains why the convergence story stalled: property collapse, demographics, confidence, capital misallocation, trade and tech constraints, and currency translation effects. It also explains why the U.S. system has remained resilient: scale, institutional depth, innovation density, fiscal capacity, and the world’s default financial infrastructure.
Summary
The data show two realities at once. China’s GDP rose dramatically from 2000 to 2024 and created a new global economic pole. But China did not “take over” the U.S. in nominal current-dollar GDP. The U.S. remained larger, and the gap widened again in the 2021–2024 period.
This is not one single cause. It’s a stack: a property sector that stopped functioning as a growth engine, a demographic downshift, deflationary pressure and weak household confidence, local government debt constraints, and a post-2018 external regime shift (tariffs, supply-chain rerouting, and technology restrictions). On top of that, nominal USD GDP is heavily influenced by currency translation and global price regimes, which is where many “China passes the U.S.” forecasts got quietly wrecked.
The U.S. advantage is not “higher growth.” It is scale, institutional depth, innovation density, fiscal capacity, and settlement dominance. A mature system that can add hundreds of billions of dollars in economic mass with modest growth rates and can finance deficits in its own currency at global scale. That becomes self-reinforcing.
The First Trick: What “Largest Economy” Even Means
Most past forecasts were sloppy about the metric. There are two common ways analysts talk about “largest economy,” and they are not interchangeable.
- PPP GDP attempts to adjust for domestic purchasing power and price levels. On this basis, major institutions projected China could exceed the U.S. earlier, and some reporting has framed China as already “largest” under PPP definitions.
- Nominal GDP (current USD) is the global-financial metric: output valued at prevailing prices and converted into USD at current exchange rates. This is the metric that matters most for global finance, cross-border balance sheets, reserve structures, and comparative market capitalization.
Here’s the clean distinction. PPP answers “how much can people buy inside the country.” Nominal USD answers “how large is the economy in the world’s settlement unit.” The global system clears and collateralizes in the nominal unit, not the PPP unit. That’s why PPP comparisons can be true without translating into financial dominance.
Your charts here are nominal current USD. That is deliberate, because this is the regime where “pass the U.S.” was supposed to show up if the China-supercycle narrative was as clean as advertised.
Currency Translation: Why Nominal USD Is a Different Game
Nominal USD GDP is not just “growth.” It is growth plus inflation plus exchange-rate translation. If your currency weakens versus the dollar or if your domestic price regime turns deflationary, your USD GDP can flatten even while real output rises.
This is a key reason convergence narratives fail in practice. Many forecasts implicitly assume a smooth currency path and a stable global price regime. But in the real world, the U.S. is the magnet for capital under uncertainty. When global capital prefers dollar assets, the dollar strengthens, U.S. nominal GDP looks stronger in USD terms, and the gap widens mechanically against economies experiencing currency pressure or deflation.
So when you see China’s USD GDP line flattening post-2020, don’t interpret that as “China stopped existing.” Interpret it as: growth is no longer translating cleanly into USD mass at the same rate because the price/currency regime changed and domestic stress increased.
GDP Levels: The Scale Gap (2000–2024)
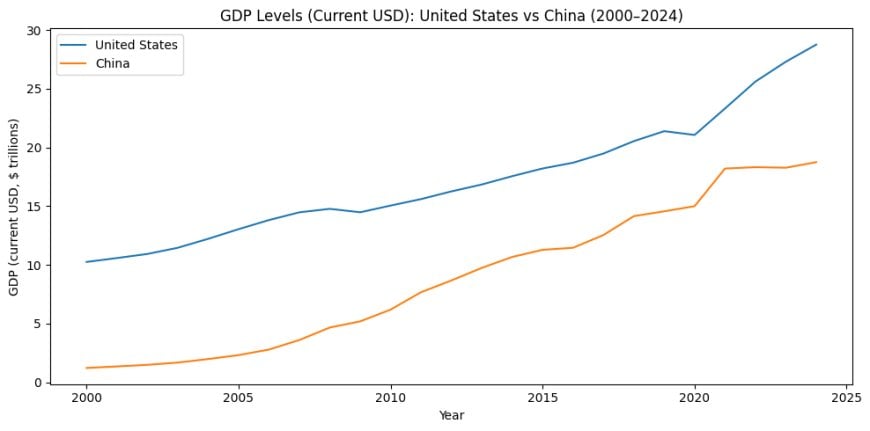
From 2000 through roughly 2019, the story looks like convergence: China’s line steepens, the U.S. line climbs steadily, and the distance compresses.
Then something changes. Post-2020, the U.S. line accelerates and China’s line flattens in USD terms. That does not mean China “stopped growing.” It means that in the global valuation currency (USD), China’s growth engine ran into both internal constraints and external translation effects.
This is the data version of what you’ve been saying for months: growth rates matter, but scale is the control lever. A large system that remains stable, liquid, and investable can reassert dominance fast.
Growth Rates: China’s Deceleration vs U.S. Stability
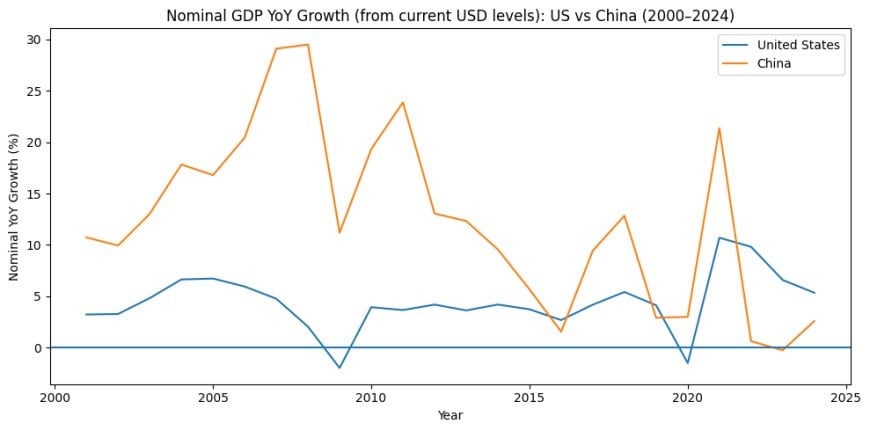
The nominal YoY chart is where the regime shift becomes obvious. China’s early-2000s to early-2010s period shows very high nominal growth, then a long deceleration trend. The U.S. profile is lower but smoother, interrupted by discrete shocks (2008–2009, 2020), and then a strong nominal rebound.
Two things matter here.
- China’s growth was structurally front-loaded. Early convergence is easy when you can absorb rural labor into urban manufacturing, build infrastructure at scale, and expand credit into a housing-led investment machine.
- Late-stage growth is harder. Once the system is built, the marginal return on new investment falls, demographics turn, and debt begins to consume the incremental output it used to create.
This is why “China passes the U.S.” was a reasonable extrapolation in 2010–2015, and a flawed extrapolation after 2018–2020. The slope changed, and then the translation regime changed with it.
The Mathematics of Scale: Why 1–2% U.S. Growth Is a World Event
This is the simple part, but it’s the part that ends arguments.
At roughly $28–29 trillion, the United States adds about $280–290 billion for every 1% of nominal growth.
- 1% growth is roughly a $0.28–0.29T expansion.
- ~1.7–1.8% growth is roughly a $0.5T expansion.
- 2% growth is roughly a $0.56–0.58T expansion.
So if someone says “the U.S. is only growing 2%,” the correct response is: that is half a trillion dollars a year in incremental economic mass. That is not a rounding error. That is an entire G20-country-sized addition every couple of years.
This is why the U.S. can “win” the decade with lower growth rates. Scale converts small percentages into large absolute deltas. And absolute deltas are what drive corporate profits, fiscal receipts, asset pricing, and global liquidity demand.
Why China Stumbled: The Real Stack of Constraints
China did not stall for one reason. It hit multiple binding constraints simultaneously. When they stack, the system loses the ability to self-correct quickly.
1) Property as a Growth Engine Broke
For decades, property and related sectors (construction, materials, local government land sales, household wealth effects) acted as a primary demand engine. When that engine breaks, you don’t just lose “real estate.” You lose a broad financing and confidence loop.
The IMF has explicitly described China’s real estate sector as facing a medium-term slowdown driven by structural factors, including demographics and slower urbanization, reducing the need for new housing. That means you do not get to simply “stimulus your way back” into the old growth model indefinitely. The underlying demand curve shifted.
2) Confidence, Consumption, and Deflation Dynamics
When property prices fall or stagnate, households get cautious. If households get cautious, consumption slows. When consumption slows in a system that already has excess capacity and debt, deflationary pressures can emerge. Deflation sounds good to people who think only in consumer prices. It is poison for a leveraged investment system, because falling prices increase real debt burdens and suppress risk-taking.
External estimates have questioned China’s official growth figures and highlighted deflationary pressure. Whether you accept those estimates fully or not, the directional pressure is consistent: demand is weaker than the old narrative implies, and the system is shifting into balance-sheet defense.
3) Local Government Finance and Debt Saturation
China’s local government model relied heavily on land sales and property-linked revenue. When that falls, local governments lose fiscal capacity exactly when the system needs counter-cyclical support. That pushes the system toward “support, but constrained” policy responses and forces triage: stabilize the system without reigniting the same bubble.
4) Diminishing Returns on Investment
Early infrastructure and housing investment can generate huge productivity gains. Late-stage investment can become malinvestment if it is primarily used to maintain employment and headline growth rather than to improve productivity. The marginal return declines, the debt remains, and the system becomes heavier.
China’s Property-Finance Loop: Land Sales, Presales, LGFVs
Property was not “a sector.” It was the financing rail.
In the classic China growth model, households parked savings into housing as a wealth store, developers used presales to fund construction, and local governments relied on land sales to finance spending and meet growth targets. That ecosystem created a feedback loop: rising property values supported confidence, revenue, and credit expansion.
When that loop breaks, the damage is not isolated. Household balance sheets tighten, developers retrench, local government revenues weaken, and the banking and shadow-finance complex shifts from expansion to risk containment. That is the difference between a cyclical housing dip and a structural regime change.
This is also why stimulus gets harder. Stimulus that used to flow cleanly through property no longer transmits the same way. The system becomes more risk-aware, more politically sensitive, and more focused on containing instability than maximizing headline growth.
Tariffs, Supply Chains, and the Post-2018 Regime Shift
The 2018–2019 tariff escalation was not just a trade event. It was a regime shift. It accelerated supply-chain diversification away from China and increased uncertainty for Chinese firms operating in export-facing sectors.
The IMF noted that U.S.–China trade tensions reduced bilateral trade and risked disrupting supply chains and business sentiment. Separate research has documented that increased trade policy uncertainty during the trade war impaired Chinese firm investment and R&D. The direct tariff line is only one channel. The uncertainty channel matters just as much.
Then came the second-order effect: China+1, friendshoring, and redundancy spending. Even when factories do not leave overnight, new incremental capacity and new strategic supply chains increasingly get routed elsewhere. That doesn’t erase China. It changes the direction of the marginal dollar of global capex.
This is why the “China passes the U.S.” storyline weakened after 2018: the global system stopped treating China as the uncontested next default manufacturing platform and started treating it as a geopolitically constrained node.
Tech Controls and the New Constraint
After 2018, the regime shift was not only tariffs. It was strategic technology restriction, investment screening, and a rising geopolitical risk premium. Even if exports hold up, the cost of capital rises when firms and investors price in constraint risk, compliance risk, and supply-chain uncertainty.
This matters because late-stage growth depends less on “more factories” and more on productivity, frontier technology diffusion, and high-margin value capture. If your path to the frontier is constrained, you can still grow, but you cannot compound the same way, and you can’t rely on the same profit-layer integration with the U.S.-centric financial and technology stack.
Demographics and the Population Data Debate
The demographic downshift is non-negotiable. Even without any controversy, China’s population is aging rapidly, and the working-age cohort is not expanding the way it did in the 1990s and 2000s. That alone reduces the economy’s natural growth rate and lowers the future demand curve for housing and consumer expansion.
On top of that, there is an active debate about whether China’s population has been overstated by a significant margin. Some analysts have claimed the true population may be materially lower than official figures, while other demographers dispute the magnitude and the claim itself. The important point for macro is not the exact number. It is the direction: the demographic tailwind is gone, and the system now has to grow under aging, lower household formation, and lower future housing demand.
Why “China Will Pass the U.S.” Forecasts Broke
Most of the famous 2010–2015 era projections were not “wrong math.” They were fragile assumptions.
They assumed four conditions would remain true at the same time.
- High China growth would persist long enough to overcome the U.S. lead, despite the historical pattern that convergence growth slows as economies mature.
- Property would remain a stable demand and financing engine, rather than becoming a constraint, a drag, and a risk-management problem.
- Demographics would remain manageable, rather than turning into a structural headwind for consumption, housing demand, and labor supply.
- Global integration would remain smooth, rather than shifting into tariffs, tech restrictions, supply-chain diversification, and a higher geopolitical risk premium.
When those assumptions broke, the slope changed. Then the currency/price regime changed. And that combination is exactly how “inevitable” forecasts die: not with a single collapse, but with a multi-variable constraint stack that prevents the old model from restarting.
China can still grow. But “China passes the U.S. in nominal USD” is no longer a simple extrapolation. It would require either a re-acceleration of China’s model in a friendlier global regime, or a significant U.S. breakdown. Neither is the default path.
Why the American Economy Has Held Up
The U.S. is not “doing well” because everything is healthy. The U.S. is doing well because it has multiple resilience layers that keep the system online even when parts of it are fragile.
1) The U.S. Is the Default Financial Infrastructure
This is the root advantage. The U.S. is not just an economy. It is the settlement layer for global finance. That means capital gravitates to U.S. assets under uncertainty. That capital supports valuation, investment, and fiscal capacity. When the world gets nervous, it doesn’t buy “GDP.” It buys Treasuries, dollars, and U.S. balance sheet exposure.
2) Consumer Resilience and a High-Income Spend Engine
U.S. demand has remained more resilient than many models predicted because the system has a large high-income cohort with asset exposure and spending capacity, and because policy response post-2020 reinforced nominal incomes and balance sheets. Distribution is uneven, but in GDP terms, the spend engine has held longer than expected.
3) Innovation Density and AI/Tech Capital Formation
The U.S. has an unmatched density of high-margin, globally scalable firms. When a new capex cycle emerges, the U.S. tends to capture the financing and the profit layer. This matters because modern dominance is less about who manufactures the most units and more about who owns the software, platforms, IP, cloud rails, and capital markets that intermediate the entire system.
4) Profit-Layer Capture: The U.S. Owns the High-Margin Stack
The U.S. disproportionately captures profit layers: software, semiconductors, platforms, IP rents, and capital-market intermediation. That means global growth often routes into U.S. corporate earnings and U.S. asset valuations, reinforcing nominal strength and fiscal capacity. This is one of the most under-discussed reasons U.S. nominal dominance persists even when manufacturing share debates rage.
5) Energy Advantage: Lower Marginal Stress
The U.S. energy system has provided a structural buffer many peers lack. Domestic production capacity reduces external constraint pressure and helps keep industry, logistics, and consumption less exposed to global supply shocks. It doesn’t solve every problem. It lowers fragility at the margin, and margin matters at scale.
6) Fiscal Capacity and Policy Flexibility
The U.S. can run large deficits for long periods because markets treat Treasuries as core collateral and because the dollar is the reserve unit. This is not “free.” It carries inflation and distributional consequences. But it does keep nominal GDP supported through shocks, and it allows the system to absorb crises without immediate funding constraints.
7) Demographics and Labor Flexibility Compared to Peers
Relative to other advanced economies, the U.S. benefits from more flexible labor markets and population inflows that support consumption and labor supply. That flexibility helps the system reallocate faster after shocks, and it reduces the probability of stagnation locking in permanently.
Scenario Projection: 2025–2030 and What It Actually Means
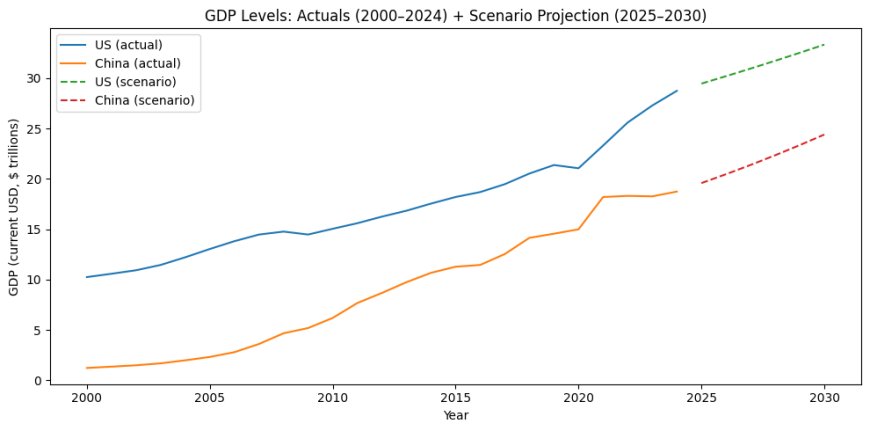
The projection chart is not prophecy. It is a mechanical demonstration of scale.
Even if China grows faster in percentage terms, the U.S. can continue adding comparable or larger absolute GDP because of the base effect. That is why “China will pass the U.S.” became far less certain once China’s growth decelerated, property turned from engine to constraint, and the global regime shifted toward tariffs, tech restrictions, and higher risk premia.
Projections from 15 years ago failed because they assumed sustained high Chinese growth, a stable property engine, favorable demographics, and a smooth global integration path. Those assumptions broke, and nominal USD translation amplified the divergence.
The Pattern Nexus Lens
This is not a “China bad, U.S. good” story. It is a control-system story.
China’s model delivered a historic growth miracle by using investment, property, and export manufacturing to compress a century of development into decades. That model is now saturated. The marginal return is lower, the demographic structure is adverse, and the global environment is less permissive.
The U.S. model is messier and more unequal, but it is structurally advantaged in the domains that matter most for 21st-century power: financial infrastructure, technology profit layers, institutional capital markets, energy buffers, and the reserve currency settlement unit.
So when people say “China was supposed to pass the U.S.” the correct response is: it depends on the metric. PPP is one story. Nominal USD dominance is another. And nominal USD dominance is the one that drives global collateral, cross-border balance sheets, and control layers.
Scale is destiny. But scale only stays destiny if the system remains investable, innovative, and liquid. That is the actual contest.
What Is PPP (Purchasing Power Parity) — and Why It Keeps Confusing the China vs U.S. Debate
Purchasing Power Parity (PPP) is a method of comparing economic output by adjusting for differences in price levels and cost of living across countries. Instead of valuing production at market exchange rates, PPP asks a different question:
“How much real goods and services does this economy produce when measured in local purchasing power, rather than in global financial prices?”
To do this, economists construct a standardized international basket of goods and services — housing, food, transportation, labor, healthcare, utilities — and calculate what it costs to buy that same basket in each country. Exchange rates are then adjusted so that one unit of currency buys the same basket everywhere.
PPP in practice: why China looks larger
Because wages, services, construction, and many domestic costs are substantially lower in China than in the United States, a dollar-equivalent amount of money buys far more real activity inside China. When GDP is adjusted for this lower price level, China’s total output appears much larger.
Using IMF and World Bank PPP estimates in recent years:
- China (PPP GDP): approximately $40–45 trillion
- United States (PPP GDP): approximately $30–33 trillion
On a PPP basis, China surpassed the U.S. years ago. This is why you will often see headlines claiming “China is already the world’s largest economy.”
What PPP is good at measuring
PPP is extremely useful for:
- Comparing domestic living standards
- Estimating real internal production capacity
- Assessing poverty, development, and consumption potential
- Long-run structural comparisons between economies at different income levels
If your question is “How much physical and service output exists inside China relative to the U.S.?” PPP is often the right tool.
Where PPP breaks down for power, finance, and markets
PPP does not tell you how large an economy is in the units that the global system actually uses to clear transactions.
Global finance does not operate in PPP-adjusted units. It operates in:
- Market exchange rates
- U.S. dollars as the settlement currency
- Dollar-denominated collateral and debt
- Dollar-priced commodities and capital markets
Oil is not priced in “PPP dollars.” Treasuries are not issued in “PPP units.” Cross-border debt, trade invoicing, equity valuation, reserve accumulation, and balance-sheet strength all operate in nominal currencies — overwhelmingly the U.S. dollar.
That is why nominal GDP (current USD) remains the dominant metric for:
- Financial power
- Reserve currency status
- Capital market depth
- Geopolitical leverage
- Systemic risk transmission
The core confusion: two different questions, one bad argument
Most “China will pass the U.S.” debates collapsed because they quietly mixed two different questions:
- PPP question: “How much real output does this economy generate domestically?”
- Nominal question: “How large is this economy in the global financial system’s unit of account?”
China can be larger under PPP and still fail to overtake the U.S. in nominal USD terms — and that is exactly what happened.
The forecasts that said “China will inevitably pass the U.S.” implicitly assumed:
- China’s currency would strengthen or remain stable versus the dollar
- Domestic prices would continue inflating rather than deflating
- Capital controls, risk premia, and geopolitical frictions would not matter
- PPP dominance would eventually translate into nominal dominance
Those assumptions did not hold.
Why PPP dominance did not convert into nominal dominance
Three mechanisms blocked the translation:
- Currency translation: Slower growth, capital outflows, and deflationary pressure prevented PPP output from converting into USD mass.
- Financial structure: China’s economy produces enormous real output, but the profit, equity, and reserve layers remain disproportionately U.S.-centric.
- Global regime shift: Tariffs, tech controls, and supply-chain diversification raised China’s risk premium and lowered the willingness of global capital to treat Chinese output as dollar-equivalent.
PPP tells you China is big. Nominal USD tells you who controls the pipes.
The Pattern Nexus takeaway
PPP is not “fake.” It answers a different question.
But when analysts use PPP to argue that China has already overtaken the United States in any meaningful global power sense, they are switching metrics mid-argument.
China dominates in real domestic output under PPP. The United States still dominates the global financial control layer under nominal USD. Until those two layers converge — currency, capital markets, settlement, and reserves — PPP leadership alone does not flip the system.
Source Notes
GDP level data in the charts uses World Bank WDI “GDP (current US$)” series as distributed via FRED for the United States and China. This is nominal current-USD GDP and therefore includes real growth, domestic inflation, and currency translation effects.
PPP framing and “China as largest economy” discussions have been cited in U.S. Congressional Research Service materials and IMF projections on a PPP basis.
China property sector slowdown and structural demand headwinds are consistent with IMF analysis emphasizing demographics, slowing urbanization, and reduced need for additional new housing.
Tariff and trade-tension impacts are consistent with IMF commentary describing reduced bilateral trade and broader confidence and supply-chain disruption channels, with additional research showing trade policy uncertainty effects on Chinese firm investment and R&D.
Population overstatement claims are actively debated; references include public reporting of claims by individual researchers and commentary from demographers highlighting disagreement about magnitude and interpretation.
U.S. resilience points are supported by U.S. Treasury commentary on outperformance dimensions, OECD framing on resilience with underlying fragilities, and reporting on U.S. growth drivers including consumption and technology investment.
Sources
- IMF – China Real Estate Sector (Medium-Term Slowdown)
https://www.imf.org/en/News/Articles/2023/08/03/cf-china-real-estate-sector-and-financial-stability - IMF – U.S.–China Trade Tensions and Supply-Chain / Business Sentiment Effects
https://www.imf.org/en/Blogs/Articles/2019/05/21/blog-the-economic-effects-of-the-us-china-trade-dispute - IMF – Tariff Escalation Coverage Magnitude (2018–2019)
https://www.imf.org/en/Publications/WP/Issues/2019/07/26/The-Impact-of-Trade-Tensions-on-Global-Trade-Output-and-Investment-47132 - Congressional Research Service – China vs U.S. Economy (PPP Framing)
https://crsreports.congress.gov/product/pdf/R/R46937 - Goldman Sachs – Long-Horizon Projection on China Overtaking U.S.
https://www.goldmansachs.com/insights/pages/gs-research/china-2025/ - Reuters – China Slowdown Drivers and Questions Around Headline Growth
https://www.reuters.com/world/china/chinas-economic-growth-data-come-under-scrutiny-2023-01-18/ - U.S. Department of the Treasury – U.S. Economy in Global Context
https://home.treasury.gov/news/press-releases/jy1981 - OECD – United States Economic Survey and Macro Imbalances
https://www.oecd.org/economy/united-states-economic-snapshot/ - OECD – Outlook on AI and Technology Investment Upside
https://www.oecd.org/economic-outlook/ - Newsweek – China Population Overstatement Claims and Academic Debate
https://www.newsweek.com/china-population-overstated-demographics-analysts-1822054 - Reuters – U.S. Growth Drivers (Consumer Spending, Exports, Tech/AI Investment)
https://www.reuters.com/world/us/us-economy-growth-consumer-spending-ai-investment-2024-02-01/ - The Wall Street Journal – U.S. Economic Growth and Technology Investment
https://www.wsj.com/economy
What's Your Reaction?
 Like
0
Like
0
 Dislike
0
Dislike
0
 Love
0
Love
0
 Funny
0
Funny
0
 Wow
0
Wow
0
 Sad
0
Sad
0
 Angry
0
Angry
0

Founder of Pattern Nexus. I research markets, macro, geopolitics, AI, history, ancient systems, and the patterns most people overlook. I’m also building Market Radar, a trading scanner designed to read pressure, risk, confirmation, and setup quality before chasing a move. Pattern Nexus is where I connect the dots between data, history, technology, and the bigger system playing out around us.





















Comments (0)